Saturday, July 31, 2021

U.S. Deflation Probability Chart Through July 2021

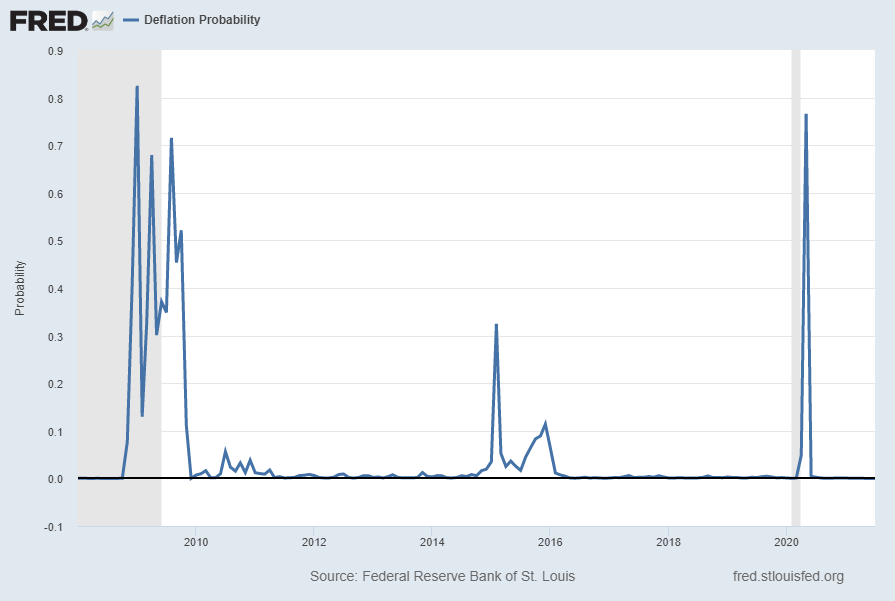
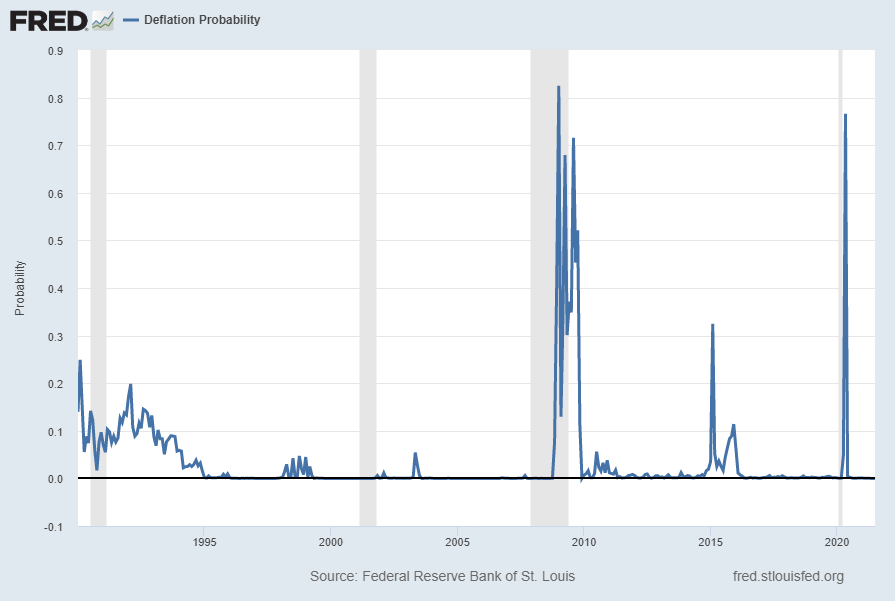
For reference, below is a chart of the St. Louis Fed Price Pressures Measures – Deflation Probability [FRED STLPPMDEF] through July 2021.

While I do not necessarily agree with the current readings of the measure, I view this as a proxy of U.S. deflation probability.

A description of this measure, as seen in FRED:

This series measures the probability that the personal consumption expenditures price index (PCEPI) inflation rate (12-month changes) over the next 12 months will fall below zero.

The chart, on a monthly basis from January 1990 – July 2021, with a last reading of .00005, last updated on July 30, 2021:

St. Louis Fed Price Pressures Measures – Deflation Probability

Here is this same U.S. deflation probability measure since 2008:

Deflation probability

source:  Federal Reserve Bank of St. Louis, Deflation Probability [STLPPMDEF], retrieved from FRED, Federal Reserve Bank of St. Louis; accessed July 30, 2021: https://fred.stlouisfed.org/series/STLPPMDEF

_________

I post various economic indicators and indices because I believe they should be carefully monitored.  However, as those familiar with this site are aware, I do not necessarily agree with what they depict or imply.

_____

The Special Note summarizes my overall thoughts about our economic situation

SPX at 4395.26 as this post is written

Friday, July 30, 2021

Consumer Confidence Surveys – As Of July 30, 2021

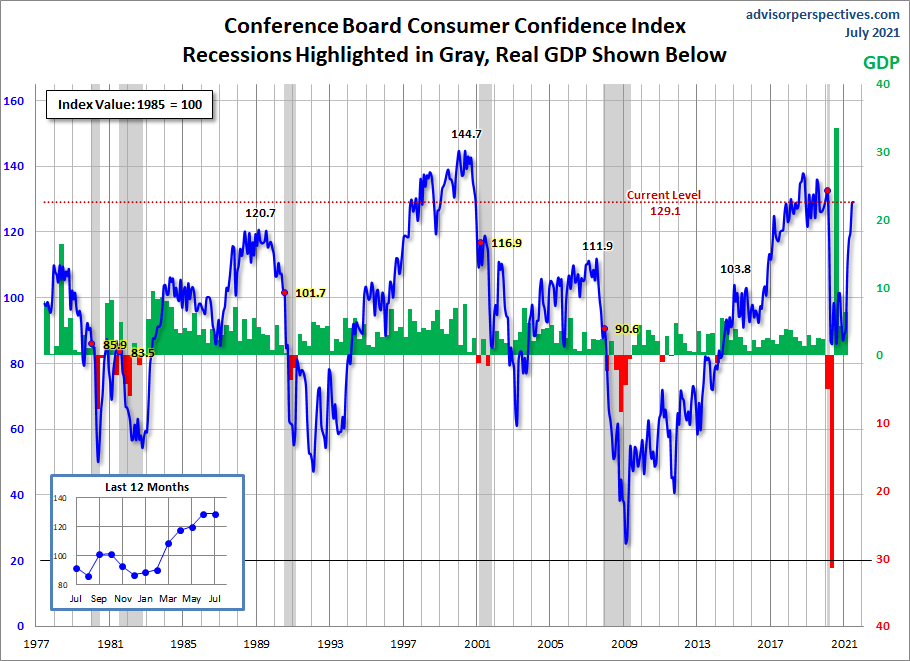
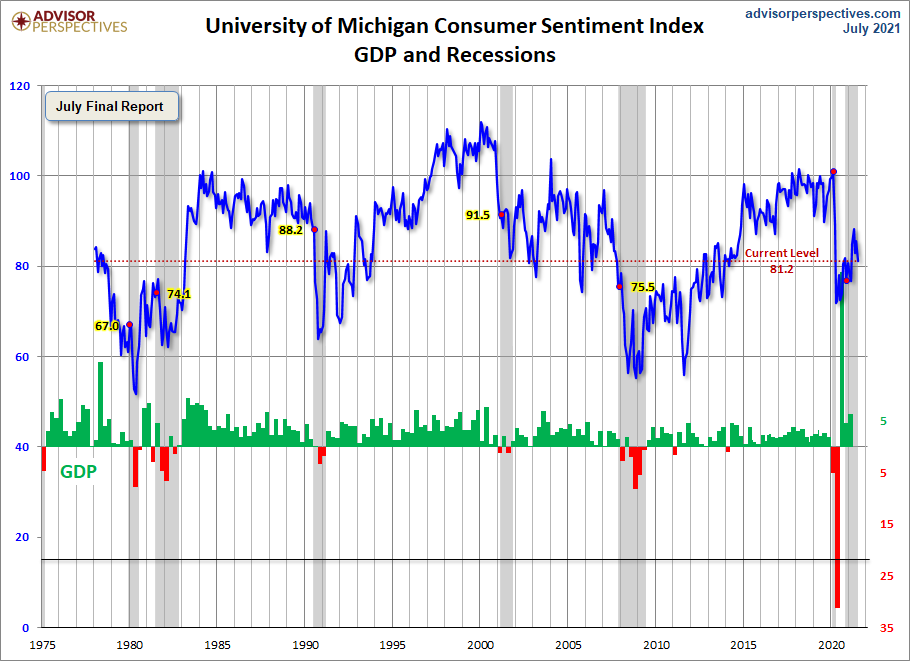
Advisor Perspectives had a post of July 30, 2021 (“Michigan Consumer Sentiment…“) that displays the latest Conference Board Consumer Confidence and Thomson/Reuters University of Michigan Consumer Sentiment Index charts.  They are presented below:

(click on charts to enlarge images)

Conference Board Consumer Confidence

University of Michigan Consumer Sentiment Index

While I don’t believe that confidence surveys should be overemphasized, I find these readings and trends to be notable, especially in light of a variety of other highly disconcerting measures highlighted throughout this site.

_____

The Special Note summarizes my overall thoughts about our economic situation

SPX at 4395.26 as this post is written

Employment Cost Index (ECI) – June 2021

While the concept of Americans’ incomes can be defined in a number of ways, many prominent measures continue to show disconcerting trends.

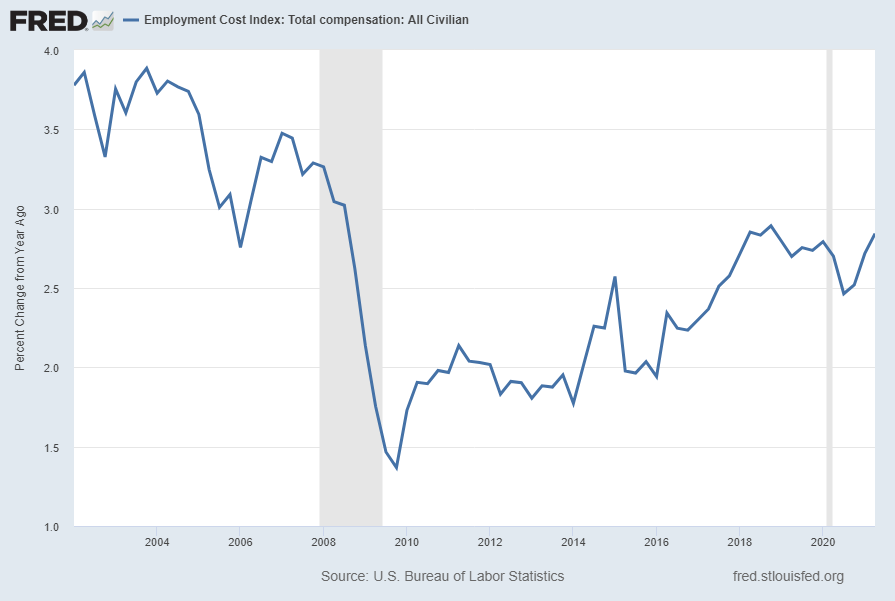
One prominent measure is the Employment Cost Index (ECI).

Here is a description from the BLS document titled “The Employment Cost Index:  what is it?“:

The Employment Cost Index (ECI) is a quarterly measure of the change in the price of labor, defined as compensation per employee hour worked. Closely watched by many economists, the ECI is an indicator of cost pressures within companies that could lead to price inflation for finished goods and services. The index measures changes in the cost of compensation not only for wages and salaries, but also for an extensive list of benefits. As a fixed-weight, or Laspeyres, index, the ECI controls for changes occurring over time in the industrial-occupational composition of employment.

On July 30, 2021, the latest ECI report was released.  Here are two excerpts from the BLS release titled “Employment Cost Index – June 2021“:

Compensation costs for civilian workers increased 0.7 percent, seasonally adjusted, for the 3-month period ending in June 2021, the U.S. Bureau of Labor Statistics reported today. Wages and salaries increased 0.9 percent and benefit costs increased 0.4 percent from March 2021. (See tables A, 1, 2, and 3.)

also:

Compensation costs for civilian workers increased 2.9 percent for the 12-month period ending in June 2021 and increased 2.7 percent in June 2020. Wages and salaries increased 3.2 percent for the 12-month period ending in June 2021 and increased 2.9 percent for the 12-month period ending in June 2020. Benefit costs increased 2.2 percent over the year and increased 2.2 percent for the 12-month period ending in June 2020. (See tables A, 4, 8, and 12.)

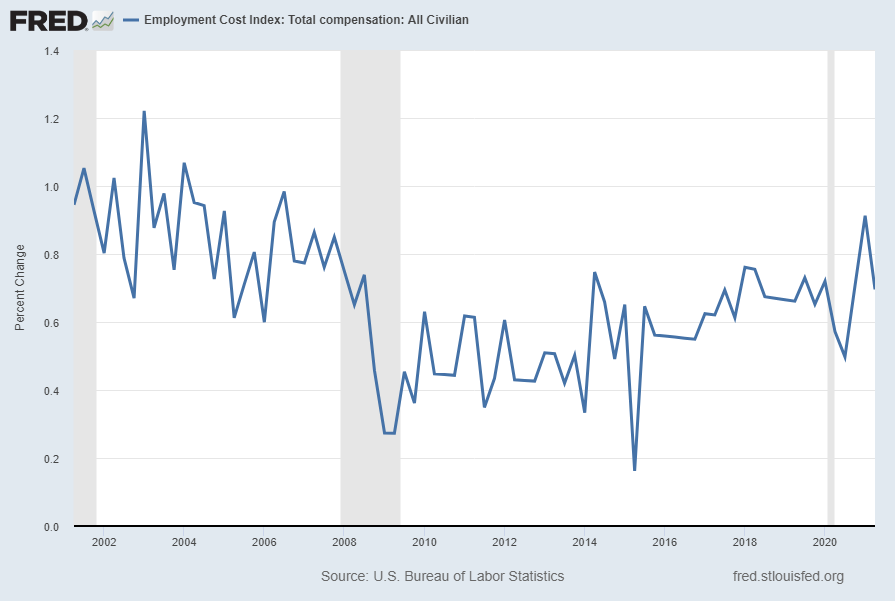
Below are three charts, updated on July 30, 2021 that depict various aspects of the ECI, which is seasonally adjusted (SA):

The first depicts the ECI, with a value of 144.7:

Employment Cost Index (ECI) 144.7

source: US. Bureau of Labor Statistics, Employment Cost Index: Total compensation: All Civilian [ECIALLCIV], retrieved from FRED, Federal Reserve Bank of St. Louis, accessed July 30, 2021: 
https://research.stlouisfed.org/fred2/series/ECIALLCIV/

The second chart depicts the ECI on a “Percent Change from Year Ago” basis, with a value of 2.8%:

Employment Cost Index (ECI) 2.8 Percent Change From Year Ago

The third chart depicts the ECI on a “Percent Change” (from last quarter) basis, with a value of .7%:

Employment Cost Index (ECI) .7 Percent Change

_________

I post various indicators and indices because I believe they should be carefully monitored.  However, as those familiar with this site are aware, I do not necessarily agree with what they depict or imply.

_____

The Special Note summarizes my overall thoughts about our economic situation

SPX at 4400.16 as this post is written

Another Recession Probability Indicator – Updated Through Q1 2021

Each month I have been highlighting various estimates of U.S. recession probabilities.  The latest update was that of July 7, 2021, titled “Recession Probability Models – July 2021.”

While I don’t agree with the methodologies employed or the probabilities of impending economic weakness as depicted by these and other estimates, I do believe that the results of these models and estimates should be monitored.

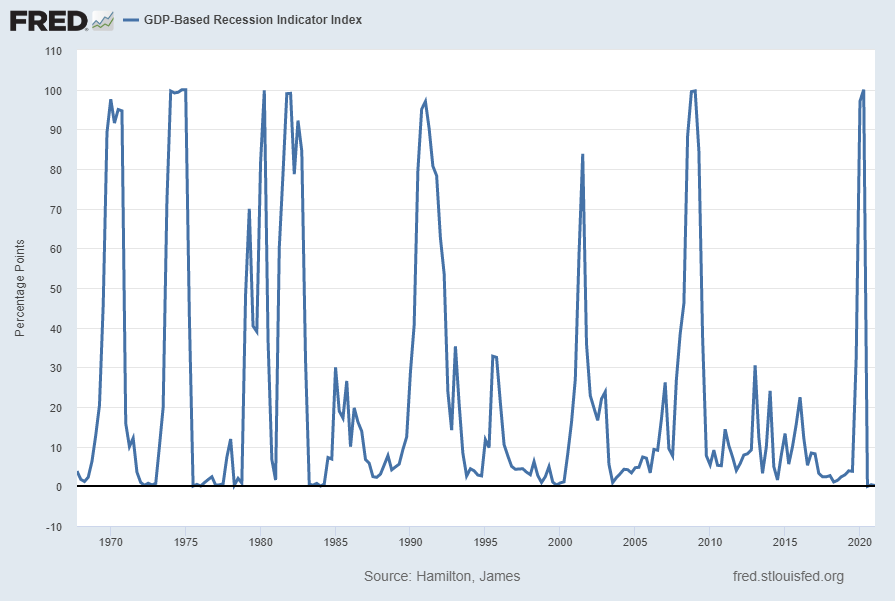
Another probability of recession is provided by James Hamilton, and it is titled “GDP-Based Recession Indicator Index.”  A description of this index, as seen in FRED:

This index measures the probability that the U.S. economy was in a recession during the indicated quarter. It is based on a mathematical description of the way that recessions differ from expansions. The index corresponds to the probability (measured in percent) that the underlying true economic regime is one of recession based on the available data. Whereas the NBER business cycle dates are based on a subjective assessment of a variety of indicators that may not be released until several years after the event , this index is entirely mechanical, is based solely on currently available GDP data and is reported every quarter. Due to the possibility of data revisions and the challenges in accurately identifying the business cycle phase, the index is calculated for the quarter just preceding the most recently available GDP numbers. Once the index is calculated for that quarter, it is never subsequently revised. The value at every date was inferred using only data that were available one quarter after that date and as those data were reported at the time.

If the value of the index rises above 67% that is a historically reliable indicator that the economy has entered a recession. Once this threshold has been passed, if it falls below 33% that is a reliable indicator that the recession is over.

Additional reference sources for this index and its construction can be seen in the Econbrowser post of February 14, 2016 titled “Recession probabilities” as well as on the “The Econbrowser Recession Indicator Index” page.

Below is a chart depicting the most recent value of .20000% for the first quarter of 2021, last updated on July 29, 2021 (after the July 29, 2021 Gross Domestic Product, Second Quarter 2021 (Advance Estimate):

GDP-Based Recession Indicator Index

source:  Hamilton, James, GDP-Based Recession Indicator Index [JHGDPBRINDX], retrieved from FRED, Federal Reserve Bank of St. Louis; accessed July 30, 2021: 
https://research.stlouisfed.org/fred2/series/JHGDPBRINDX

_________

I post various indicators and indices because I believe they should be carefully monitored.  However, as those familiar with this site are aware, I do not necessarily agree with what they depict or imply.

_____

The Special Note summarizes my overall thoughts about our economic situation

SPX at 4419.15 as this post is written

Thursday, July 29, 2021

Velocity Of Money – Charts Updated Through July 29, 2021

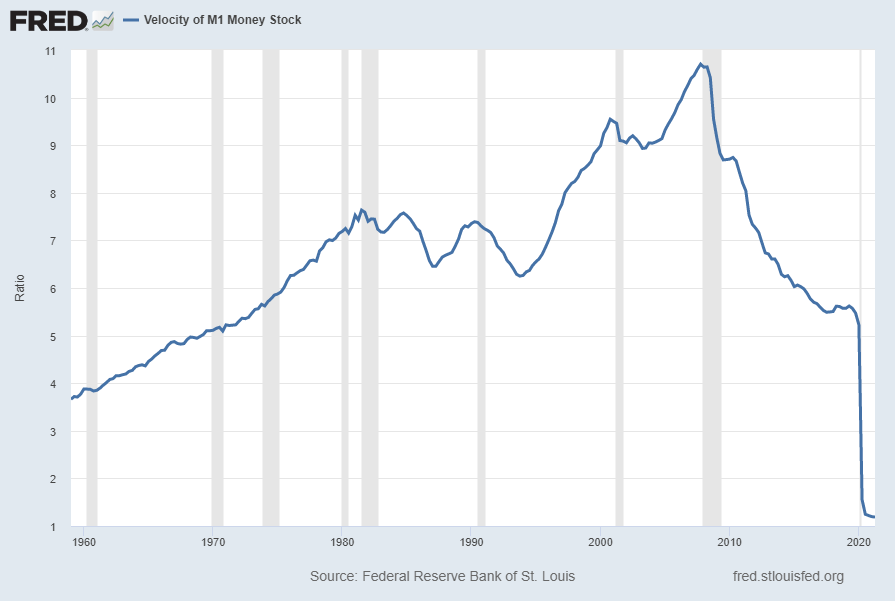
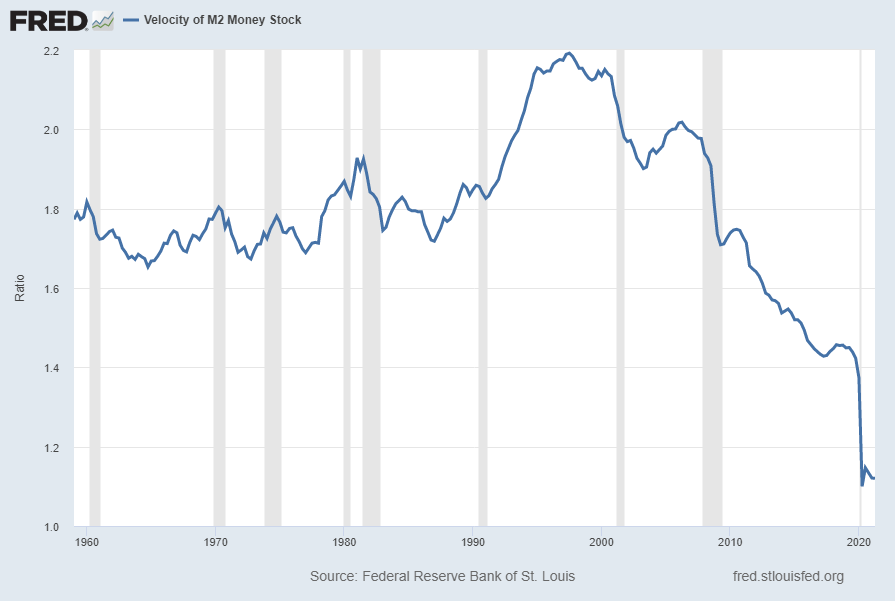
Here are two charts from the St. Louis Fed depicting the velocity of money in terms of the M1 and M2 money supply measures.

All charts reflect quarterly data through the 2nd quarter of 2021, and were last updated as of July 29, 2021.

Velocity of M1 Money Stock, current value = 1.187:

M1V 1.187

Data Source: FRED, Federal Reserve Economic Data, Federal Reserve Bank of St. Louis; accessed July 29, 2021: 
http://research.stlouisfed.org/fred2/series/M1V

Velocity of M2 Money Stock, current value = 1.120:

M2V 1.120

Data Source: FRED, Federal Reserve Economic Data, Federal Reserve Bank of St. Louis; accessed July 29, 2021: 
http://research.stlouisfed.org/fred2/series/M2V

_________

I post various indicators and indices because I believe they should be carefully monitored.  However, as those familiar with this site are aware, I do not necessarily agree with what they depict or imply.

_____

The Special Note summarizes my overall thoughts about our economic situation

SPX at 4429.17 as this post is written

Jerome Powell’s July 28, 2021 Press Conference – Notable Aspects

On Wednesday, July 28, 2021 FOMC Chairman Jerome Powell gave his scheduled July 2021 FOMC Press Conference. (link of video and related materials)

Below are Jerome Powell’s comments I found most notable – although I don’t necessarily agree with them – in the order they appear in the transcript.  These comments are excerpted from the “Transcript of Chairman Powell’s Press Conference“ (preliminary)(pdf) of July 28, 2021, with the accompanying “FOMC Statement.”

Excerpts from Chairman Powell’s opening comments:

Today the Federal Open Market Committee kept interest rates near zero and maintained our asset purchases.  These measures, along with our strong guidance on interest rates and on our balance sheet, will ensure that monetary policy will continue to support to the economy until the recovery is complete.

also:

The Fed’s policy actions have been guided by our mandate to promote maximum employment and stable prices for the American people, along with our responsibilities to promote the stability of the financial system.  As the Committee reiterated in today’s policy statement, with inflation having run persistently below 2 percent, we will aim to achieve inflation moderately above 2 percent for some time so that inflation averages 2 percent over time and longer-term inflation expectations remain well anchored at 2 percent.  We expect to maintain an accommodative stance of monetary policy until these employment and inflation outcomes are achieved.  With regard to interest rates, we continue to expect that it will be appropriate to maintain the current 0 to ¼ percent target range for the federal funds rate until labor market conditions have reached levels consistent with the Committee’s assessment of maximum employment and inflation has risen to 2 percent and is on track to moderately exceed 2 percent for some time.

also:

To conclude, we understand that our actions affect communities, families, and businesses across the country.  Everything we do is in service to our public mission.  We at the Fed will do everything we can to support the economy for as long as it takes to complete the recovery.  

Thank you.  I look forward to your questions.

Excerpts of Jerome Powell’s responses as indicated to various questions:

JAMES POLITI. Thank you very much. Chair Powell, how would you describe the risk to the outlook on inflation at the moment after the last data came out higher than expected? Do you believe the risk are, you know, tilted to the upside? And does the Committee share that view? Or are they in balance? Are you still worried that there could be a hit to demand from the Delta variant that could tilt them sort of to the downside again? If you could give us a sense of that, that would be very helpful. 

CHAIR POWELL. Sure. I’d be glad to. So if you look, again, if you look at the most recent inflation report, what you see is that it came in significantly higher than expected. But essentially all of the overshoot can be tied to a handful of categories. It isn’t the kind of inflation that’s spread broadly across the economy. It’s new, used and rental cars; it’s airplane tickets; it’s hotels and it’s a couple of other things. And each of those has a story attached to it that is — it is really about the reopening of the economy. So we look at that and we think that those are temporary things because the supply side will respond. The economy will adapt. We have a very adaptive, adaptable, flexible economy and labor market. And it’s a real — a real asset that we have. And so we think that inflation should move down over time. Now, we don’t have any — much confidence, let’s say, in the timing of that or the size of the effects in the near term. I would say in the near term that the — the risks to inflation are probably to the upside. I have some confidence in the medium term that inflation will move back down. Again, it’s hard to say when that will be. I will say, though, that, you know, we — inflation is half of our mandate. Price stability is half of our mandate. And if we were to see inflation moving up to levels persistently that were — that were above, significantly, materially above our goal and particularly if inflation expectations were to move up, we would use our tools to guide inflation back down to 2 percent. So, we won’t have an extended period of high inflation. We think that some of it will fall away naturally as the process of reopening the economy moves through. And it could take some time. In any case, we will use our tools over time as appropriate to make sure that we do have inflation that averages 2 percent over time. 

also:

EDWARD LAWRENCE.  Thank you, Mr. Chairman. Thank you, Mr. Chairman, for taking the question. So, you’re talking about jobs. You just said we’re on a path to a very strong job market. You know, we have 9.5 million people unemployed as of the last labor market survey and 9.2 million job openings. So, what’s the — what’s the disconnect? Is it a skills gap? Is it the extended unemployment benefits? Is it the fact that people just aren’t willing to relocate? What is the disconnect there? 

CHAIR POWELL.  It’s a — it’s a really unusual situation to have — to have the ratio of vacancies to unemployed be this high. And we think there are a number of things at work there. Maybe the place to start is just to say that this is now not so much about people going back to their old jobs. It’s about finding a new job. So that’s a time-intensive, labor-intensive process. And there may be a bit of a speed limit on that. There’s research that suggests that there is a speed limit on that. So it’s not like you can have millions of people at the beginning of the recovery going back in a single month because they’re just going back to their old job. This is about job selection, things like that. There may also be some factors that are that are holding people back, and that’s — this is what surveys say. There are people who are reluctant to go back to work because they still feel exposed to COVID. These could be jobs where there was a lot of interaction with the public and where perhaps there’s a family member who’s vulnerable or for whatever reason. There’s also caretakers who are — where schools are not fully open and parents are at home or taking care of older people. And there’s also been very generous unemployment benefits, which are now rolling off. They’ll be fully rolled off in a couple of months. And, all of those factors should wane. And, you know, we think we should see — because of that, we should see strong job creation moving forward. I mean, ultimately, it’s unusual to see aspects like the job openings number in a context where there are that many unemployed people. That many job openings would typically suggest a tight labor market. Of course, we hear from businesses all over the country that it’s very hard to hire people. And that may be because people — people are shopping carefully for their next job. I mean, I think the bottom line on this is people want to work. If you look at where labor force participation can get, people will go back to work unless they retire. Some people will retire. But, generally speaking, Americans want to work; and they’ll find their way into the jobs that they want. It may take some time, though. 

also:

MICHAEL MCKEE. Well, if I could follow up, several people have recently noted that the Fed has got the markets working well. And you’ve got bank loans up. In other words, you’ve stimulated demand. But savers and companies like insurance companies and pension funds are getting hammered by the low rates. And they’re wondering if the balance hasn’t started to shift away from benefiting the economy to doing more harm than good. 

CHAIR POWELL. We — asset purchases were just a key part of our response to the critical phase of the crisis. They really helped us restore market function to these key markets, really, on which — which are very, very important to our economy and the global economy. And then they were a big part of creating accommodative financial conditions to support demand. They were strongly needed. It was that commitment to continue asset purchases that provided strong support for the economy and has been a part of the story for why the economy is so strong right now. So we said we would taper when we achieve substantial further progress. And, you know, we’re going to honor that commitment. I mean, it’s — and, again, we’re talking about it right now and meeting by meeting and moving in that direction. We will taper when we reach that goal. And we’ll provide more — you know, more clarity on that as we go, as is appropriate.

also:

MICHAEL DERBY. Thank you very much. Yeah. So I wanted to ask you about the standing repo facility and get your sense of what you think it will do for market trading conditions. And also, kind of a similarly related point, the reverse repo numbers have just gotten even bigger since you raise the reverse repo rate at the last Fed meeting. And, you know, are you concerned to see, you know, nearly a trillion dollars a day, you know, pouring in through that facility? 

CHAIR POWELL. So, on the standing repo facility, what is it going to do? So it really is a backstop. So it’s set at 25 basis points so out of the money, and it’s there to help address pressures in money market — money markets that could impede the effective implementation of monetary policy. So, really, it’s to support the function of — functioning of monetary policy and its effectiveness. That’s the purpose of it. And it’s set up with that purpose in mind. Your question on the RRP, so we think it’s doing what it’s supposed to do, what we expect of it to do, which is to help provide a floor for money market rates and help ensure that the federal funds rate stays within the target range. You know, it’s essentially — essentially, what’s happening is that it just results in a lower aggregate amount of Federal Reserve liabilities that are in banks in the form of reserves and a higher amount of Federal Reserve liabilities in money market funds in the form of overnight RRP balances. So that — that’s all that’s really happening there. And we expect it to be high for some time. It’s being driven, of course, by the relatively lower quantity of Treasury bills and also the onset of the debt ceiling and the decline in the TGA, things like that. So we don’t have a problem with what it’s doing. It’s kind of doing the job we expected.

MICHAEL DERBY. And you don’t see any issues with, like, disaggregating, you know, markets from, you know, investing in private money market securities? You know, like the idea that the Fed’s footprint in money markets is getting too big, you don’t see any issues there?

CHAIR POWELL. Not really. Not at this point. I mean, money markets, private money market funds are choosing to invest because the rates are attractive. At some point, the rates will not be so attractive as the whole rate cluster normalizes, and you’ll see it shrink back down. 

MICHAEL DERBY. Okay. Thank you. 

_____

_____

The Special Note summarizes my overall thoughts about our economic situation

SPX at 4425.37 as this post is written 
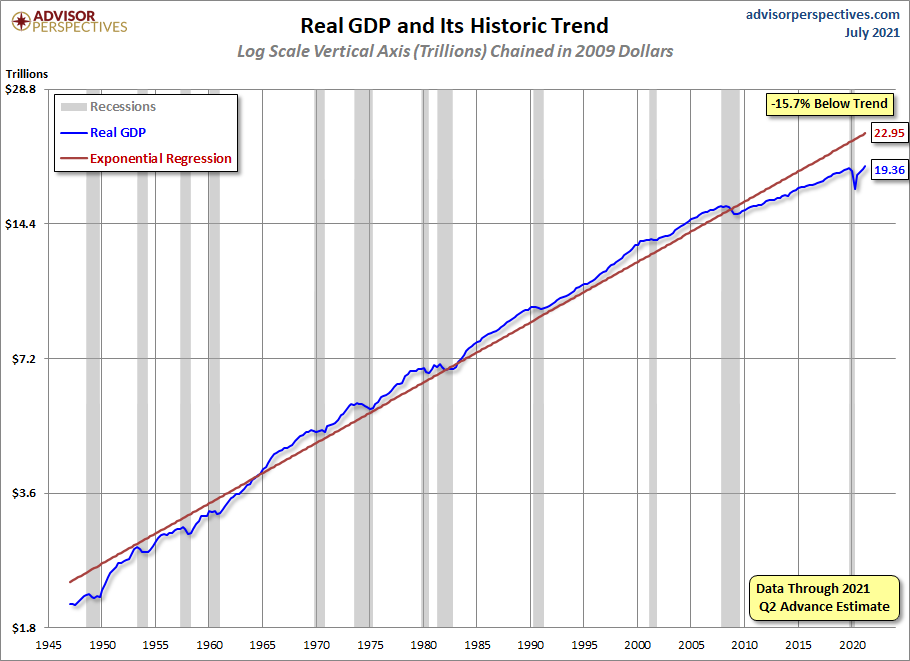
Real GDP Chart Since 1947 With Trendline – 2nd Quarter 2021

For reference purposes, below is a chart from the Advisor Perspectives’ post of July 29, 2021 titled “Q2 GDP Advance Estimate: Real GDP Inches Up To 6.5%…,” reflecting Real GDP, with a trendline, as depicted.  This chart incorporates the Gross Domestic Product, Second Quarter 2021 (Advance Estimate) of July 29, 2021:

U.S. Real GDP since 1947

_________

I post various indicators and indices because I believe they should be carefully monitored.  However, as those familiar with this site are aware, I do not necessarily agree with what they depict or imply.

_____

The Special Note summarizes my overall thoughts about our economic situation

SPX at 4418.36 as this post is written
Tuesday, July 27, 2021

Money Supply Charts Through June 2021

For reference purposes, below are two sets of charts depicting growth in the money supply.

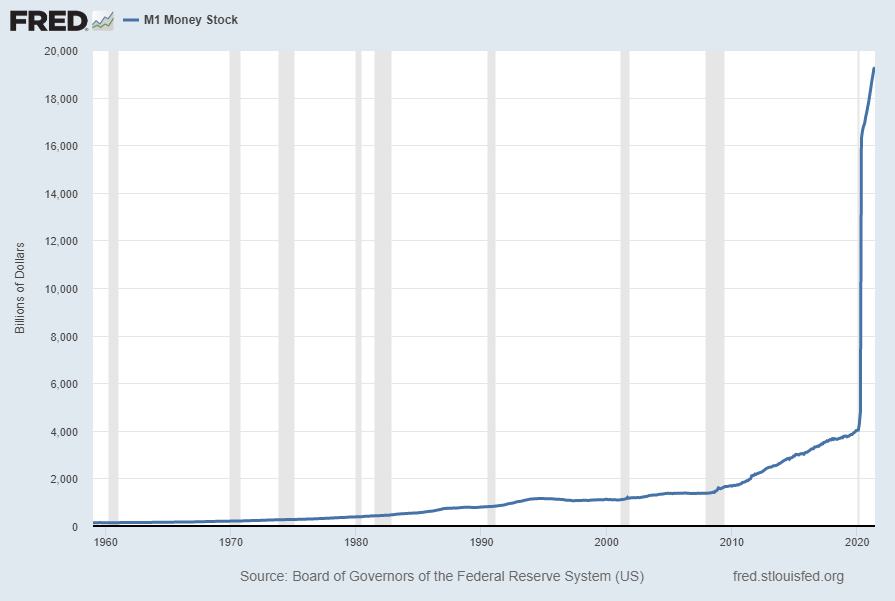
The first shows the M1, defined in FRED as the following:

Before May 2020, M1 consists of (1) currency outside the U.S. Treasury, Federal Reserve Banks, and the vaults of depository institutions; (2) demand deposits at commercial banks (excluding those amounts held by depository institutions, the U.S. government, and foreign banks and official institutions) less cash items in the process of collection and Federal Reserve float; and (3) other checkable deposits (OCDs), consisting of negotiable order of withdrawal, or NOW, and automatic transfer service, or ATS, accounts at depository institutions, share draft accounts at credit unions, and demand deposits at thrift institutions.

Beginning May 2020, M1 consists of (1) currency outside the U.S. Treasury, Federal Reserve Banks, and the vaults of depository institutions; (2) demand deposits at commercial banks (excluding those amounts held by depository institutions, the U.S. government, and foreign banks and official institutions) less cash items in the process of collection and Federal Reserve float; and (3) other liquid deposits, consisting of OCDs and savings deposits (including money market deposit accounts). Seasonally adjusted M1 is constructed by summing currency, demand deposits, and OCDs (before May 2020) or other liquid deposits (beginning May 2020), each seasonally adjusted separately.

Here is the “M1 Money Stock” (seasonally adjusted) chart, updated on July 27, 2021 depicting data through June 2021, with a value of $19,268.1 Billion:

M1 Money Stock

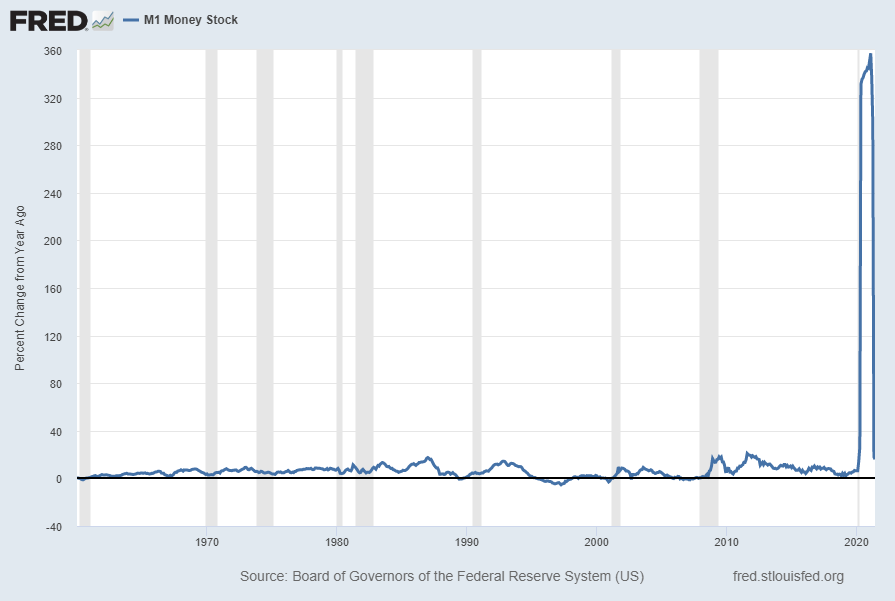
Here is the “M1 Money Stock” chart on a “Percent Change From Year Ago” basis, with a current value of 16.1%:

M1 Money Stock Percent Change From Year Ago

Data Source: Board of Governors of the Federal Reserve System (US), M1 Money Stock [M1SL], retrieved from FRED, Federal Reserve Bank of St. Louis; accessed July 27, 2021: https://fred.stlouisfed.org/series/M1SL

The second set shows M2, defined in FRED as the following:

Before May 2020, M2 consists of M1 plus (1) savings deposits (including money market deposit accounts); (2) small-denomination time deposits (time deposits in amounts of less than $100,000) less individual retirement account (IRA) and Keogh balances at depository institutions; and (3) balances in retail money market funds (MMFs) less IRA and Keogh balances at MMFs.

Beginning May 2020, M2 consists of M1 plus (1) small-denomination time deposits (time deposits in amounts of less than $100,000) less IRA and Keogh balances at depository institutions; and (2) balances in retail MMFs less IRA and Keogh balances at MMFs. Seasonally adjusted M2 is constructed by summing savings deposits (before May 2020), small-denomination time deposits, and retail MMFs, each seasonally adjusted separately, and adding this result to seasonally adjusted M1.

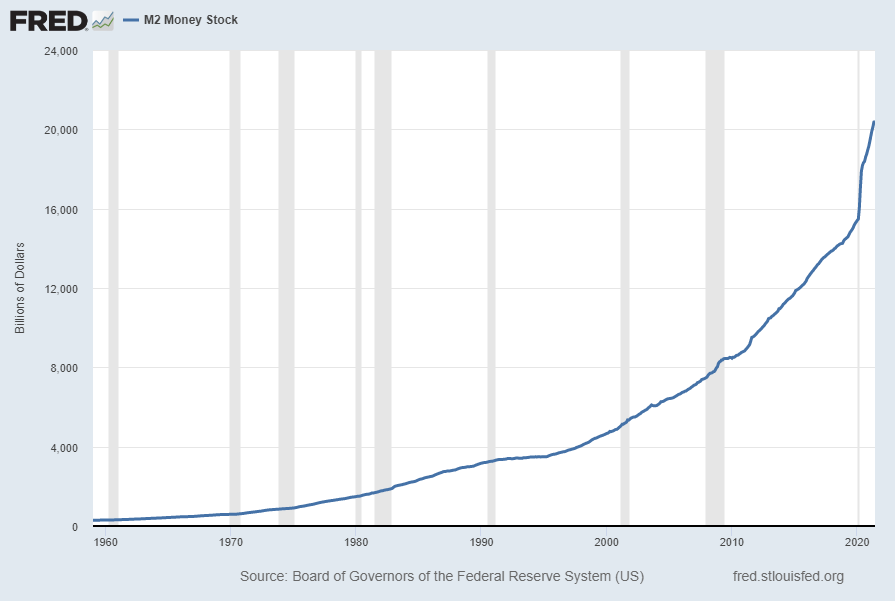
Here is the “M2 Money Stock” (seasonally adjusted) chart, updated on July 27, 2021, depicting data through June 2021, with a value of $20,388.9 Billion:

M2 Money Stock

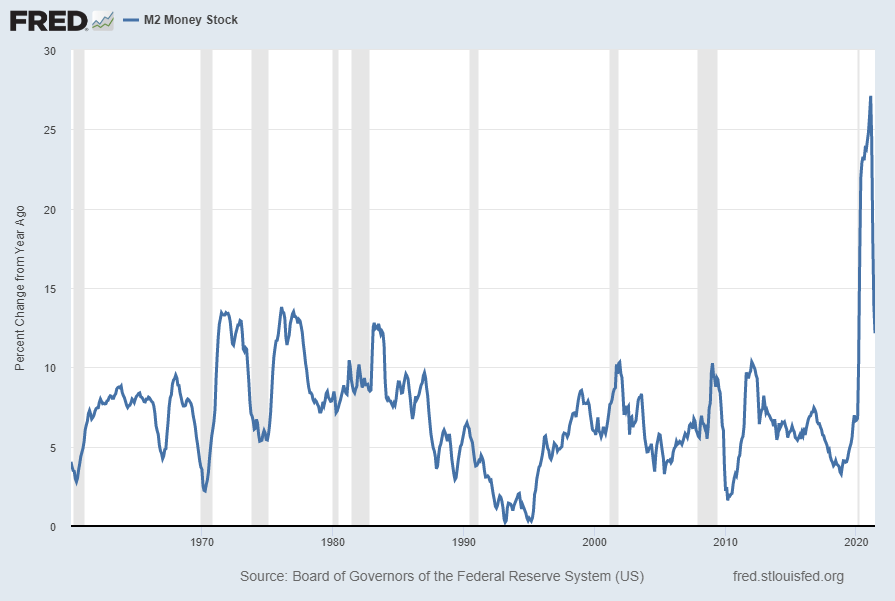
Here is the “M2 Money Stock” chart on a “Percent Change From Year Ago” basis, with a current value of 12.2%:

M2 Money Stock Percent Change From Year Ago

Data Source: Board of Governors of the Federal Reserve System (US), M2 Money Stock [M2SL], retrieved from FRED, Federal Reserve Bank of St. Louis; accessed July 27, 2021: https://fred.stlouisfed.org/series/M2SL

_____

The Special Note summarizes my overall thoughts about our economic situation

SPX at 4401.46 as this post is written
Durable Goods New Orders – Long-Term Charts Through June 2021

Many people place emphasis on Durable Goods New Orders as a prominent economic indicator and/or leading economic indicator.

For reference, below are two charts depicting this measure.

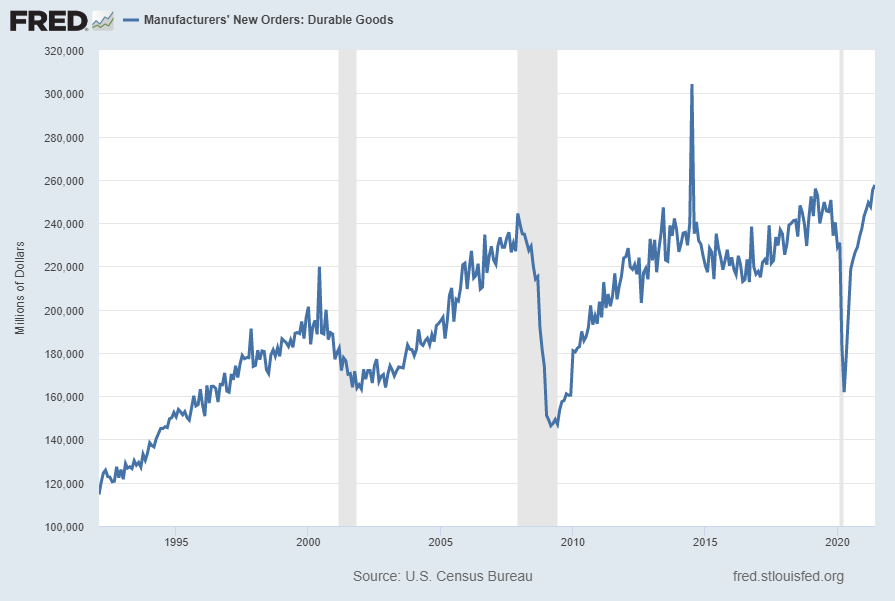
First, from the St. Louis Fed site (FRED), a chart through June 2021, updated on July 27, 2021. This value is $257,627 ($ Millions):

(click on charts to enlarge images)

Durable Goods New Orders

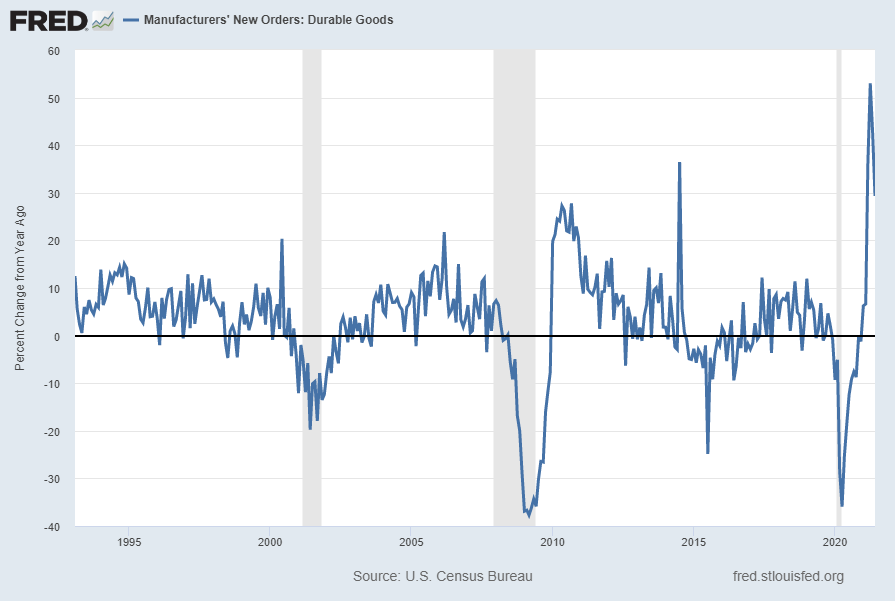
Second, here is the chart depicting this measure on a “Percentage Change from a Year Ago” basis, with a last value of 29.3%:

Durable Goods New Orders Percent Change From Year Ago

Data Source: FRED, Federal Reserve Economic Data, Federal Reserve Bank of St. Louis: Manufacturers’ New Orders:  Durable Goods [DGORDER]; U.S. Department of Commerce: Census Bureau; accessed July 27, 2021; 
http://research.stlouisfed.org/fred2/series/DGORDER

_________

I post various indicators and indices because I believe they should be carefully monitored.  However, as those familiar with this site are aware, I do not necessarily agree with what they depict or imply.

_____

The Special Note summarizes my overall thoughts about our economic situation

SPX at 4405.55 as this post is written