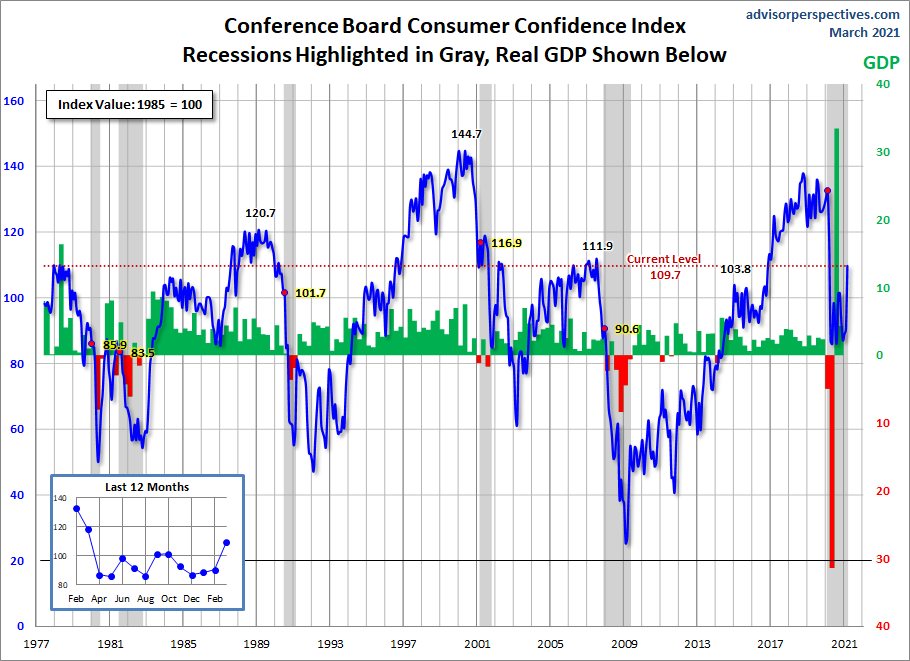
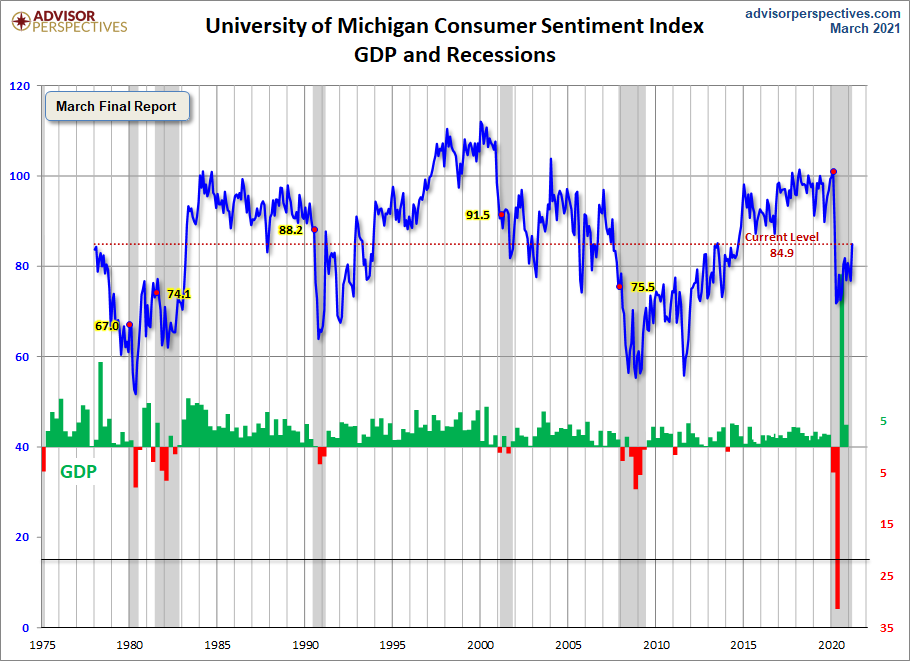
Advisor Perspectives had a post of March 30, 2021 (“Consumer Confidence Highest In A Year“) that displays the latest Conference Board Consumer Confidence and Thomson/Reuters University of Michigan Consumer Sentiment Index charts. They are presented below:
(click on charts to enlarge images)
–
While I don’t believe that confidence surveys should be overemphasized, I find these readings and trends to be notable, especially in light of a variety of other highly disconcerting measures highlighted throughout this site.
_____
The Special Note summarizes my overall thoughts about our economic situation
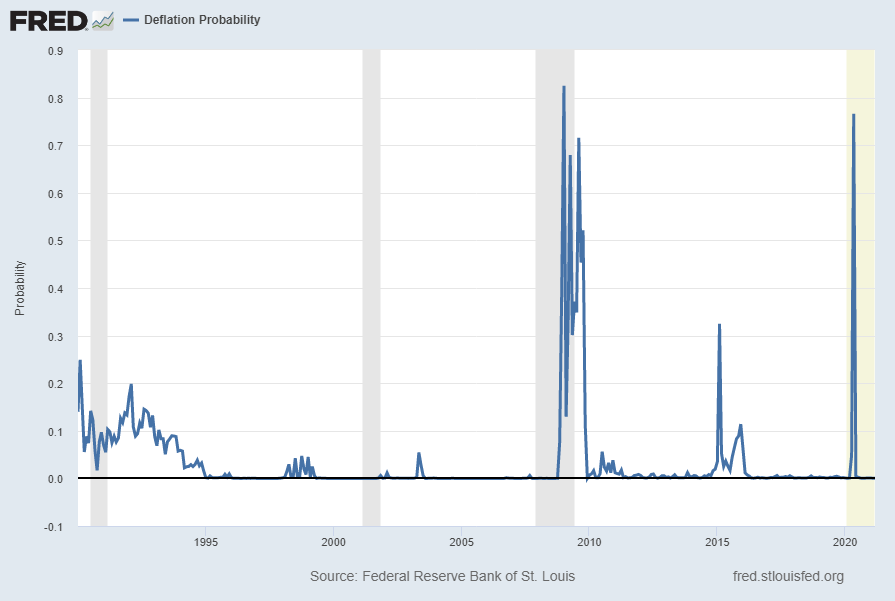
For reference, below is a chart of the St. Louis Fed Price Pressures Measures – Deflation Probability [FRED STLPPMDEF] through March 2021.
While I do not necessarily agree with the current readings of the measure, I view this as a proxy of U.S. deflation probability.
A description of this measure, as seen in FRED:
This series measures the probability that the personal consumption expenditures price index (PCEPI) inflation rate (12-month changes) over the next 12 months will fall below zero.
The chart, on a monthly basis from January 1990 – March 2021, with a last reading of .00043, last updated on March 26, 2021:
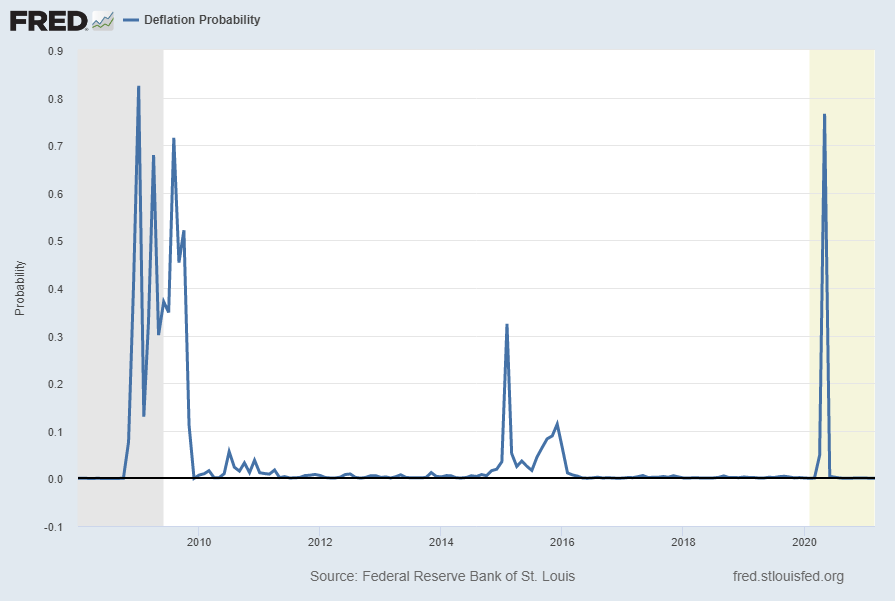
Here is this same deflation probability measure since 2008:
source: Federal Reserve Bank of St. Louis, Deflation Probability [STLPPMDEF], retrieved from FRED, Federal Reserve Bank of St. Louis; accessed March 26, 2021: https://fred.stlouisfed.org/series/STLPPMDEF
_________
I post various economic indicators and indices because I believe they should be carefully monitored. However, as those familiar with this site are aware, I do not necessarily agree with what they depict or imply.
_____
The Special Note summarizes my overall thoughts about our economic situation
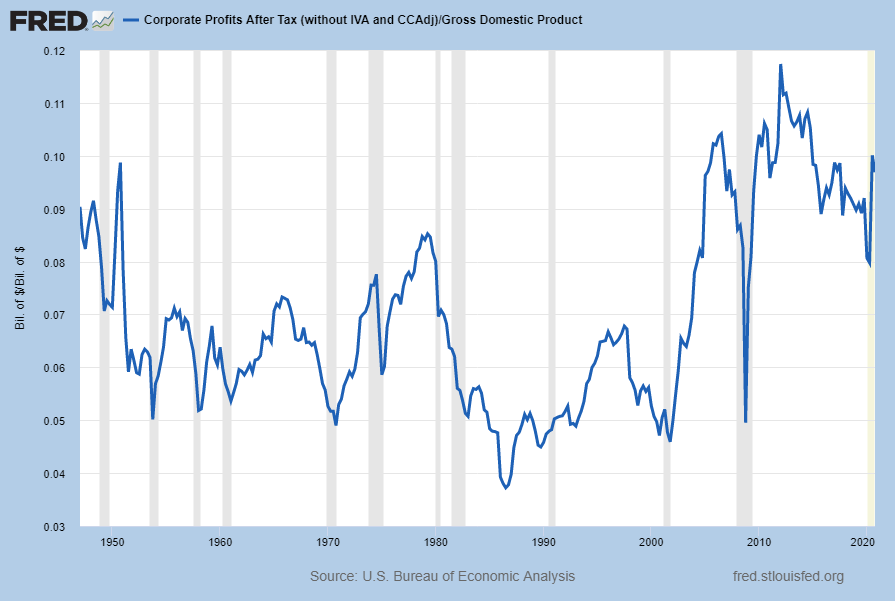
In the last post (“4th Quarter 2020 Corporate Profits“) I displayed, for reference purposes, a long-term chart depicting Corporate Profits After Tax.
There are many ways to view this measure, both on an absolute as well as relative basis.
One relative measure is viewing Corporate Profits as a Percentage of GDP. I feel that this metric is important for a variety of reasons. As well, the measure is important to a variety of parties, including investors, businesses, and government policy makers.
As one can see from the long-term chart below (updated through the fourth quarter), (After Tax) Corporate Profits as a Percentage of GDP is still at levels that can be seen as historically high. While there are many reasons as to why this is so, from a going-forward standpoint I think it is important to recognize both that such a notable condition exists, as well as contemplate and/or plan for such factors and conditions that would come about if (and in my opinion “when”) a more historically “normal” ratio of Corporate Profits as a Percentage of GDP occurs. This topic can be very complex in nature, and depends upon myriad factors. In my opinion it deserves far greater recognition.
(click on chart to enlarge image)
Data Source: FRED, Federal Reserve Economic Data, Federal Reserve Bank of St. Louis; accessed March 25, 2021
_____
The Special Note summarizes my overall thoughts about our economic situation
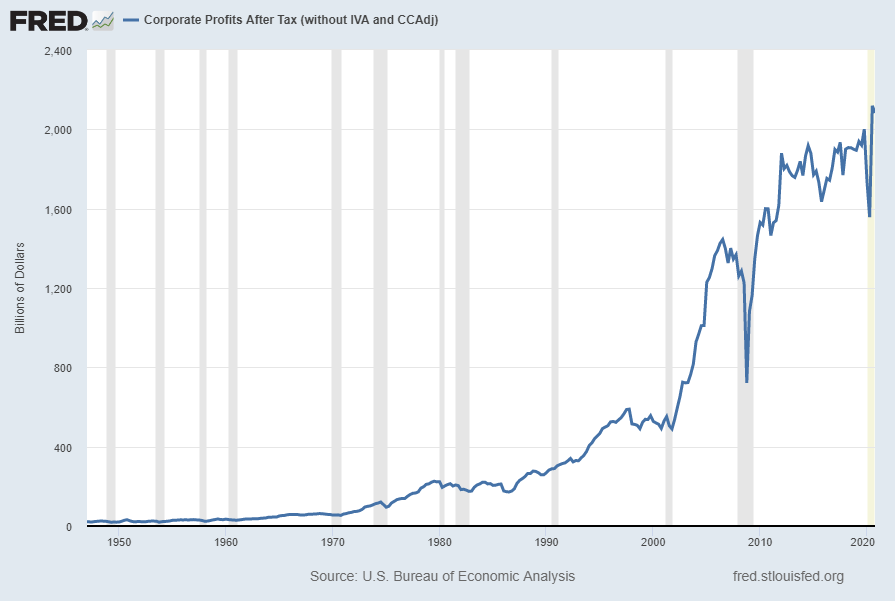
Today’s (March 25, 2021) GDP release (Q4 2020, Third Estimate) was accompanied by the Bureau of Economic Analysis (BEA) Corporate Profits report (preliminary estimate) for the 4th Quarter.
Of course, there are many ways to adjust and depict overall Corporate Profits. For reference purposes, here is a chart from the St. Louis Federal Reserve (FRED) showing the Corporate Profits After Tax (without IVA and CCAdj) (last updated March 25, 2021, with a value of $2082.47 Billion SAAR):
–
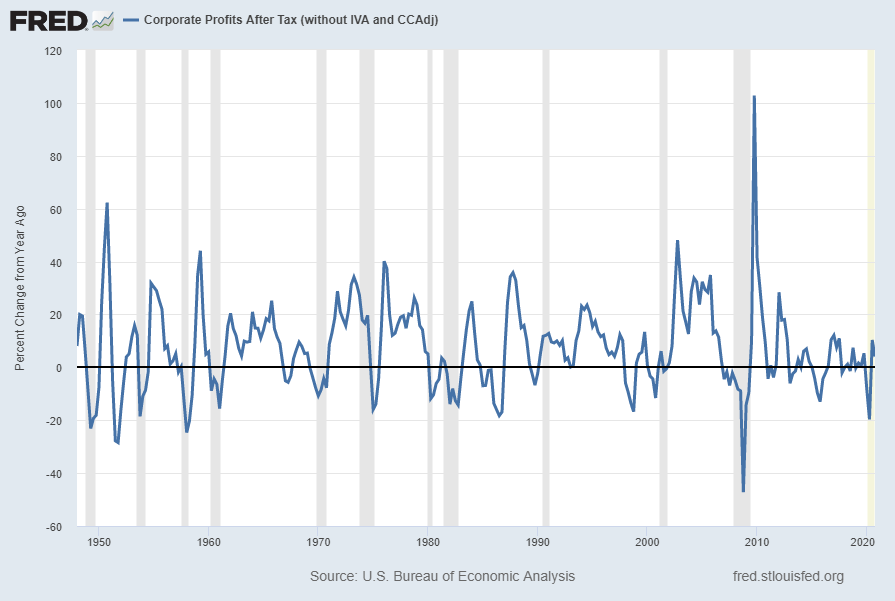
Here is the Corporate Profits After Tax measure shown on a Percentage Change from a Year Ago perspective (value of 4.1%):
Data Source: FRED, Federal Reserve Economic Data, Federal Reserve Bank of St. Louis: Corporate Profits After Tax [CP]; U.S. Department of Commerce: Bureau of Economic Analysis; accessed March 25, 2021; https://research.stlouisfed.org/fred2/series/CP
_________
I post various indicators and indices because I believe they should be carefully monitored. However, as those familiar with this site are aware, I do not necessarily agree with what they depict or imply.
_____
The Special Note summarizes my overall thoughts about our economic situation
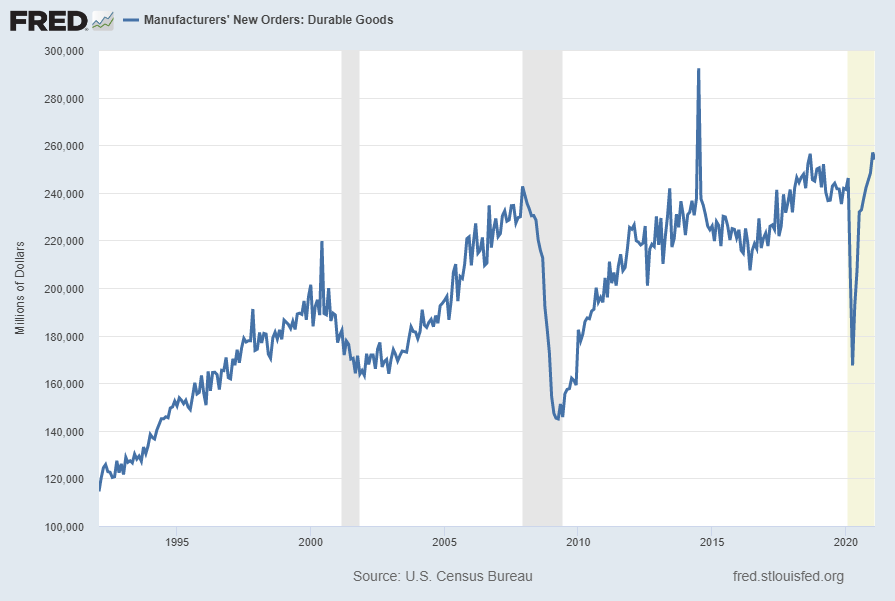
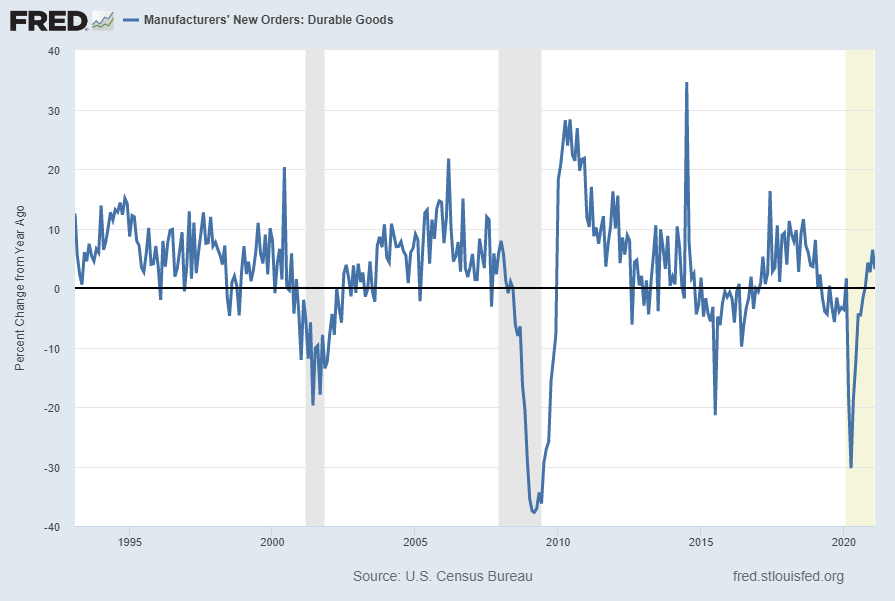
Many people place emphasis on Durable Goods New Orders as a prominent economic indicator and/or leading economic indicator.
For reference, below are two charts depicting this measure.
First, from the St. Louis Fed site (FRED), a chart through February 2021, updated on March 24, 2021. This value is $254,004 ($ Millions):
(click on charts to enlarge images)
–
Second, here is the chart depicting this measure on a “Percentage Change from a Year Ago” basis, with a last value of 3.2%:
Data Source: FRED, Federal Reserve Economic Data, Federal Reserve Bank of St. Louis: Manufacturers’ New Orders: Durable Goods [DGORDER]; U.S. Department of Commerce: Census Bureau; accessed March 24, 2021; http://research.stlouisfed.org/fred2/series/DGORDER
_________
I post various indicators and indices because I believe they should be carefully monitored. However, as those familiar with this site are aware, I do not necessarily agree with what they depict or imply.
_____
The Special Note summarizes my overall thoughts about our economic situation
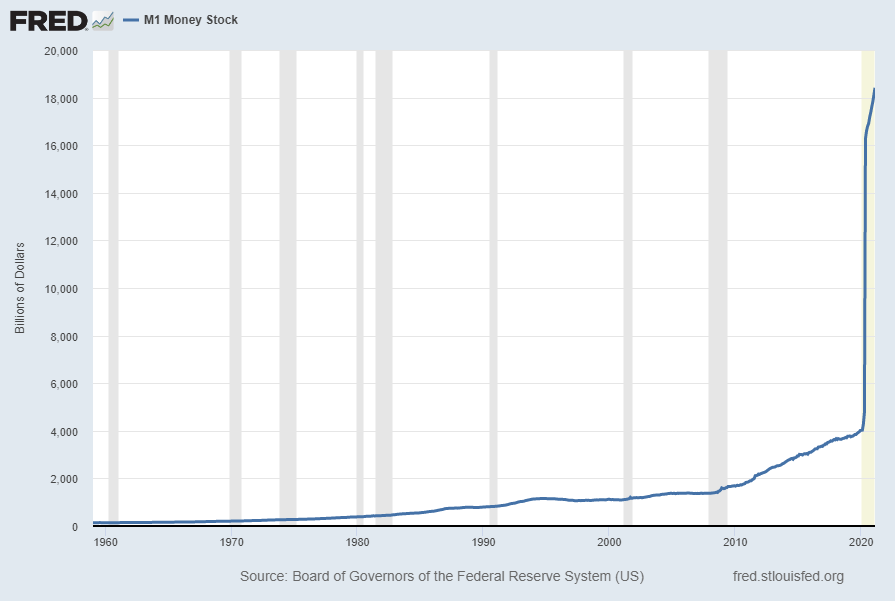
For reference purposes, below are two sets of charts depicting growth in the money supply.
The first shows the M1, defined in FRED as the following:
Beginning May 2020, M1 consists of (1) currency outside the U.S. Treasury, Federal Reserve Banks, and the vaults of depository institutions; (2) demand deposits at commercial banks (excluding those amounts held by depository institutions, the U.S. government, and foreign banks and official institutions) less cash items in the process of collection and Federal Reserve float; and (3) other liquid deposits, consisting of OCDs and savings deposits (including money market deposit accounts). Seasonally adjusted M1 is constructed by summing currency, demand deposits, and OCDs (before May 2020) or other liquid deposits (beginning May 2020), each seasonally adjusted separately.
Here is the “M1 Money Stock” (seasonally adjusted) chart, updated on March 23, 2021 depicting data through February 2021, with a value of $18,412.00 Billion:
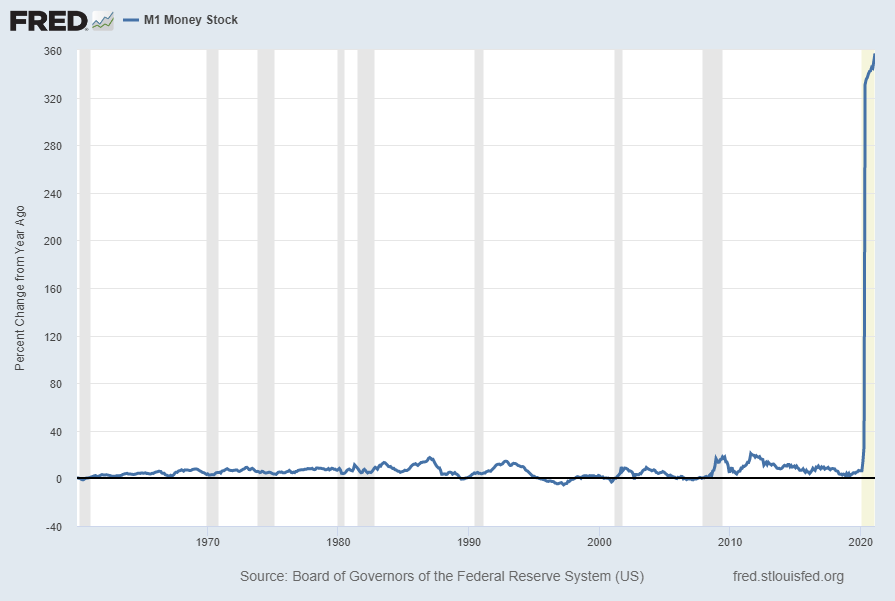
Here is the “M1 Money Stock” chart on a “Percent Change From Year Ago” basis, with a current value of 357.1%:
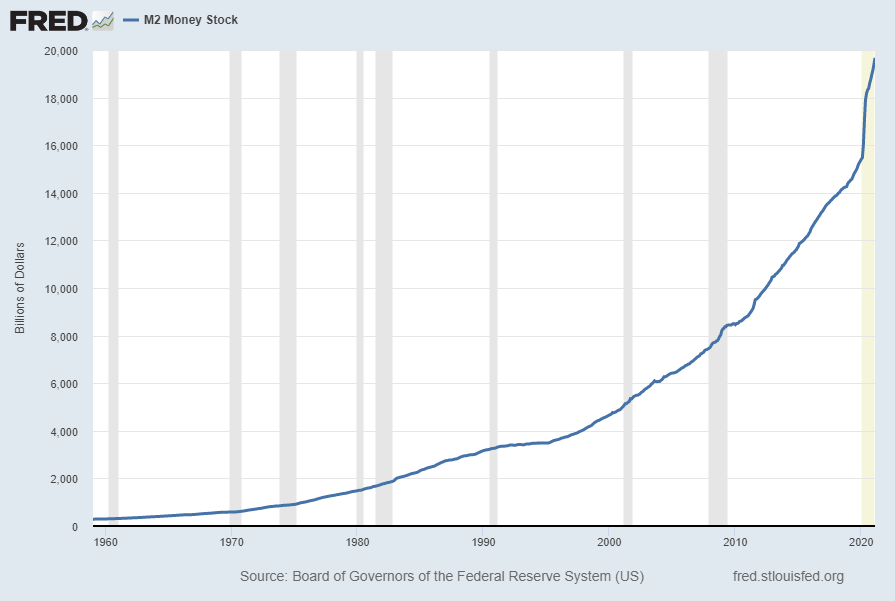
The second set shows M2, defined in FRED as the following:
M2 includes a broader set of financial assets held principally by households. M2 consists of M1 plus: (1) savings deposits (which include money market deposit accounts, or MMDAs); (2) small-denomination time deposits (time deposits in amounts of less than $100,000); and (3) balances in retail money market mutual funds (MMMFs). Seasonally adjusted M2 is computed by summing savings deposits, small-denomination time deposits, and retail MMMFs, each seasonally adjusted separately, and adding this result to seasonally adjusted M1.
Here is the “M2 Money Stock” (seasonally adjusted) chart, updated on March 23, 2021, depicting data through February 2021, with a value of $19,669.8 Billion:
Here is the “M2 Money Stock” chart on a “Percent Change From Year Ago” basis, with a current value of 27.1%:
Perhaps the main reason that I write of our economic situation is that I continue to believe, based upon various analyses, that our economic situation is in many ways misunderstood. While no one likes to contemplate a future rife with economic adversity, current and future economic problems must be properly recognized and rectified if high-quality, sustainable long-term economic vitality is to be realized.
There are an array of indications and other “warning signs” – many readily apparent – that current economic activity and financial market performance is accompanied by exceedingly perilous dynamics.
I have written extensively about this peril, including in the following:
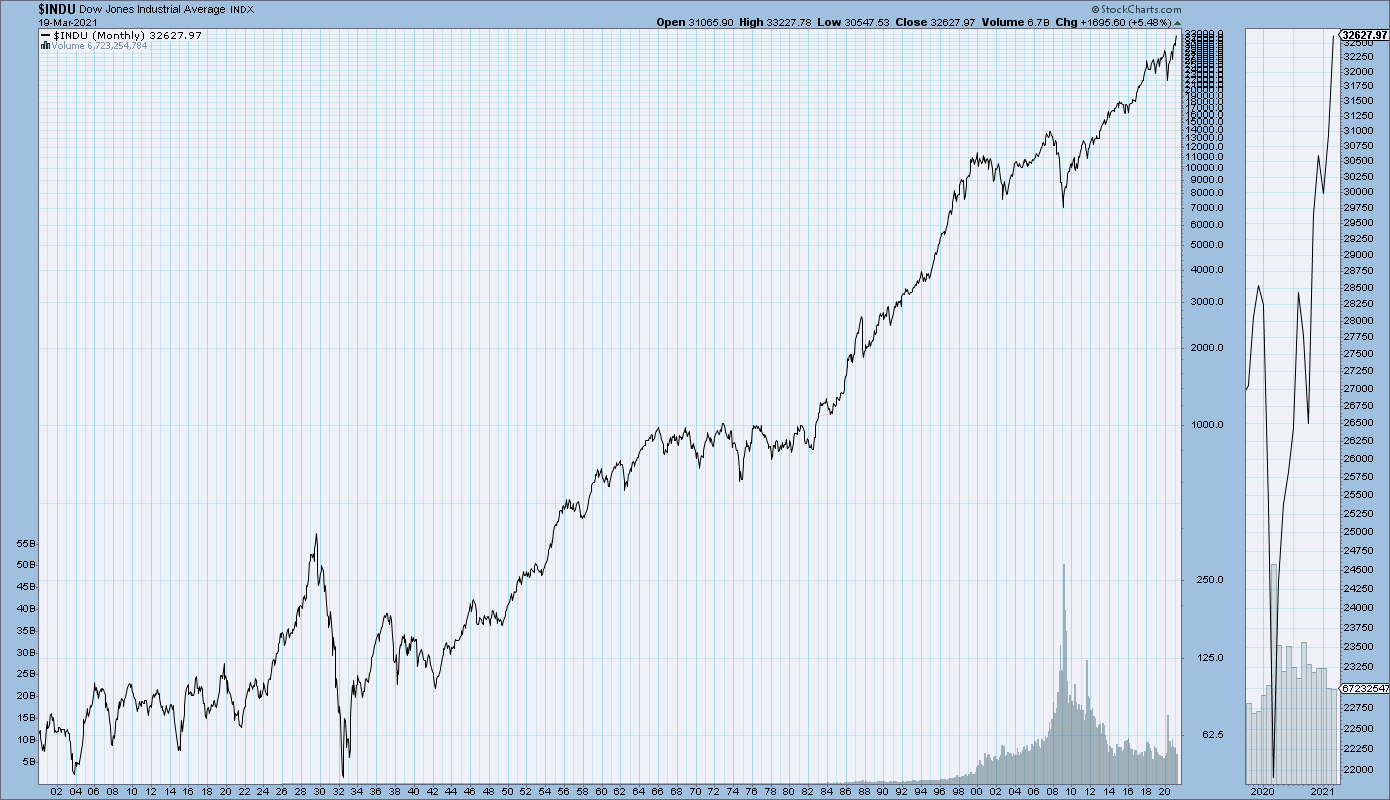
My analyses continues to indicate that the growing level of financial danger will lead to the next stock market crash that will also involve (as seen in 2008) various other markets as well. Key attributes of this next crash is its outsized magnitude (when viewed from an ultra-long term historical perspective) and the resulting economic impact. This next financial crash is of tremendous concern, as my analyses indicate it will lead to a Super Depression – i.e. an economy characterized by deeply embedded, highly complex, and difficult-to-solve problems.
For long-term reference purposes, here is a chart of the Dow Jones Industrial Average since 1900, depicted on a monthly basis using a LOG scale (updated through March 19, 2021, with a last value of 32627.97):
(click on chart to enlarge image)(chart courtesy of StockCharts.com)
_____
The Special Note summarizes my overall thoughts about our economic situation
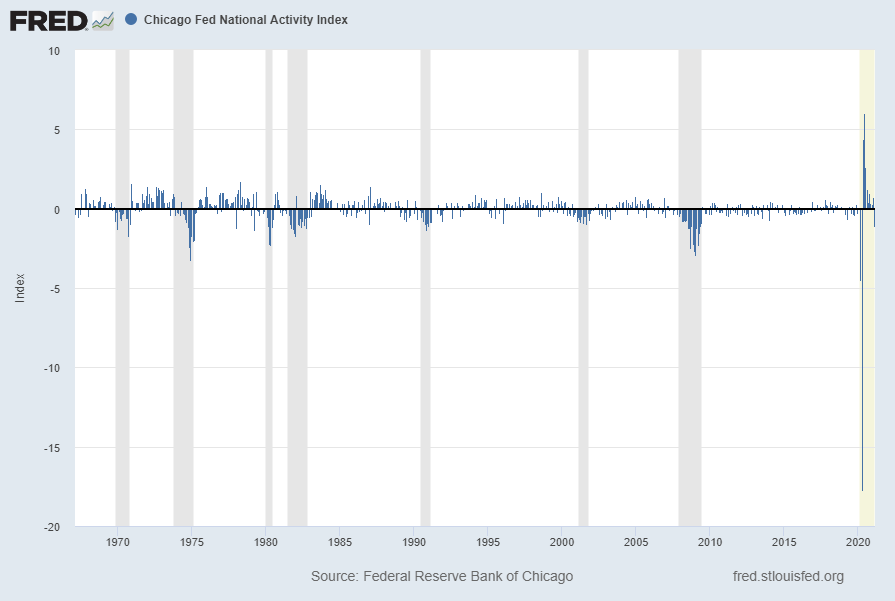
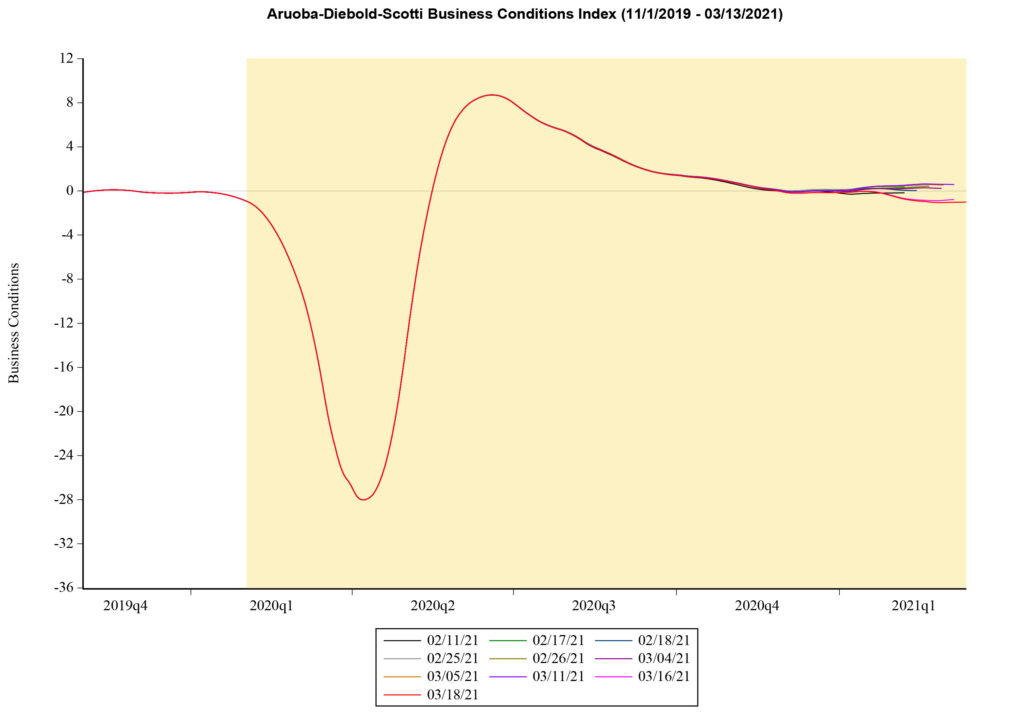
The following is an update of various indicators that are supposed to predict and/or depict economic activity. These indicators have been discussed in previous blog posts:
source: Federal Reserve Bank of Chicago, Chicago Fed National Activity Index [CFNAI], retrieved from FRED, Federal Reserve Bank of St. Louis, March 22, 2021; https://fred.stlouisfed.org/series/CFNAI
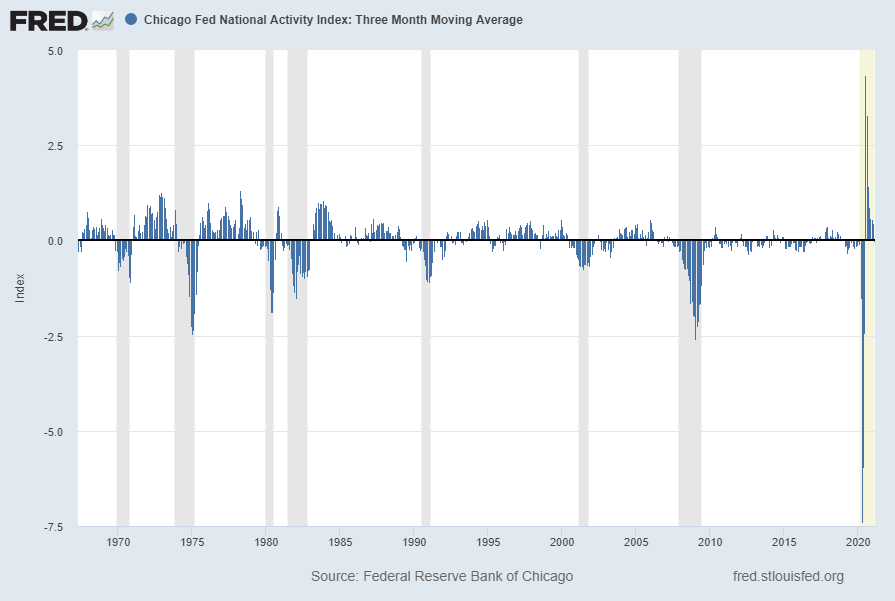
The CFNAI-MA3, with a current reading of -.02:
source: Federal Reserve Bank of Chicago, Chicago Fed National Activity Index: Three Month Moving Average [CFNAIMA3], retrieved from FRED, Federal Reserve Bank of St. Louis, March 22, 2021; https://fred.stlouisfed.org/series/CFNAIMA3
The Conference Board Leading Economic Index (LEI), Coincident Economic Index (CEI), and Lagging Economic Index (LAG):
As per the March 18, 2021 Conference Board press release, titled “The Conference Board Leading Economic Index (LEI) for the U.S. Increased in February” the LEI was at 110.5, the CEI was at 103.0, and the LAG was 104.5 in February.
An excerpt from the release:
“The U.S. LEI continued rising in February, suggesting economic growth should continue well into this year,” said Ataman Ozyildirim, Senior Director of Economic Research at The Conference Board. “Indeed, the acceleration of the vaccination campaign and a new round of large fiscal supports are not yet fully reflected in the LEI. With those developments, The Conference Board now expects the pace of growth to improve even further this year, with the U.S. economy expanding by 5.5 percent in 2021.”
“Despite widespread improvements among the leading indicators, some measures—including weekly hours in manufacturing, permits for residential housing, and consumers’ outlook for business and economic conditions—showed signs of weakness. Bad weather and assorted supply-chain disruptions may have impacted these particular leading indicators in February, and the effects may prove transitory.”
_________
I post various indicators and indices because I believe they should be carefully monitored. However, as those familiar with this site are aware, I do not necessarily agree with what they depict or imply.
_____
The Special Note summarizes my overall thoughts about our economic situation
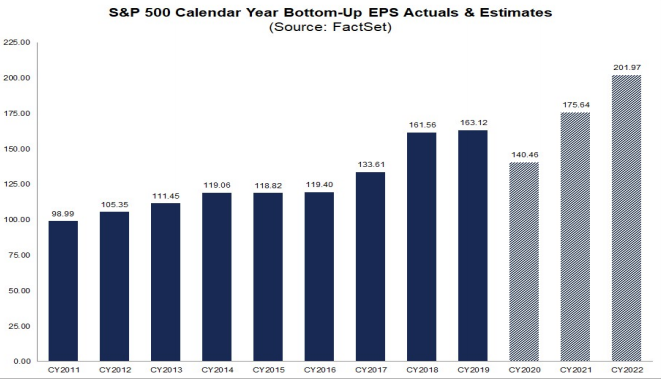
FactSet publishes a report titled “Earnings Insight” that contains a variety of information including the trends and expectations of S&P500 earnings.
For reference purposes, here are two charts as seen in the “Earnings Insight” report of March 19, 2021:
from page 25:
(click on charts to enlarge images)
from page 26:
_____
I post various economic forecasts because I believe they should be carefully monitored. However, as those familiar with this site are aware, I do not agree with many of the consensus estimates and much of the commentary in these forecast surveys.
_____
The Special Note summarizes my overall thoughts about our economic situation
As many are aware, Refinitiv publishes earnings estimates for the S&P500. (My other posts concerning S&P earnings estimates can be found under the S&P500 Earnings label)
The following estimates are from Exhibit 24 of the “S&P500 Earnings Scorecard” (pdf) of March 12, 2021, and represent an aggregation of individual S&P500 component “bottom up” analyst forecasts. For reference, the Year 2014 value is $118.78/share; the Year 2015 value is $117.46/share; the Year 2016 value is $118.10/share; the Year 2017 value is $132.00/share; the Year 2018 value is $161.93/share; and the Year 2019 value is $162.93/share:
Year 2020 estimate:
$140.94/share
Year 2021 estimate:
$175.02/share
Year 2022 estimate:
$201.64/share
_____
I post various economic forecasts because I believe they should be carefully monitored. However, as those familiar with this site are aware, I do not agree with many of the consensus estimates and much of the commentary in these forecast surveys.
_____
The Special Note summarizes my overall thoughts about our economic situation
As many are aware, Standard & Poor’s publishes earnings estimates for the S&P500. (My posts concerning their estimates can be found under the S&P500 Earnings label)
For reference purposes, the most current estimates are reflected below, and are as of March 11, 2021:
Year 2021 estimates add to the following:
-From a “bottom up” perspective, operating earnings of $172.00/share
-From a “top down” perspective, operating earnings of N/A
-From a “bottom up” perspective, “as reported” earnings of $157.12/share
Year 2022 estimates add to the following:
-From a “bottom up” perspective, operating earnings of $199.50/share
-From a “top down” perspective, operating earnings of N/A
-From a “bottom up” perspective, “as reported” earnings of $182.51/share
_____
I post various economic forecasts because I believe they should be carefully monitored. However, as those familiar with this site are aware, I do not agree with many of the consensus estimates and much of the commentary in these forecast surveys.
_____
The Special Note summarizes my overall thoughts about our economic situation