Friday, September 29, 2023

Consumer Confidence Surveys – As Of September 29, 2023

Advisor Perspectives had a post of September 29, 2023 (“Michigan Consumer Sentiment Falls for Second Straight Month“) that displays the latest Conference Board Consumer Confidence and University of Michigan Consumer Sentiment Index charts.  They are presented below:

(click on charts to enlarge images)

Conference Board Consumer Confidence

University of Michigan Consumer Sentiment Index

While I don’t believe that confidence surveys should be overemphasized, I find these readings and trends to be notable, especially in light of a variety of other highly disconcerting measures highlighted throughout this site.

_____

The Special Note summarizes my overall thoughts about our economic situation

SPX at 4279.04 as this post is written

Thursday, September 28, 2023

Chicago Fed National Financial Conditions Index (NFCI)

The St. Louis Fed’s Financial Stress Index (STLFSI4) is one index that is supposed to measure stress in the financial system. Its reading as of the September 28, 2023 update (reflecting data through September 22, 2023) is -.7316:

STLFSI4

source: Federal Reserve Bank of St. Louis, St. Louis Fed Financial Stress Index [STLFSI4], retrieved from FRED, Federal Reserve Bank of St. Louis; accessed September 28, 2023: https://fred.stlouisfed.org/series/STLFSI4

Of course, there are a variety of other measures and indices that are supposed to measure financial stress and other related issues, both from the Federal Reserve as well as from private sources.

Two other indices that I regularly monitor include the Chicago Fed National Financial Conditions Index (NFCI) as well as the Chicago Fed Adjusted National Financial Conditions Index (ANFCI).

Here are summary descriptions of each, as seen in FRED:

The National Financial Conditions Index (NFCI) measures risk, liquidity and leverage in money markets and debt and equity markets as well as in the traditional and “shadow” banking systems. Positive values of the NFCI indicate financial conditions that are tighter than average, while negative values indicate financial conditions that are looser than average.

The adjusted NFCI (ANFCI). This index isolates a component of financial conditions uncorrelated with economic conditions to provide an update on how financial conditions compare with current economic conditions.

For further information, please visit the Federal Reserve Bank of Chicago’s web site:

http://www.chicagofed.org/webpages/publications/nfci/index.cfm

Below are the most recently updated charts of the NFCI and ANFCI, respectively.

The NFCI chart below was last updated on September 27, 2023 incorporating data from January 8, 1971 through September 22, 2023 on a weekly basis.  The September 22 value is -.45798:

NFCI

Data Source: FRED, Federal Reserve Economic Data, Federal Reserve Bank of St. Louis; accessed September 28, 2023:  
http://research.stlouisfed.org/fred2/series/NFCI

The ANFCI chart below was last updated on September 27, 2023 incorporating data from January 8, 1971 through September 22, 2023, on a weekly basis.  The September 22, 2023 value is -.37971:

ANFCI

Data Source: FRED, Federal Reserve Economic Data, Federal Reserve Bank of St. Louis; accessed September 28, 2023:  
http://research.stlouisfed.org/fred2/series/ANFCI

_________

I post various indicators and indices because I believe they should be carefully monitored.  However, as those familiar with this site are aware, I do not necessarily agree with what they depict or imply.

_____

The Special Note summarizes my overall thoughts about our economic situation

SPX at 4302.24 as this post is written

Wednesday, September 27, 2023

Durable Goods New Orders – Long-Term Charts Through August 2023

Many people place emphasis on Durable Goods New Orders as a prominent economic indicator and/or leading economic indicator.

For reference, below are two charts depicting this measure.

First, from the St. Louis Fed site (FRED), a chart through August 2023, updated on September 27, 2023. This value is $284,749 ($ Millions):

(click on charts to enlarge images)

Durable Goods New Orders 284,749

Second, here is the chart depicting this measure on a “Percent Change from a Year Ago” basis, with a last value of 3.5%:

DGORDER 3.5 Percent Change From Year Ago

Data Source: FRED, Federal Reserve Economic Data, Federal Reserve Bank of St. Louis: Manufacturers’ New Orders:  Durable Goods [DGORDER]; U.S. Department of Commerce: Census Bureau; accessed September 27, 2023; 
http://research.stlouisfed.org/fred2/series/DGORDER

_________

I post various indicators and indices because I believe they should be carefully monitored.  However, as those familiar with this site are aware, I do not necessarily agree with what they depict or imply.

_____

The Special Note summarizes my overall thoughts about our economic situation

SPX at 4274.51 as this post is written

The CFO Survey Third Quarter 2023 – Notable Excerpts

On September 27, 2023 The CFO Survey was released.  It contains a variety of statistics regarding how CFOs view business and economic conditions.

In the CFO Survey press release, I found the following to be the most notable excerpts – although I don’t necessarily agree with them:

Several economic indicators reflect a brighter outlook for 2024.

  • Respondents expect employment growth to increase to nearly 4 percent in 2024, up from about 1 percent this year.
  • Price and unit cost growth are both expected to temper in 2024, including the wage bill.
  • Revenues are expected to rebound from an average of 3 percent growth in 2023 to more than 6 percent in 2024.
  • CFOs assign a 19-percent chance of negative GDP growth over the next 12 months, down from 24 percent in last quarter’s survey.
  • The CFO Optimism Index improved slightly this quarter, compared with last quarter.

As seen in the survey, growth expectations for Real GDP over the next four quarters averaged 1.3%, up from 1.0% seen in the last survey.

The CFO Survey contains an Optimism Index chart, with the blue line showing U.S. Optimism (with regard to the economy) at 56.2, as seen below:

The CFO Survey: Optimism Indexes

It should be interesting to see how well the CFOs predict business and economic conditions going forward.   I discussed past various aspects of this, and the importance of these predictions, in the July 9, 2010 post titled “The Business Environment”.

(past posts on CEO and CFO surveys can be found under the “CFO and CEO Confidence” label)

_____

I post various economic forecasts because I believe they should be carefully monitored.  However, as those familiar with this site are aware, I do not necessarily agree with many of the consensus estimates and much of the commentary in these forecast surveys.

_____

The Special Note summarizes my overall thoughts about our economic situation

SPX at 4280.84 as this post is written

Tuesday, September 26, 2023

Money Supply Charts Through August 2023

For reference purposes, below are two sets of charts depicting growth in the money supply.

The first shows the M1, defined in FRED as the following:

Before May 2020, M1 consists of (1) currency outside the U.S. Treasury, Federal Reserve Banks, and the vaults of depository institutions; (2) demand deposits at commercial banks (excluding those amounts held by depository institutions, the U.S. government, and foreign banks and official institutions) less cash items in the process of collection and Federal Reserve float; and (3) other checkable deposits (OCDs), consisting of negotiable order of withdrawal, or NOW, and automatic transfer service, or ATS, accounts at depository institutions, share draft accounts at credit unions, and demand deposits at thrift institutions.

Beginning May 2020, M1 consists of (1) currency outside the U.S. Treasury, Federal Reserve Banks, and the vaults of depository institutions; (2) demand deposits at commercial banks (excluding those amounts held by depository institutions, the U.S. government, and foreign banks and official institutions) less cash items in the process of collection and Federal Reserve float; and (3) other liquid deposits, consisting of OCDs and savings deposits (including money market deposit accounts). Seasonally adjusted M1 is constructed by summing currency, demand deposits, and OCDs (before May 2020) or other liquid deposits (beginning May 2020), each seasonally adjusted separately.

Here is the “M1 Money Stock” (seasonally adjusted) chart, updated on September 26, 2023 depicting data through August 2023, with a value of $18,320.4 Billion:

M1SL

Here is the “M1 Money Stock” chart on a “Percent Change From Year Ago” basis, with a current value of -10.5%:

M1SL Percent Change From Year Ago

Data Source: Board of Governors of the Federal Reserve System (US), M1 Money Stock [M1SL], retrieved from FRED, Federal Reserve Bank of St. Louis; accessed September 26, 2023: https://fred.stlouisfed.org/series/M1SL

The second set shows M2, defined in FRED as the following:

Before May 2020, M2 consists of M1 plus (1) savings deposits (including money market deposit accounts); (2) small-denomination time deposits (time deposits in amounts of less than $100,000) less individual retirement account (IRA) and Keogh balances at depository institutions; and (3) balances in retail money market funds (MMFs) less IRA and Keogh balances at MMFs.

Beginning May 2020, M2 consists of M1 plus (1) small-denomination time deposits (time deposits in amounts of less than $100,000) less IRA and Keogh balances at depository institutions; and (2) balances in retail MMFs less IRA and Keogh balances at MMFs. Seasonally adjusted M2 is constructed by summing savings deposits (before May 2020), small-denomination time deposits, and retail MMFs, each seasonally adjusted separately, and adding this result to seasonally adjusted M1.

Here is the “M2 Money Stock” (seasonally adjusted) chart, updated on September 26, 2023, depicting data through August 2023, with a value of $20,865.3 Billion:

M2SL

Here is the “M2 Money Stock” chart on a “Percent Change From Year Ago” basis, with a current value of -3.7%:

M2SL Percent Change From Year Ago

Data Source: Board of Governors of the Federal Reserve System (US), M2 Money Stock [M2SL], retrieved from FRED, Federal Reserve Bank of St. Louis; accessed September 26, 2023: https://fred.stlouisfed.org/series/M2SL

_____

The Special Note summarizes my overall thoughts about our economic situation

SPX at 4279.12 as this post is written

Monday, September 25, 2023

Updates Of Economic Indicators September 2023

The following is an update of various indicators that are supposed to predict and/or depict economic activity. These indicators have been discussed in previous blog posts:

The September 2023 Chicago Fed National Activity Index (CFNAI) updated as of September 25, 2023:

The CFNAI, with a current reading of -.16:

CFNAI -.16

source:  Federal Reserve Bank of Chicago, Chicago Fed National Activity Index [CFNAI], retrieved from FRED, Federal Reserve Bank of St. Louis; accessed September 25, 2023: 
https://fred.stlouisfed.org/series/CFNAI

The CFNAI-MA3, with a current reading of -.14:

CFNAIMA3 -.14

source:  Federal Reserve Bank of Chicago, Chicago Fed National Activity Index: Three Month Moving Average [CFNAIMA3], retrieved from FRED, Federal Reserve Bank of St. Louis; accessed September 25, 2023: 
https://fred.stlouisfed.org/series/CFNAIMA3

The Aruoba-Diebold-Scotti Business Conditions (ADS) Index

The ADS Index as of September 21, 2023, reflecting data from March 1, 1960 through September 16, 2023, with last value .286135:

ADS Index .286135

The Conference Board Leading Economic Index (LEI), Coincident Economic Index (CEI), and Lagging Economic Index (LAG):

As per the September 21, 2023 Conference Board press release the LEI was 105.4 in August, the CEI was 110.6 in August, and the LAG was 118.5 in August.

An excerpt from the release:

“With August’s decline, the US Leading Economic Index has now fallen for nearly a year and a half straight, indicating the economy is heading into a challenging growth period and possible recession over the next year,” said Justyna Zabinska-La Monica, Senior Manager, Business Cycle Indicators, at The Conference Board. “The leading index continued to be negatively impacted in August by weak new orders, deteriorating consumer expectations of business conditions, high interest rates, and tight credit conditions. All these factors suggest that going forward economic activity probably will decelerate and experience a brief but mild contraction. The Conference Board forecasts real GDP will grow by 2.2 percent in 2023, and then fall to 0.8 percent in 2024.”

Here is a chart of the LEI from the Advisor Perspectives’ Conference Board Leading Economic Index (LEI) update of September 21, 2023:

Conference Board LEI 105.4

_________

I post various indicators and indices because I believe they should be carefully monitored.  However, as those familiar with this site are aware, I do not necessarily agree with what they depict or imply.

_____

The Special Note summarizes my overall thoughts about our economic situation

SPX at 4317.10 as this post is written

Friday, September 22, 2023

The U.S. Economic Situation – September 22, 2023 Update

Perhaps the main reason that I write of our economic situation is that I continue to believe, based upon various analyses, that our economic situation is in many ways misunderstood.  While no one likes to contemplate a future rife with economic adversity, current and future economic problems must be properly recognized and rectified if high-quality, sustainable long-term economic vitality is to be realized.

There are an array of indications and other “warning signs” – many readily apparent – that current economic activity and financial market performance is accompanied by exceedingly perilous dynamics.
I have written extensively about this peril, including in the following:
Building Financial Danger” (ongoing updates)
My analyses continues to indicate that the growing level of financial danger will lead to the next stock market crash that will also involve (as seen in 2008) various other markets as well.  Key attributes of this next crash is its outsized magnitude (when viewed from an ultra-long term historical perspective) and the resulting economic impact.  This next financial crash is of tremendous concern, as my analyses indicate it will lead to a Super Depression – i.e. an economy characterized by deeply embedded, highly complex, and difficult-to-solve problems.

For long-term reference purposes, here is a chart of the Dow Jones Industrial Average since 1900, depicted on a monthly basis using a LOG scale (updated through September 20, 2023 with a last value of 34,440.88):

(click on chart to enlarge image)(chart courtesy of StockCharts.com)

DJIA since 1900

_____

The Special Note summarizes my overall thoughts about our economic situation

SPX at 4343.69 as this post is written

Thursday, September 21, 2023

Jerome Powell’s September 20, 2023 Press Conference – Notable Aspects

On Wednesday, September 20, 2023 FOMC Chairman Jerome Powell gave his scheduled September 2023 FOMC Press Conference. (link of video and related materials)

Below are Jerome Powell’s comments I found most notable – although I don’t necessarily agree with them – in the order they appear in the transcript.  These comments are excerpted from the “Transcript of Chairman Powell’s Press Conference“ (preliminary)(pdf) of September 20, 2023, with the accompanying “FOMC Statement” and “Summary of Economic Projections” (pdf) dated September 20, 2023.

Excerpts from Chairman Powell’s opening comments:

Since early last year, the FOMC has significantly tightened the stance of monetary policy.  We have raised our policy interest rate by 5-1/4 percentage points and have continued to reduce our securities holdings at a brisk pace.  We have covered a lot of ground, and the full effects of our tightening have yet to be felt.  Today we decided to leave our policy interest rate unchanged and to continue to reduce our securities holdings.  Looking ahead, we are in a position to proceed carefully in determining the extent of additional policy firming that may be appropriate.  Our decisions will be based on our ongoing assessments of the incoming data and the evolving outlook and risks.  I will have more to say about monetary policy after briefly reviewing economic developments.

also:

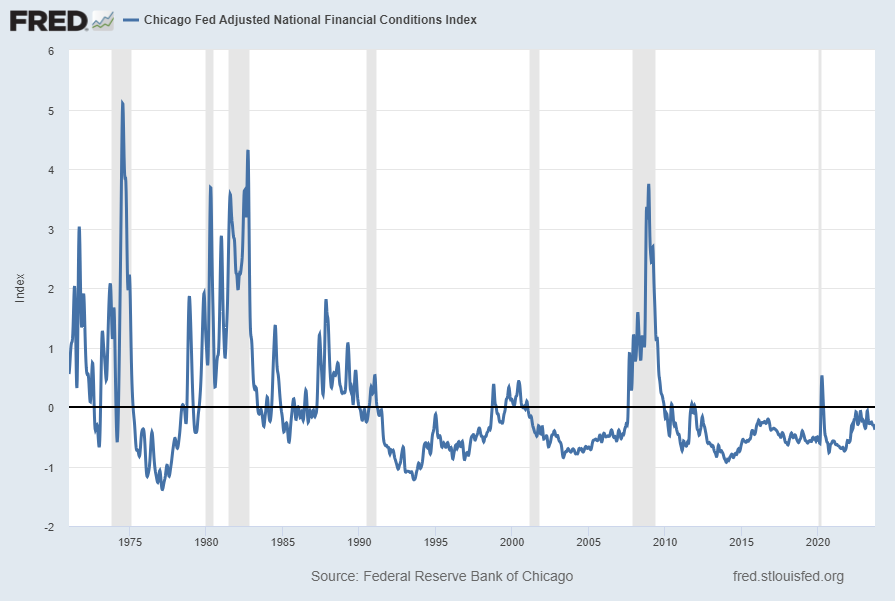
As I noted earlier, since early last year, we have raised our policy rate by 5-1/4 percentage points.  We see the current stance of monetary policy as restrictive, putting downward pressure on economic activity, hiring, and inflation.  In addition, the economy is facing headwinds from tighter credit conditions for households and businesses.  In light of how far we have come in tightening policy, the Committee decided at today’s meeting to maintain the target range for the federal funds rate at 5-1/4 to 5-1/2 percent and to continue the process of significantly reducing our securities holdings.

Excerpts of Jerome Powell’s responses as indicated to various questions:

COLBY SMITH.  Thank you. Colby Smith with the Financial Times. What makes the Committee inclined to think that the fed funds rate at this level is not yet sufficiently restrictive, especially when officials are forecasting a slightly more benign inflation outlook for this year? There’s noted uncertainty about policy lags. Headwinds have emerged from the looming government shutdown, the end of federal childcare funding, resumption of student debt payments, things of that nature. 

CHAIR POWELL.  So I guess I would characterize the situation a little bit differently. So we decided to maintain the target range for the federal funds rate where it is, at 5.25 percent to 5.5 percent, while continuing to reduce our securities holdings. And we say we’re committed to achieving and sustaining a stance of monetary policy that’s sufficiently restrictive to bring down inflation to 2 percent over time. We said that. But the fact that we decided to maintain the policy rate at this meeting doesn’t mean that we’ve decided that we have or have not at this time reached that stance of monetary policy that we’re seeking. If you look at the SEP, as you obviously will have done, you will see that the majority of participants believe that it is more likely than not that it will be appropriate for us to raise rates one more time in the two remaining meetings this year. Others believe that we have already reached that. So it’s something where we’re not making a decision about that question by deciding to just maintain the rate and await further data. 

COLBY SMITH.  So right now it’s still an open question about sufficiently restrictive. You’re not saying today that we’ve reached this level? 

CHAIR POWELL.  No. Clearly what we decided to do is maintain the policy rate and await further data. We want to see convincing evidence, really, that we have reached the appropriate level, and we’re seeing progress, and we welcome that. But we need to see more progress before we’ll be willing to reach that conclusion. 

COLBY SMITH.  And just on the 2024 projections, what’s behind that shallower path for interest rate cuts and the need for real rates to be 50 basis points higher? 

CHAIR POWELL.  Right. So, I would say it this way. First of all, real interest rates are positive now. They’re meaningfully positive. And that’s a good thing. We need policy to be restrictive so that we can get inflation down to target. Okay. And we’re going to need that to remain to be the case for some time. So I think, you know, remember that, of course, the SEP is not a plan that is negotiated or discussed, really, as a plan. It’s accumulation, really, and what you see are the medians. It’s accumulation of individual forecasts from 19 people, and then what you’re seeing are the medians. So I wouldn’t want to bestow upon it the idea that it’s really a plan. But what it reflects, though, is that economic activity has been stronger than we expected, stronger than I think everyone expected. And so what you’re seeing is this is what people believe, as of now, will be appropriate to achieve what we’re looking to achieve, which is progress toward our inflation goal, as you see in the SEP. 

also:

STEVE LIESMAN.  Steve Leisman, CNBC. Mr. Chairman, I want to return to Colby’s question here. What is it saying about the Committee’s view of the inflation dynamic in the economy that you achieve the same forecast inflation rate for next year but need another half a point of the funds rate on it? Does it tell us that the Committee believes inflation to be more persistent, requires more medicine effectively? And I guess a related question is if you’re going to project a funds rate above the longer-run rate for four years in a row, at what point do we start to think, hey, maybe the longer rate or the neutral rate is actually higher? Thank you.

CHAIR POWELL.   So I guess I would point more to — rather than pointing to a sense of inflation having become more persistent, we’ve seen inflation be more persistent over the course of the past year, but I wouldn’t say that’s something that’s appeared in the recent data. It’s more about stronger economic activity, I would say. So if I had to attribute one thing, again, we’re picking medians here and trying to attribute one explanation, but I think broadly stronger economic activity means we have to do more with rates, and that’s what that meaning is telling you. In terms of what the neutral rate can be, you know, we know it by its works. We only know it by its works, really. We can’t – we can’t – the models that we use, ultimately you only know when you get there and by the way the economy reacts, and, again, that’s another reason why we’re moving carefully now because, you know, there are lags here. So it may, of course, be that the neutral rate has risen. You do see people, you don’t see the median moving, but you do see people raising their estimates of the neutral rate, and it’s certainly plausible that the neutral rate is higher than the longer-run rate. Remember, what we write down in the SEP is the longer-run rate. It is certainly possible that, you know, that the neutral rate at this moment is higher than that and that that’s part of the explanation for why the economy has been more resilient than expected. 

also:

CHRIS RUGABER. Hi. Thank you. Chris Rugaber, Associated Press. When you look at the disinflation that has taken place so far, do you see it mostly as a result of what some economists are calling the low-hanging fruit, such as the unwinding of supply chain snarls and other pandemic disruptions, or is it more of a broad disinflationary trend that involves most goods and services across the economy? Thank you. 

CHAIR POWELL. If I understood your question, I would say it this way. I think we knew from the time, from before when we lifted off, but certainly by the time we lifted, we knew that bringing inflation back down was going to take, as I call it, the unwinding of these distortions to both supply and demand that happened because of the pandemic and the response. So that unwinding was going to be important. In addition, monetary policy was going to help. It was going to help supply side heal by cooling demand off and just, in general, better aligning supply with demand. So those two forces were always going to be important. I think it’s very hard to pull them apart. They work together. I do think both of them are at work now, and I think they’re at work in a way that shows you the progress that we are seeing. 

_____

_____

The Special Note summarizes my overall thoughts about our economic situation

SPX at 4355.76 as this post is written