The Chicago Fed National Activity Index (CFNAI) and the Aruoba-Diebold-Scotti Business Conditions Index (ADS Index) are two broad-based economic indicators that I regularly feature in this site.
The short-term and long-term trends of each continue to be notable.
The Advisor Perspectives’ post of December 30, 2021, titled “The Philly Fed ADS Index Business Conditions Index Update” displays both the CFNAI MA-3 (CFNAI on a 3-month Moving Average) and ADS Index (91-Day Moving Average) from a variety of perspectives.
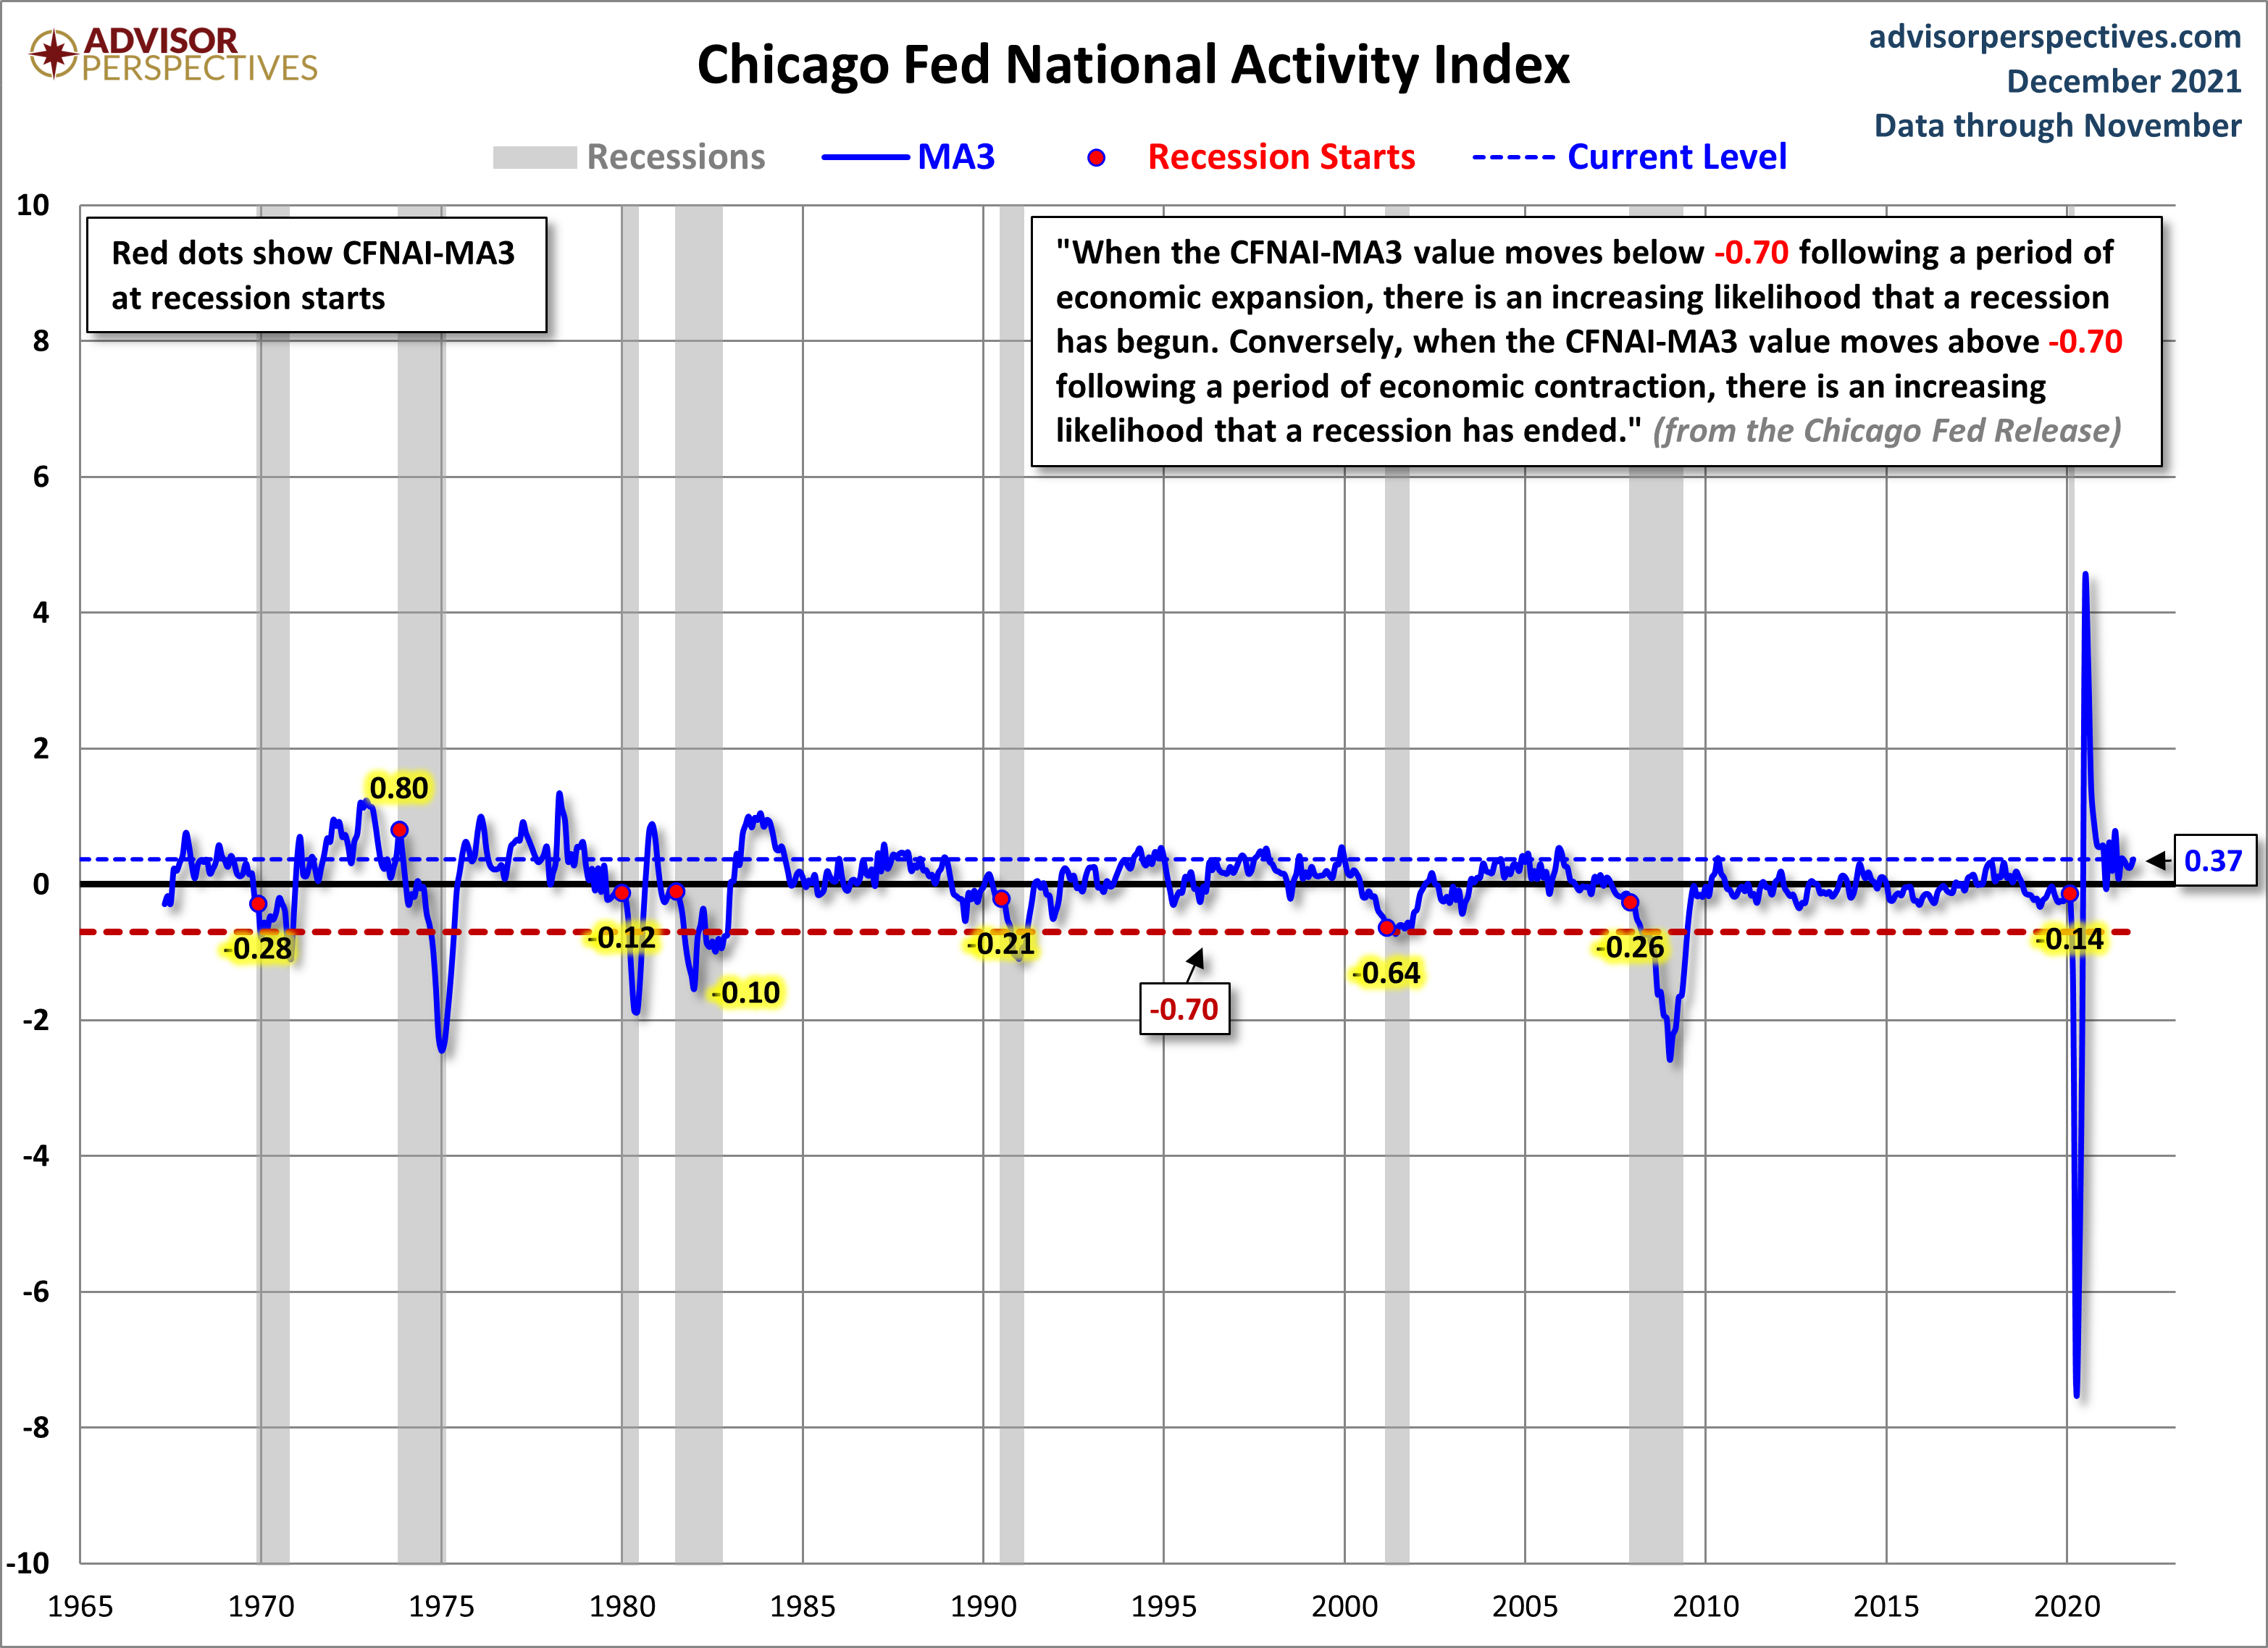
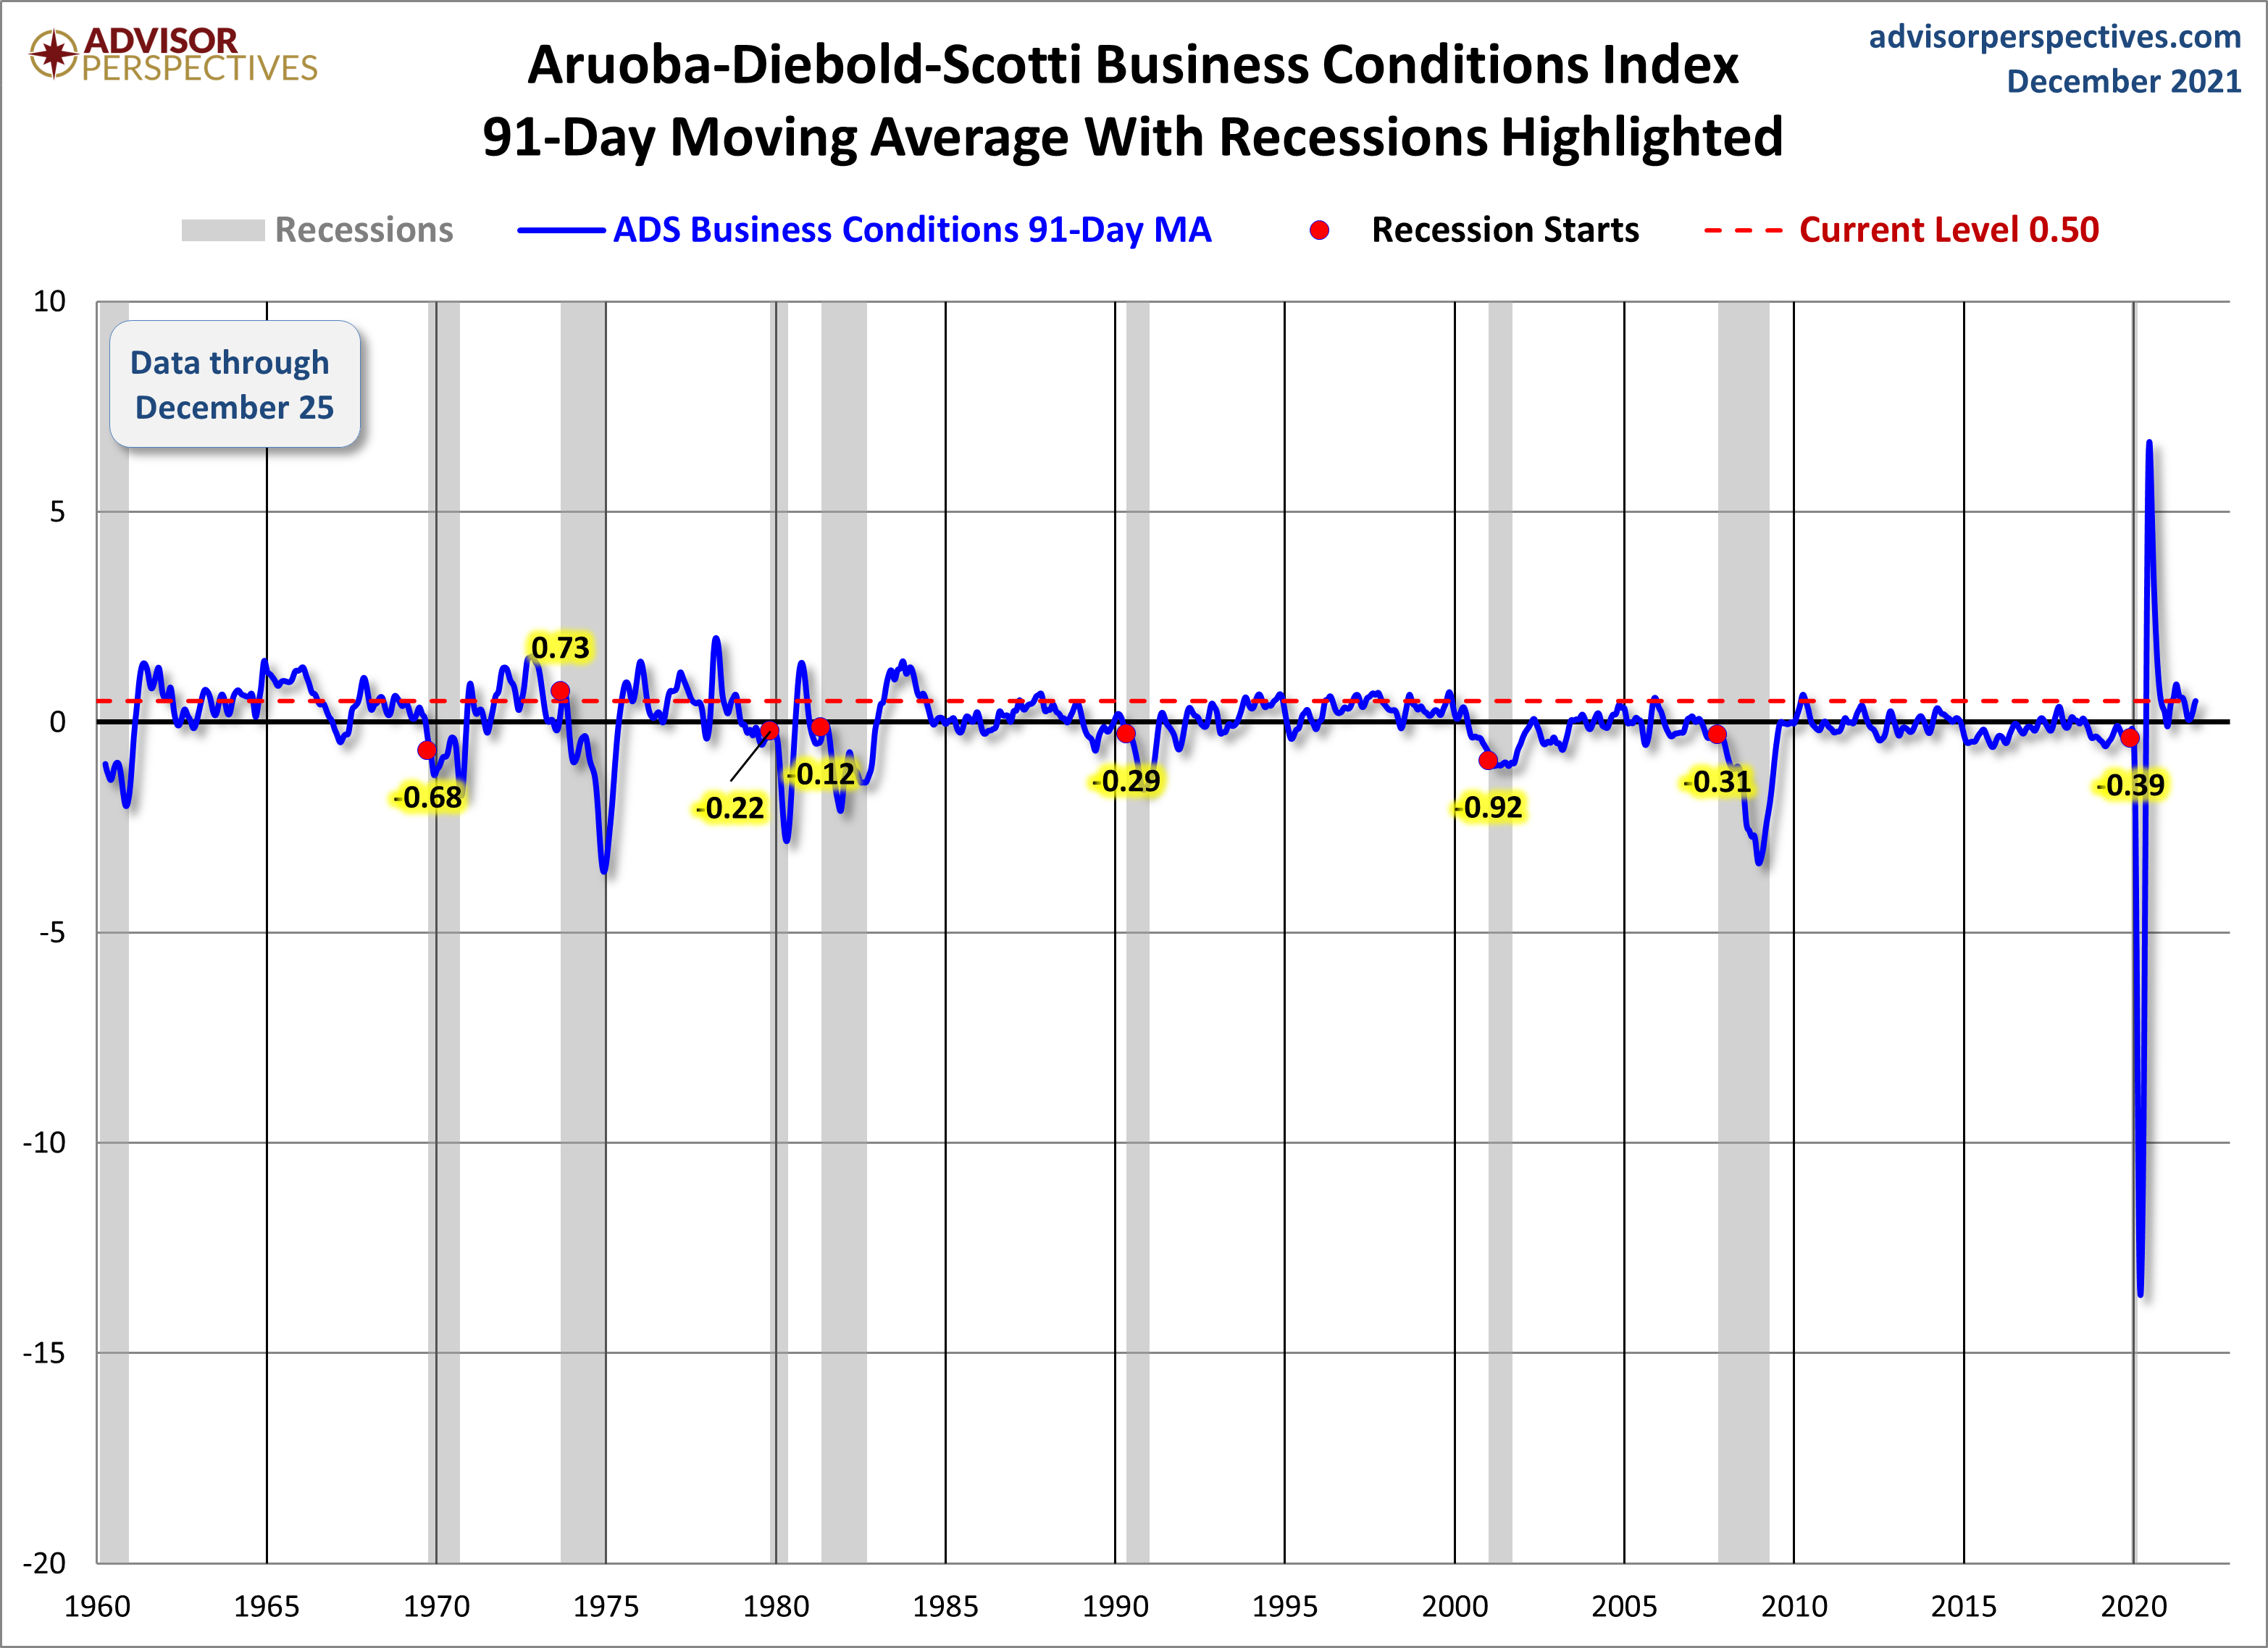
Of particular note, two of the charts, shown below, denote where the current levels of each reading is relative to the beginning of recessionary periods, as depicted by the red dots.
The CFNAI MA-3:
(click on charts to enlarge images)
–
The ADS Index, 91-Day MA:
–
Also shown in the aforementioned post is a chart of each with a long-term trendline (linear regression) as well as a chart depicting GDP for comparison purposes.
_________
I post various indicators and indices because I believe they should be carefully monitored. However, as those familiar with this site are aware, I do not necessarily agree with what they depict or imply.
_____
The Special Note summarizes my overall thoughts about our economic situation
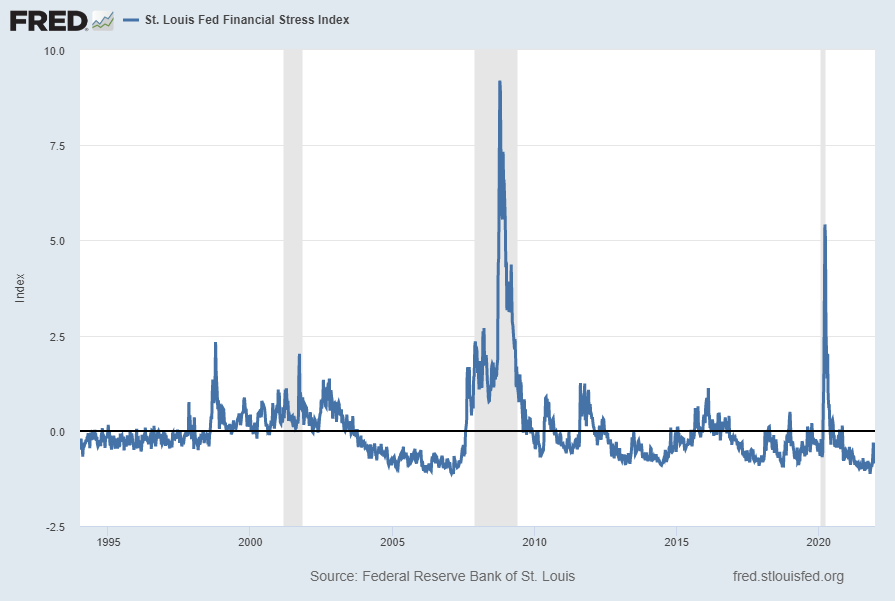
The St. Louis Fed’s Financial Stress Index (STLFSI2) is one index that is supposed to measure stress in the financial system. Its reading as of the December 30, 2021 update (reflecting data through December 24, 2021) is -.6940:
source: Federal Reserve Bank of St. Louis, St. Louis Fed Financial Stress Index [STLFSI2], retrieved from FRED, Federal Reserve Bank of St. Louis; accessed December 30, 2021: https://fred.stlouisfed.org/series/STLFSI2
Of course, there are a variety of other measures and indices that are supposed to measure financial stress and other related issues, both from the Federal Reserve as well as from private sources.
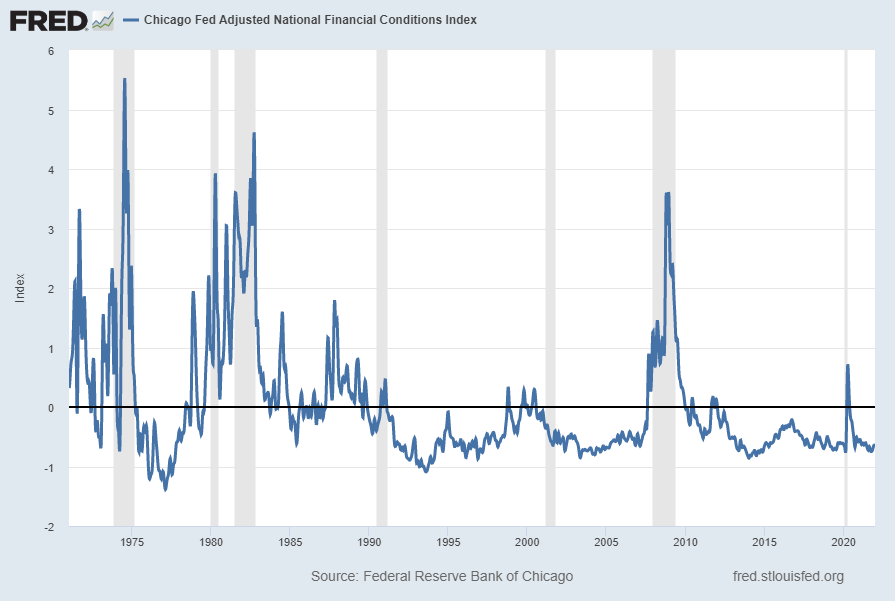
Two other indices that I regularly monitor include the Chicago Fed National Financial Conditions Index (NFCI) as well as the Chicago Fed Adjusted National Financial Conditions Index (ANFCI).
Here are summary descriptions of each, as seen in FRED:
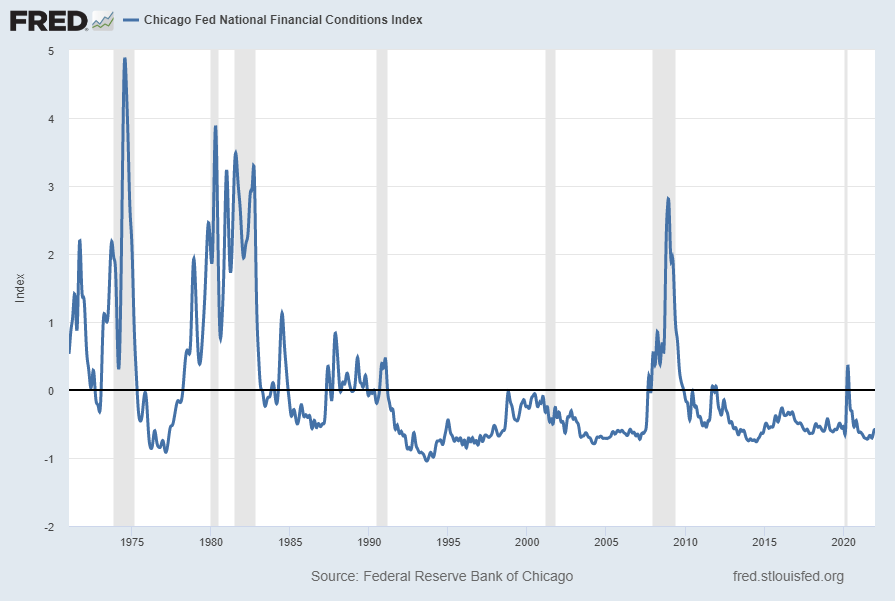
The National Financial Conditions Index (NFCI) measures risk, liquidity and leverage in money markets and debt and equity markets as well as in the traditional and “shadow” banking systems. Positive values of the NFCI indicate financial conditions that are tighter than average, while negative values indicate financial conditions that are looser than average.
The adjusted NFCI (ANFCI). This index isolates a component of financial conditions uncorrelated with economic conditions to provide an update on how financial conditions compare with current economic conditions.
For further information, please visit the Federal Reserve Bank of Chicago’s web site:
Below are the most recently updated charts of the NFCI and ANFCI, respectively.
The NFCI chart below was last updated on December 30, 2021 incorporating data from January 8, 1971 through December 24, on a weekly basis. The December 24 value is -.58094:
The ANFCI chart below was last updated on December 29, 2021 incorporating data from January 8, 1971 through December 24, 2021, on a weekly basis. The December 24, 2021 value is -.65877:
I post various indicators and indices because I believe they should be carefully monitored. However, as those familiar with this site are aware, I do not necessarily agree with what they depict or imply.
_____
The Special Note summarizes my overall thoughts about our economic situation
In the July 2, 2010 post I explained my policy with regard to changing the content of posts after the day the posts have been published on the blog.
While I change bad links and incorrect formatting without notification, I believe that changing blog posts’ content warrants disclosure.
Over time I have made corrections to content on various blog posts. These corrections generally have been for reasons of (factual) accuracy and – for better readability – to correct typos and/or incorrect extraneous wording.
A list of these corrections is seen below. This list indicates the posts corrected and the reason for such corrections. The error as seen in the original posting is seen in bold:
I post various indicators and indices because I believe they should be carefully monitored. However, as those familiar with this site are aware, I do not necessarily agree with what they depict or imply.
_____
The Special Note summarizes my overall thoughts about our economic situation
For reference purposes, below are two sets of charts depicting growth in the money supply.
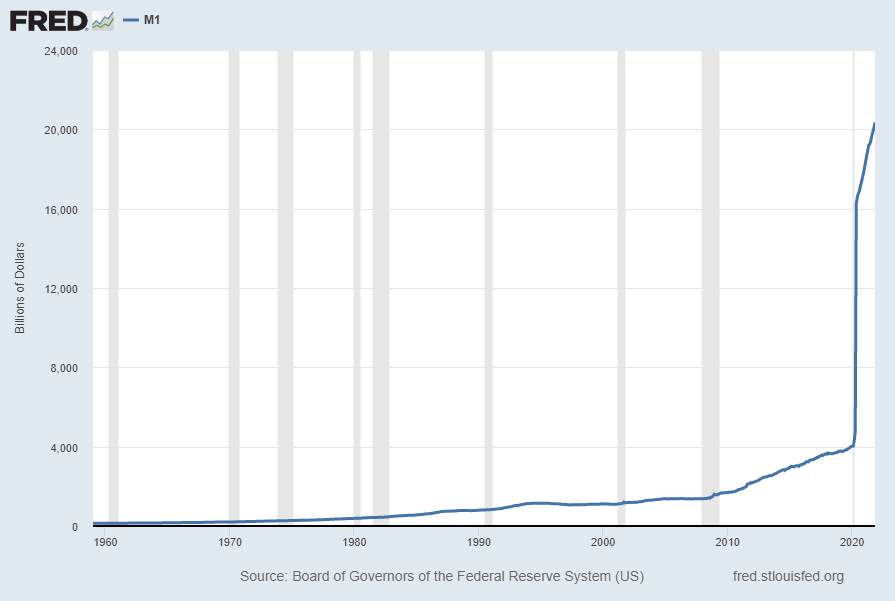
The first shows the M1, defined in FRED as the following:
Before May 2020, M1 consists of (1) currency outside the U.S. Treasury, Federal Reserve Banks, and the vaults of depository institutions; (2) demand deposits at commercial banks (excluding those amounts held by depository institutions, the U.S. government, and foreign banks and official institutions) less cash items in the process of collection and Federal Reserve float; and (3) other checkable deposits (OCDs), consisting of negotiable order of withdrawal, or NOW, and automatic transfer service, or ATS, accounts at depository institutions, share draft accounts at credit unions, and demand deposits at thrift institutions.
Beginning May 2020, M1 consists of (1) currency outside the U.S. Treasury, Federal Reserve Banks, and the vaults of depository institutions; (2) demand deposits at commercial banks (excluding those amounts held by depository institutions, the U.S. government, and foreign banks and official institutions) less cash items in the process of collection and Federal Reserve float; and (3) other liquid deposits, consisting of OCDs and savings deposits (including money market deposit accounts). Seasonally adjusted M1 is constructed by summing currency, demand deposits, and OCDs (before May 2020) or other liquid deposits (beginning May 2020), each seasonally adjusted separately.
Here is the “M1 Money Stock” (seasonally adjusted) chart, updated on December 28, 2021 depicting data through November 2021, with a value of $20,345.0 Billion:
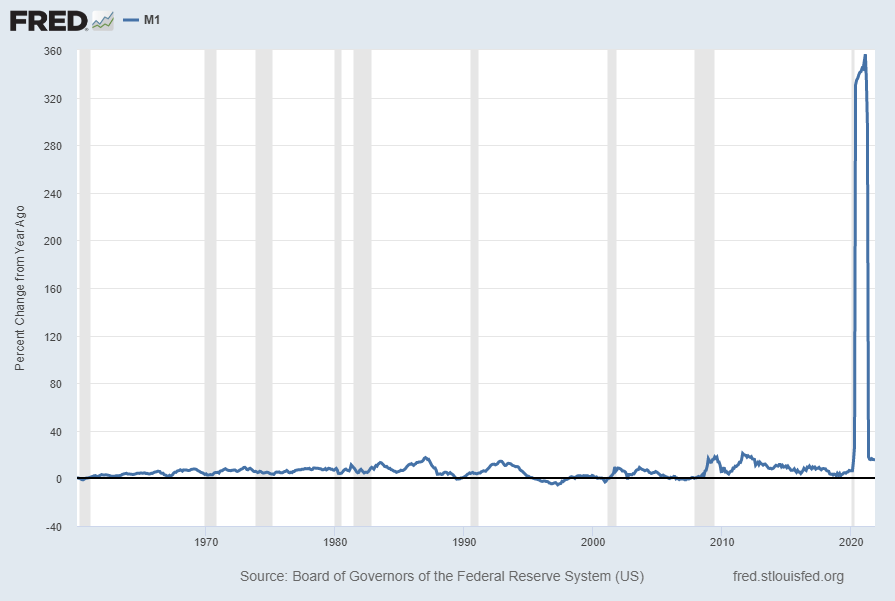
Here is the “M1 Money Stock” chart on a “Percent Change From Year Ago” basis, with a current value of 15.7%:
Data Source: Board of Governors of the Federal Reserve System (US), M1 Money Stock [M1SL], retrieved from FRED, Federal Reserve Bank of St. Louis; accessed December 28, 2021: https://fred.stlouisfed.org/series/M1SL
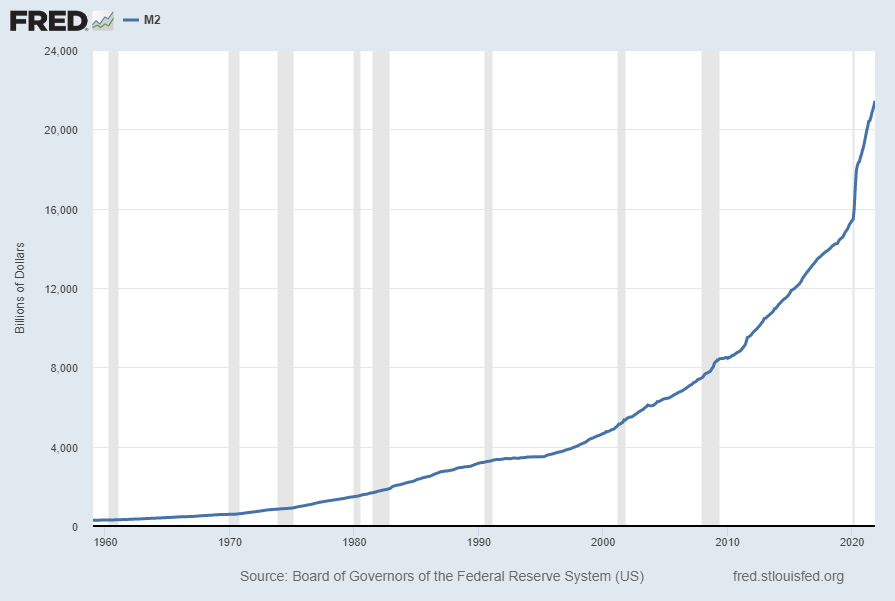
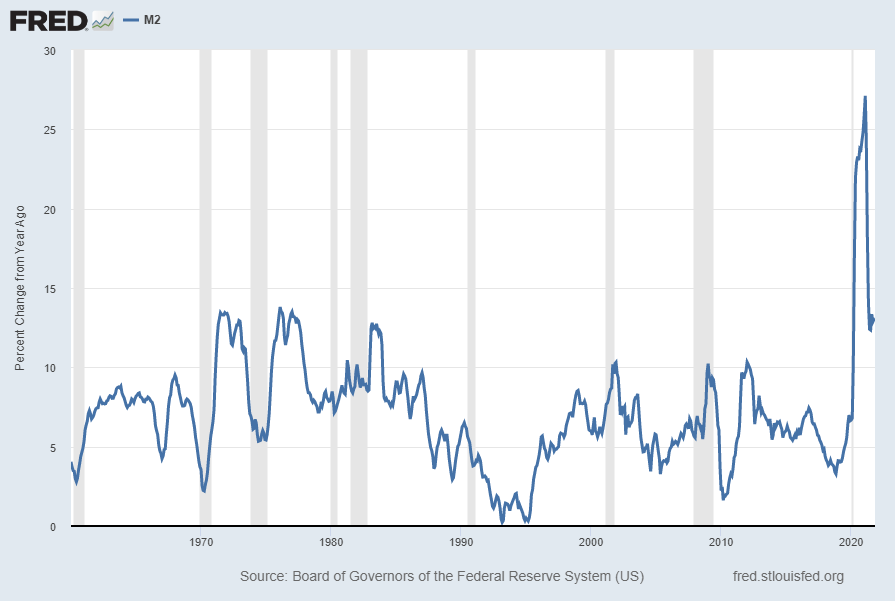
The second set shows M2, defined in FRED as the following:
Before May 2020, M2 consists of M1 plus (1) savings deposits (including money market deposit accounts); (2) small-denomination time deposits (time deposits in amounts of less than $100,000) less individual retirement account (IRA) and Keogh balances at depository institutions; and (3) balances in retail money market funds (MMFs) less IRA and Keogh balances at MMFs.
Beginning May 2020, M2 consists of M1 plus (1) small-denomination time deposits (time deposits in amounts of less than $100,000) less IRA and Keogh balances at depository institutions; and (2) balances in retail MMFs less IRA and Keogh balances at MMFs. Seasonally adjusted M2 is constructed by summing savings deposits (before May 2020), small-denomination time deposits, and retail MMFs, each seasonally adjusted separately, and adding this result to seasonally adjusted M1.
Here is the “M2 Money Stock” (seasonally adjusted) chart, updated on December 28, 2021, depicting data through November 2021, with a value of $21,436.7 Billion:
Here is the “M2 Money Stock” chart on a “Percent Change From Year Ago” basis, with a current value of 13.1%:
Data Source: Board of Governors of the Federal Reserve System (US), M2 Money Stock [M2SL], retrieved from FRED, Federal Reserve Bank of St. Louis; accessed December 28, 2021: https://fred.stlouisfed.org/series/M2SL
_____
The Special Note summarizes my overall thoughts about our economic situation
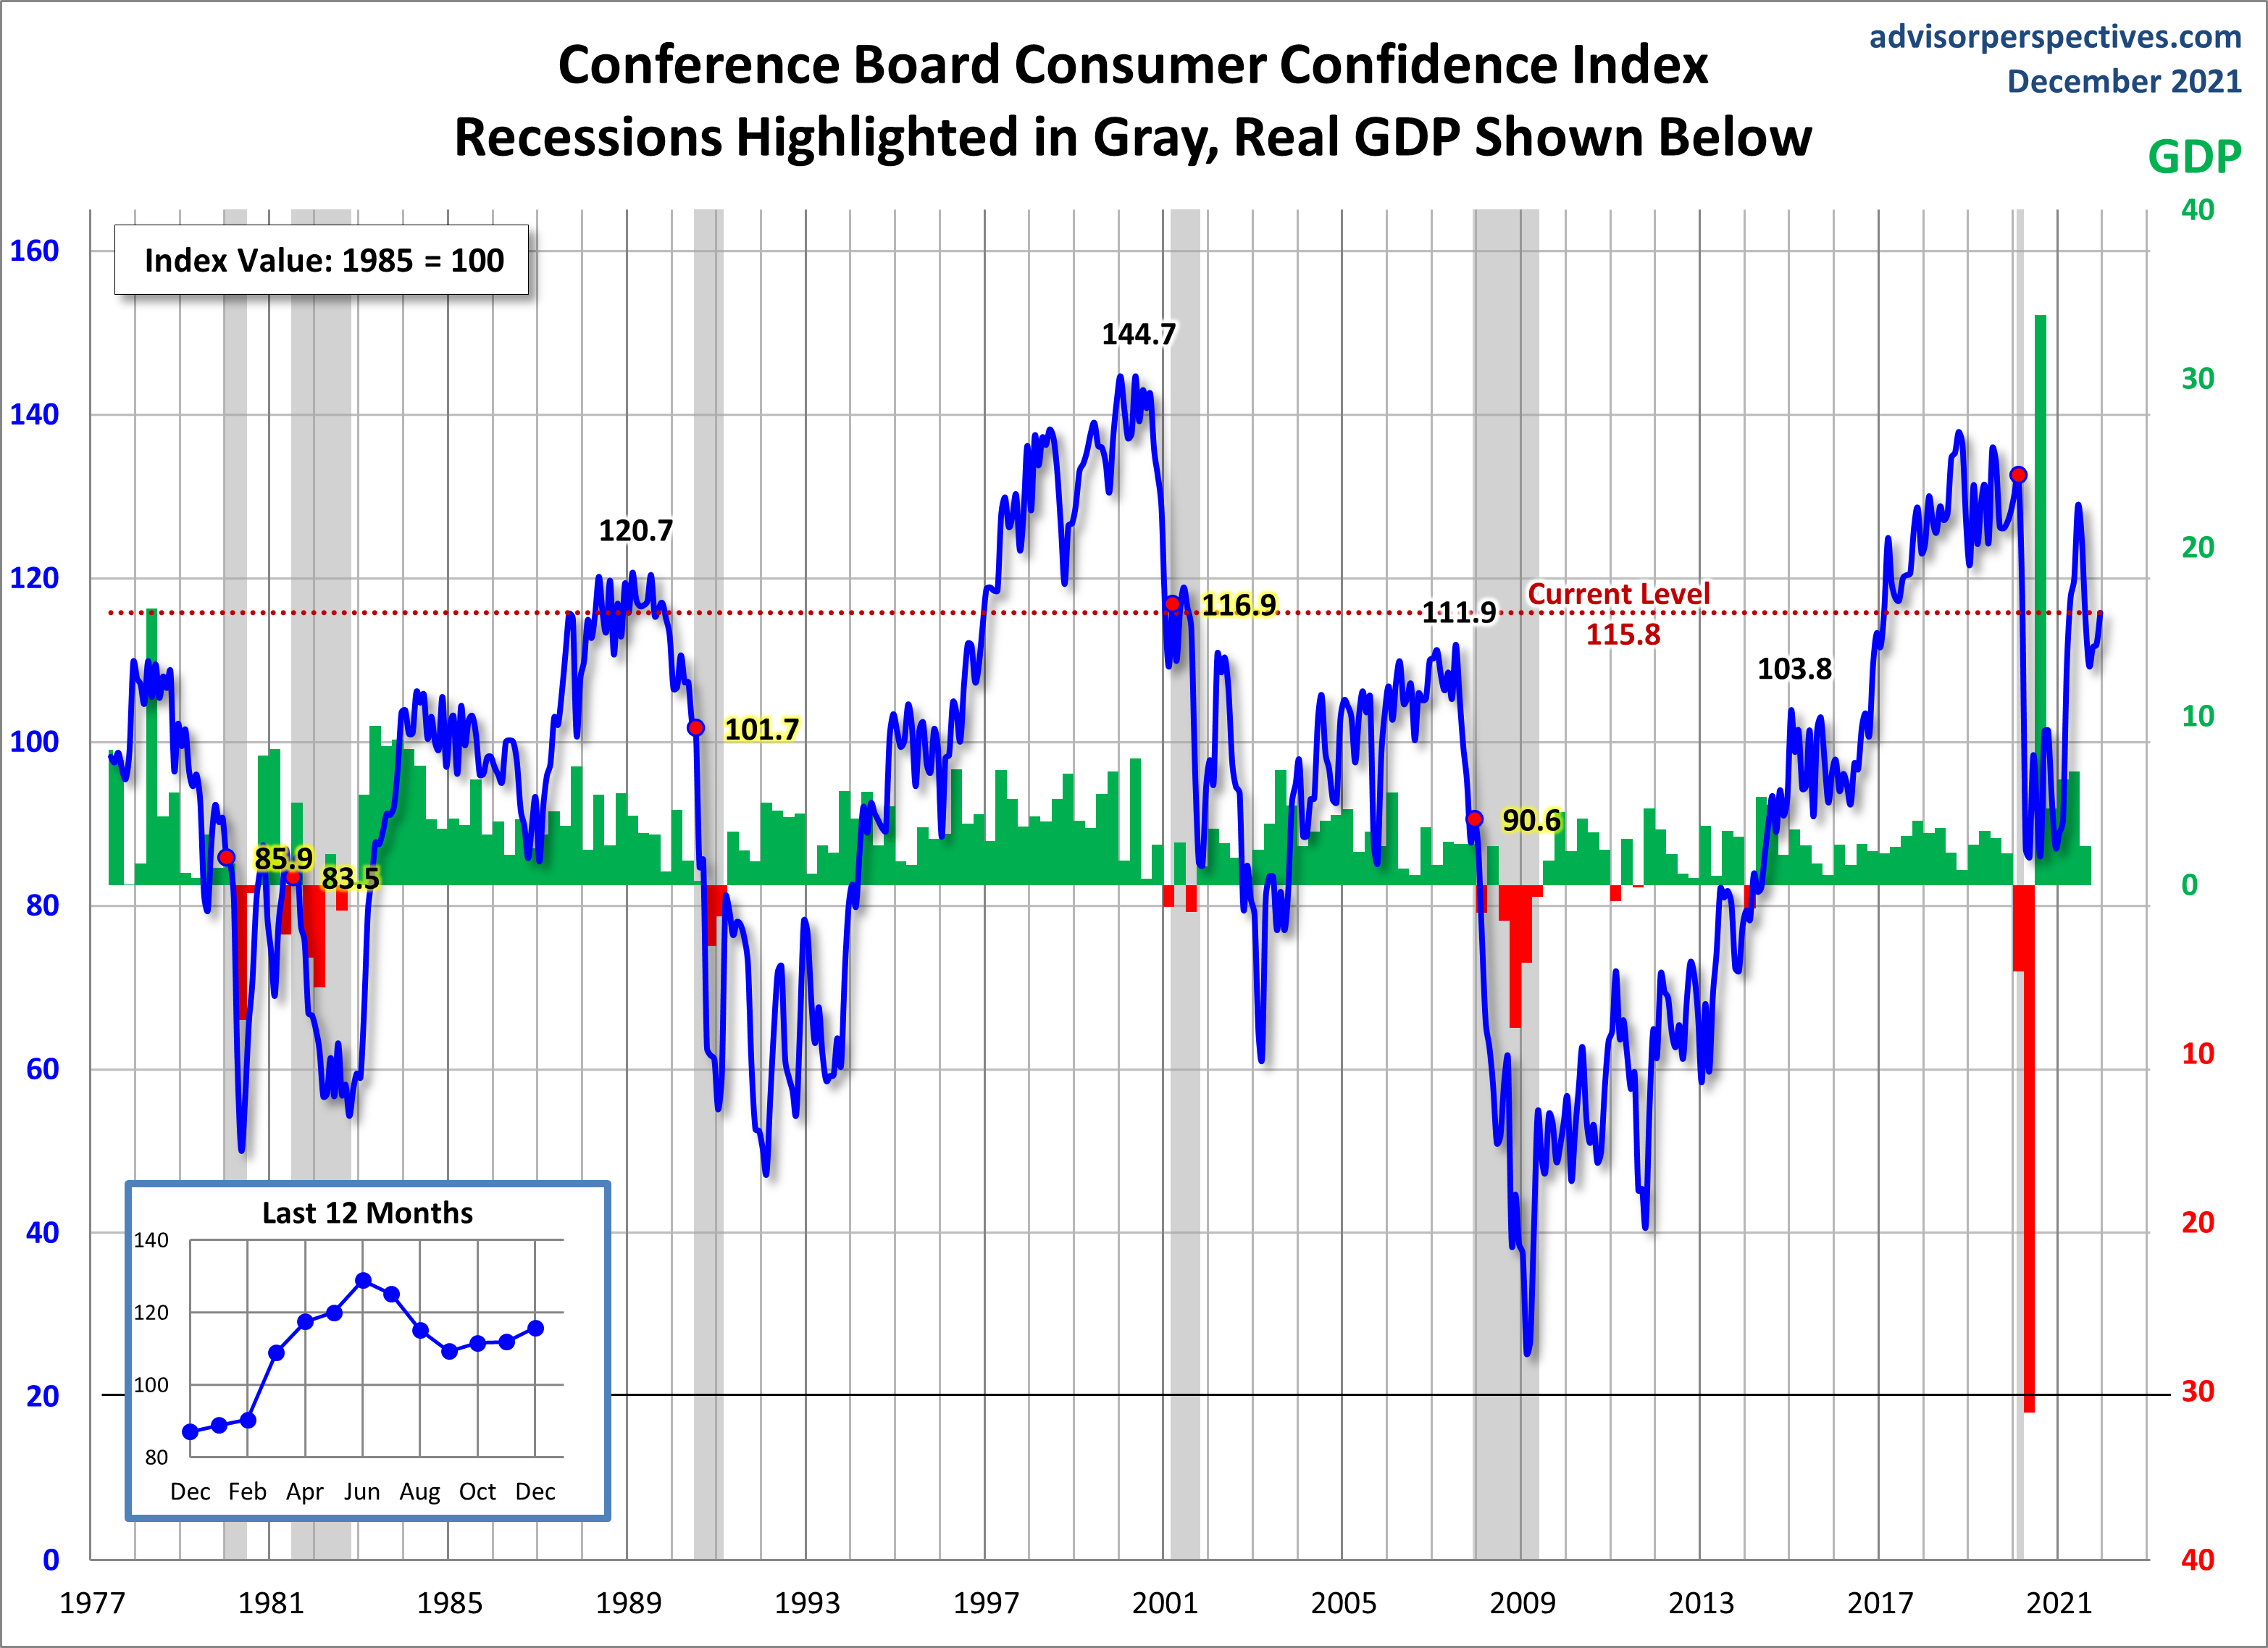
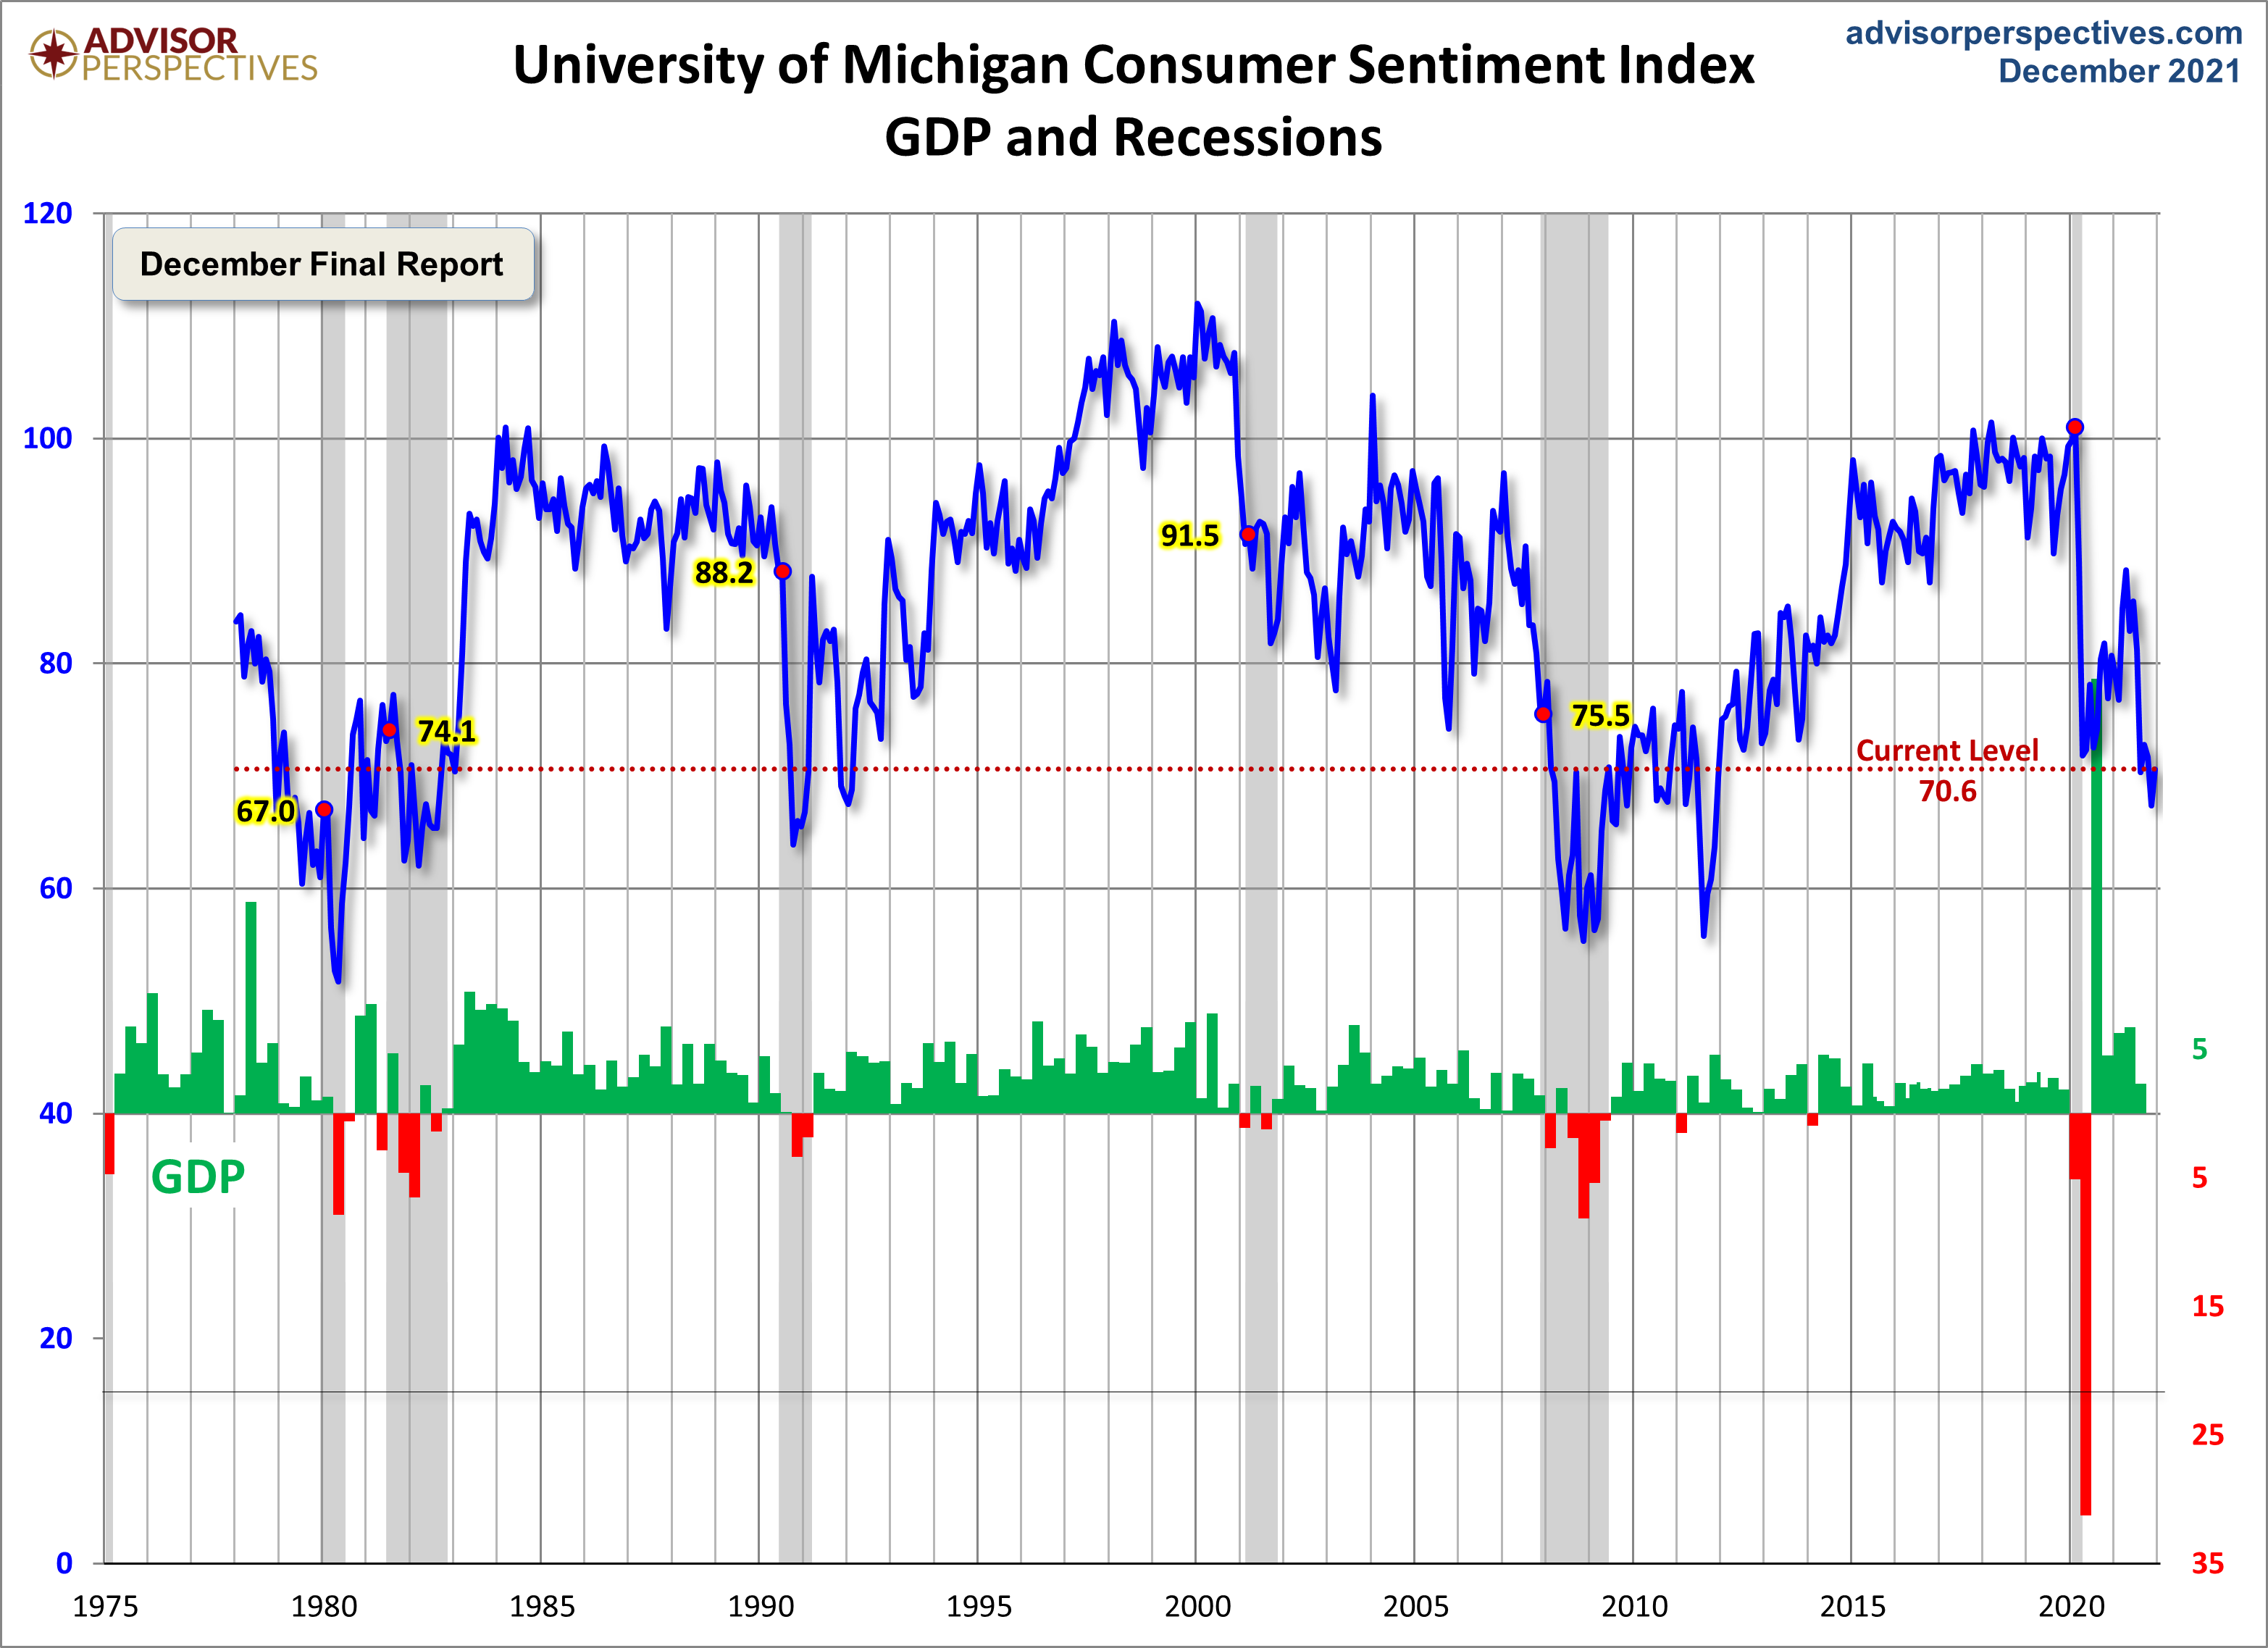
Advisor Perspectives had a post of December 28, 2021 (“Consumer Confidence Improved in December“) that displays the latest Conference Board Consumer Confidence and Thomson/Reuters University of Michigan Consumer Sentiment Index charts. They are presented below:
(click on charts to enlarge images)
–
While I don’t believe that confidence surveys should be overemphasized, I find these readings and trends to be notable, especially in light of a variety of other highly disconcerting measures highlighted throughout this site.
_____
The Special Note summarizes my overall thoughts about our economic situation
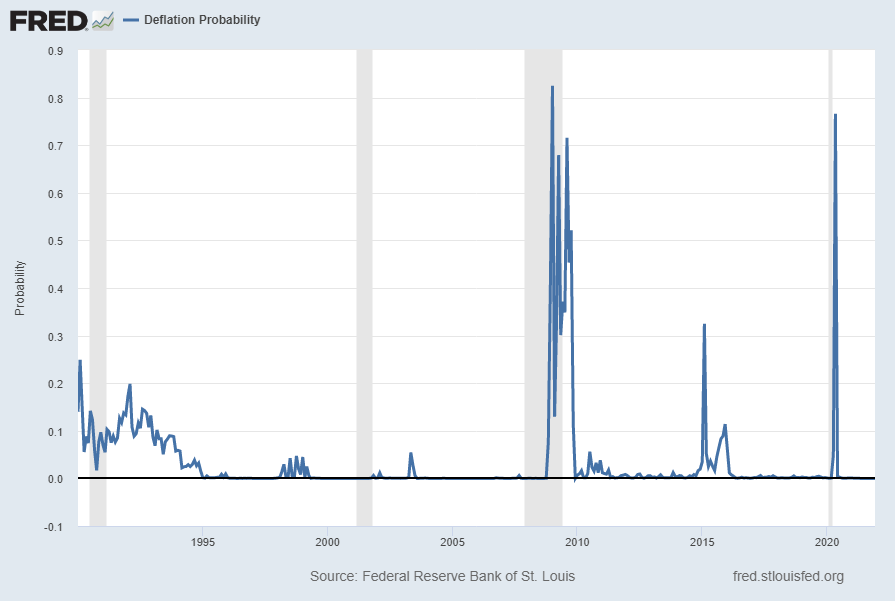
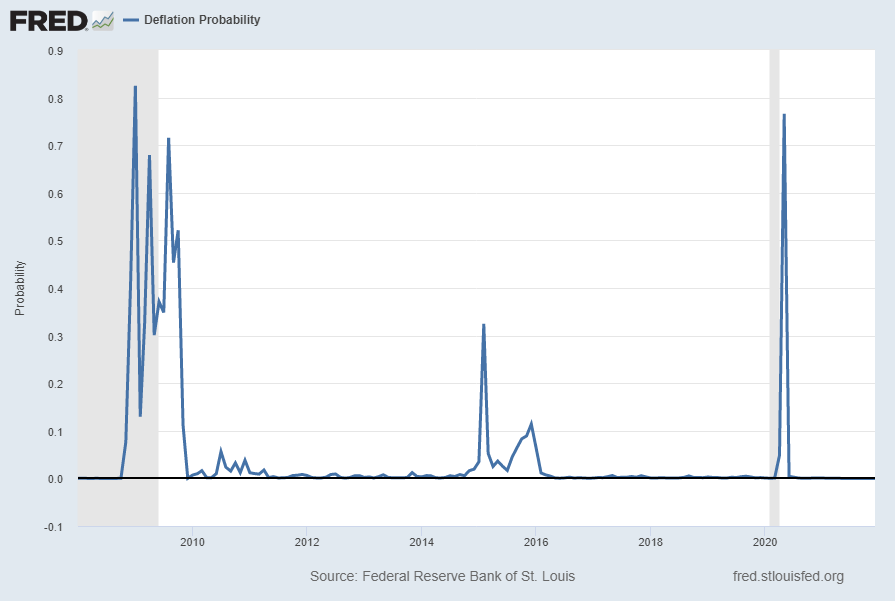
For reference, below is a chart of the St. Louis Fed Price Pressures Measures – Deflation Probability [FRED STLPPMDEF] through December 2021.
While I do not necessarily agree with the current readings of the measure, I view this as a proxy of U.S. deflation probability.
A description of this measure, as seen in FRED:
This series measures the probability that the personal consumption expenditures price index (PCEPI) inflation rate (12-month changes) over the next 12 months will fall below zero.
The chart, on a monthly basis from January 1990 – December 2021, with a last reading of .00000, last updated on December 23, 2021:
Here is this same U.S. deflation probability measure since 2008:
source: Federal Reserve Bank of St. Louis, Deflation Probability [STLPPMDEF], retrieved from FRED, Federal Reserve Bank of St. Louis; accessed December 23, 2021: https://fred.stlouisfed.org/series/STLPPMDEF
_________
I post various economic indicators and indices because I believe they should be carefully monitored. However, as those familiar with this site are aware, I do not necessarily agree with what they depict or imply.
_____
The Special Note summarizes my overall thoughts about our economic situation
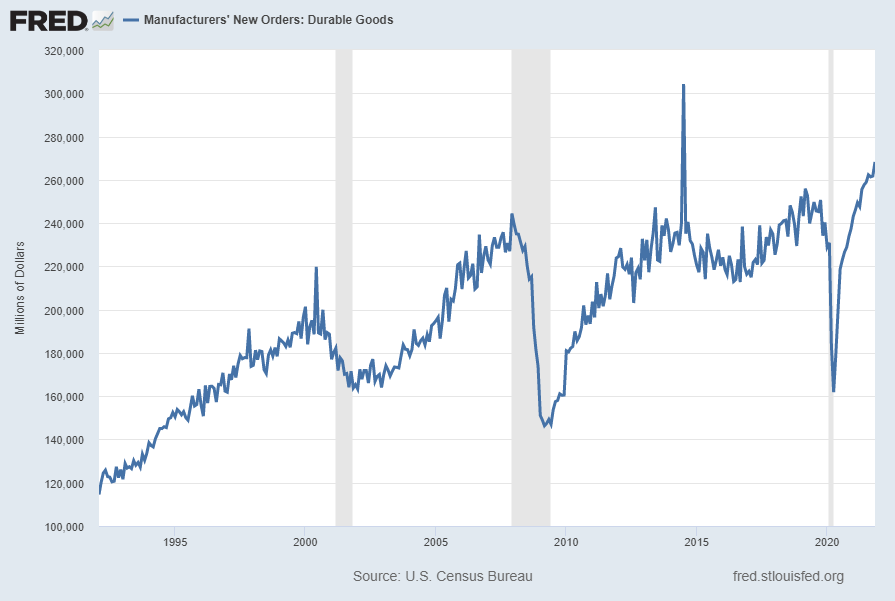
Many people place emphasis on Durable Goods New Orders as a prominent economic indicator and/or leading economic indicator.
For reference, below are two charts depicting this measure.
First, from the St. Louis Fed site (FRED), a chart through November 2021, updated on December 23, 2021. This value is $268,251 ($ Millions):
(click on charts to enlarge images)
–
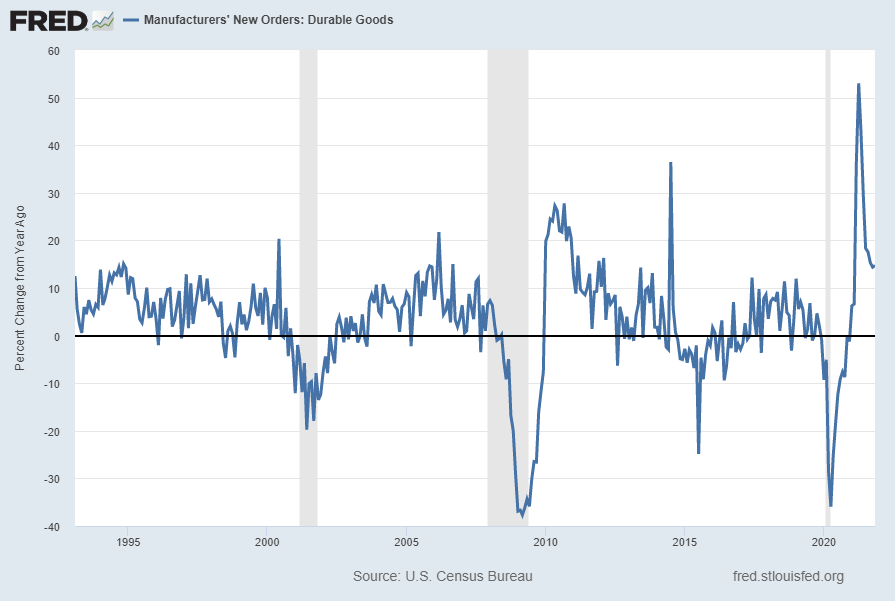
Second, here is the chart depicting this measure on a “Percent Change from a Year Ago” basis, with a last value of 14.7%:
Data Source: FRED, Federal Reserve Economic Data, Federal Reserve Bank of St. Louis: Manufacturers’ New Orders: Durable Goods [DGORDER]; U.S. Department of Commerce: Census Bureau; accessed December 23, 2021; http://research.stlouisfed.org/fred2/series/DGORDER
_________
I post various indicators and indices because I believe they should be carefully monitored. However, as those familiar with this site are aware, I do not necessarily agree with what they depict or imply.
_____
The Special Note summarizes my overall thoughts about our economic situation
Perhaps the main reason that I write of our economic situation is that I continue to believe, based upon various analyses, that our economic situation is in many ways misunderstood. While no one likes to contemplate a future rife with economic adversity, current and future economic problems must be properly recognized and rectified if high-quality, sustainable long-term economic vitality is to be realized.
There are an array of indications and other “warning signs” – many readily apparent – that current economic activity and financial market performance is accompanied by exceedingly perilous dynamics.
I have written extensively about this peril, including in the following:
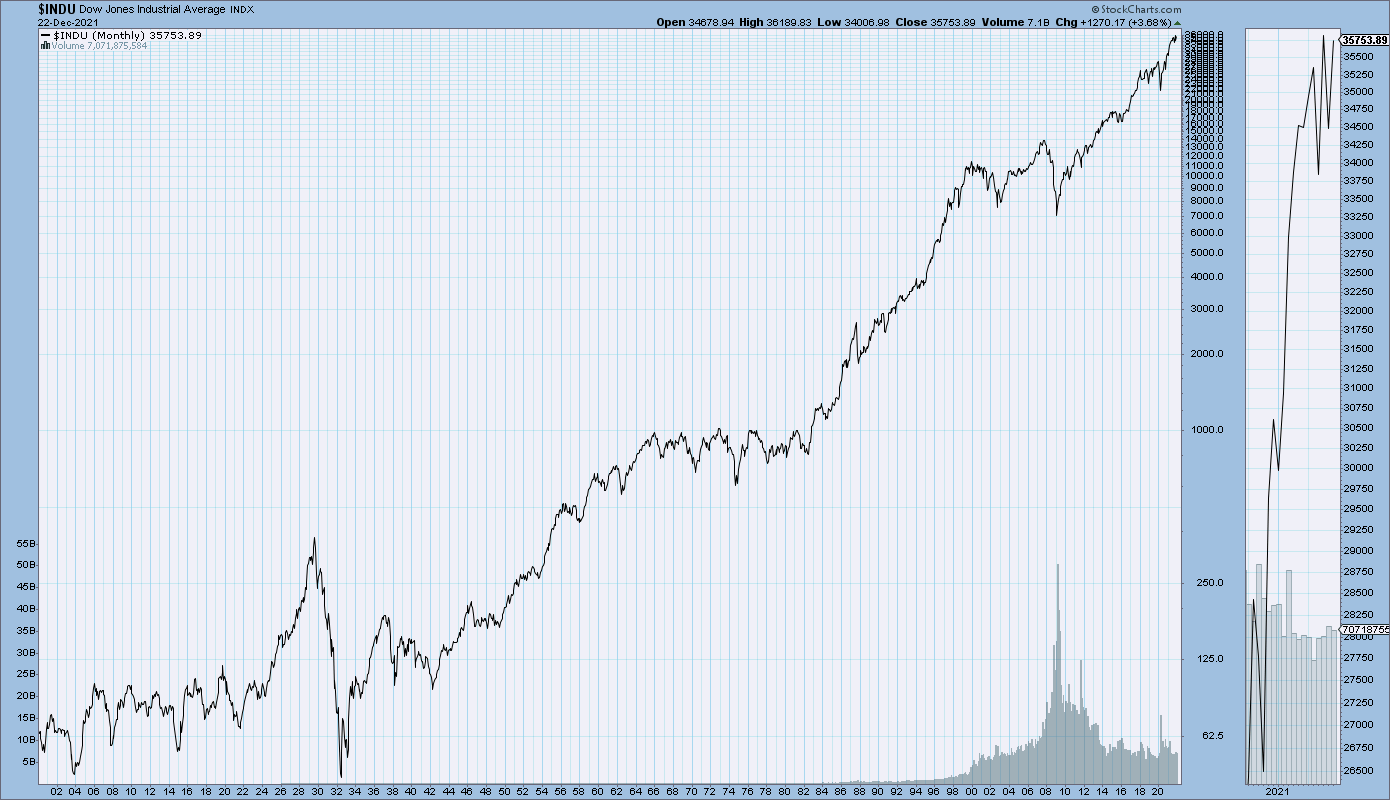
My analyses continues to indicate that the growing level of financial danger will lead to the next stock market crash that will also involve (as seen in 2008) various other markets as well. Key attributes of this next crash is its outsized magnitude (when viewed from an ultra-long term historical perspective) and the resulting economic impact. This next financial crash is of tremendous concern, as my analyses indicate it will lead to a Super Depression – i.e. an economy characterized by deeply embedded, highly complex, and difficult-to-solve problems.
For long-term reference purposes, here is a chart of the Dow Jones Industrial Average since 1900, depicted on a monthly basis using a LOG scale (updated through December 22, 2021, with a last value of 35,753.89):
(click on chart to enlarge image)(chart courtesy of StockCharts.com)
_____
The Special Note summarizes my overall thoughts about our economic situation
On December 9, 2021, The Conference Board released the Q4 2021 Measure Of CEO Confidence. The overall measure of CEO Confidence was at 65, down from the previous reading of 67. [note: a reading of more than 50 points reflects more positive than negative responses]
Notable excerpts from this December 9, 2021 Press Release include:
Current Conditions
CEOs’ assessment of general economic conditions declined in Q4:
61% of CEOs reported economic conditions were better compared to six months ago, down from 70% in Q3.
Conversely, 19% said conditions were worse, up from 11%.
CEOs were less optimistic about conditions in their own industries in Q4:
58% of CEOs reported that conditions in their industries were better compared to six months ago, down from 64%.
Equally, 18% said conditions in their own industries were worse, up from 10%.
Future Conditions
Expectations about the short-term economic outlook remained positive in Q4:
61% percent of CEOs said they expect economic conditions to improve over the next six months, up slightly from 60% in Q3. Moreover, the percent that said conditions were “much better” rose.
Only 13% expect conditions to worsen, up from 9%.
CEOs’ expectations regarding short-term prospects in their own industries also moderated in Q4:
61% of CEOs expect conditions in their own industry to improve over the next six months, down from 65%. However, the percent that said conditions were “much better” rose.
Only 8% expected conditions to worsen, up from 6%.
Consistent with other economic data on consumer spending, business activity and a tightening labor market, the overall CEO Economic Outlook Index rose to its highest level in its 20-year history to a value of 124, up 10 points from Q3 2021. The three subindices are all well above long-run averages and were as follows:
• Plans for hiring increased 13 points to a value of 121.
• Plans for capital investment increased 7 points to a value of 115.
• Expectations for sales increased 9 points to a value of 135.
The survey was conducted between November 3 and November 22. In their first estimate of 2022 U.S. GDP growth, CEOs projected 3.9% growth for the year.
Additional details can be seen in the sources mentioned above.
_____
I post various economic forecasts because I believe they should be carefully monitored. However, as those familiar with this site are aware, I do not necessarily agree with many of the consensus estimates and much of the commentary in these forecast surveys.
_____
The Special Note summarizes my overall thoughts about our economic situation
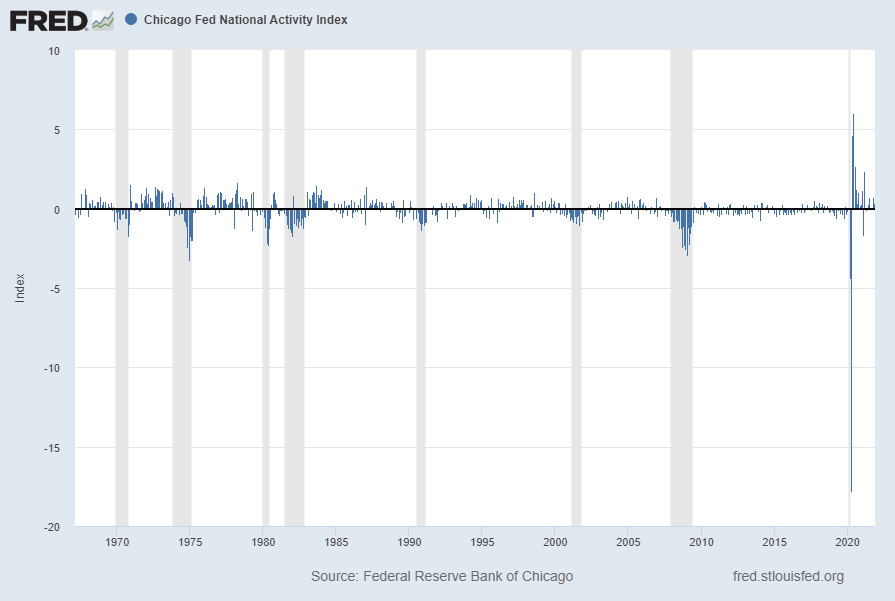
The following is an update of various indicators that are supposed to predict and/or depict economic activity. These indicators have been discussed in previous blog posts:
source: Federal Reserve Bank of Chicago, Chicago Fed National Activity Index [CFNAI], retrieved from FRED, Federal Reserve Bank of St. Louis, December 22, 2021; https://fred.stlouisfed.org/series/CFNAI
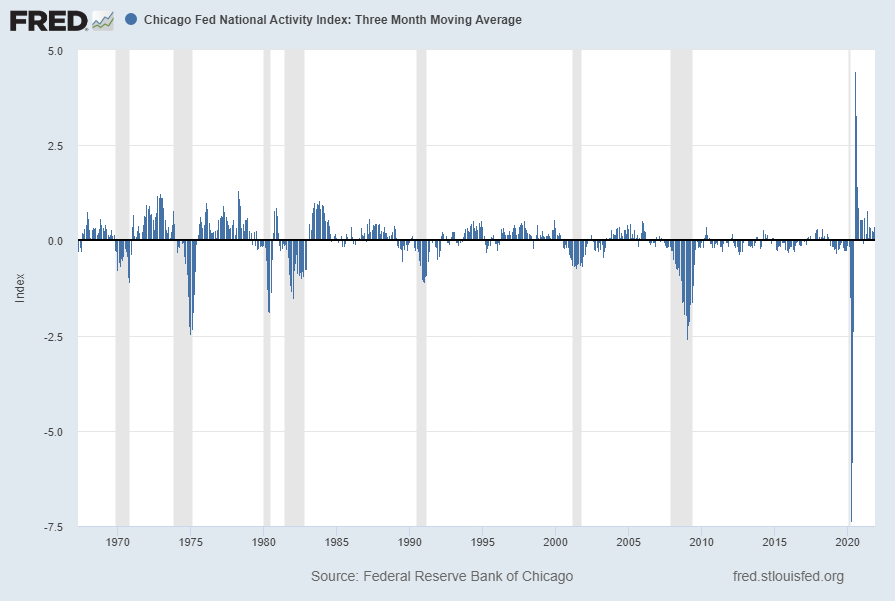
The CFNAI-MA3, with a current reading of .37:
source: Federal Reserve Bank of Chicago, Chicago Fed National Activity Index: Three Month Moving Average [CFNAIMA3], retrieved from FRED, Federal Reserve Bank of St. Louis, December 22, 2021; https://fred.stlouisfed.org/series/CFNAIMA3
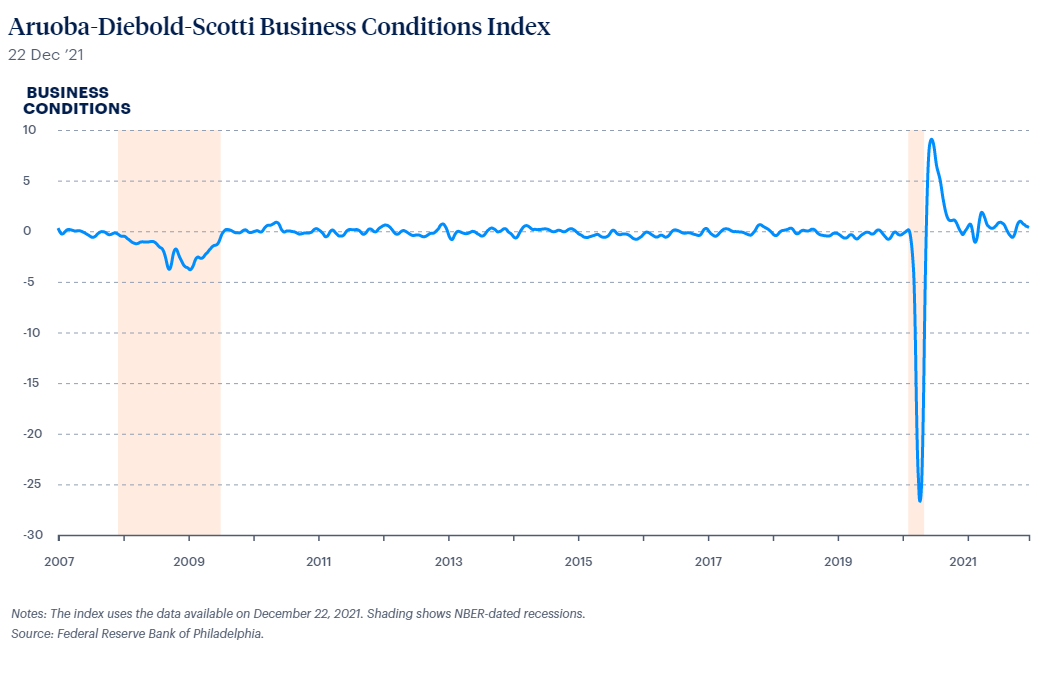
The ADS Index as of December 22, 2021, reflecting data from January 3, 2007 through December 11, 2021, with last value .373341:
–
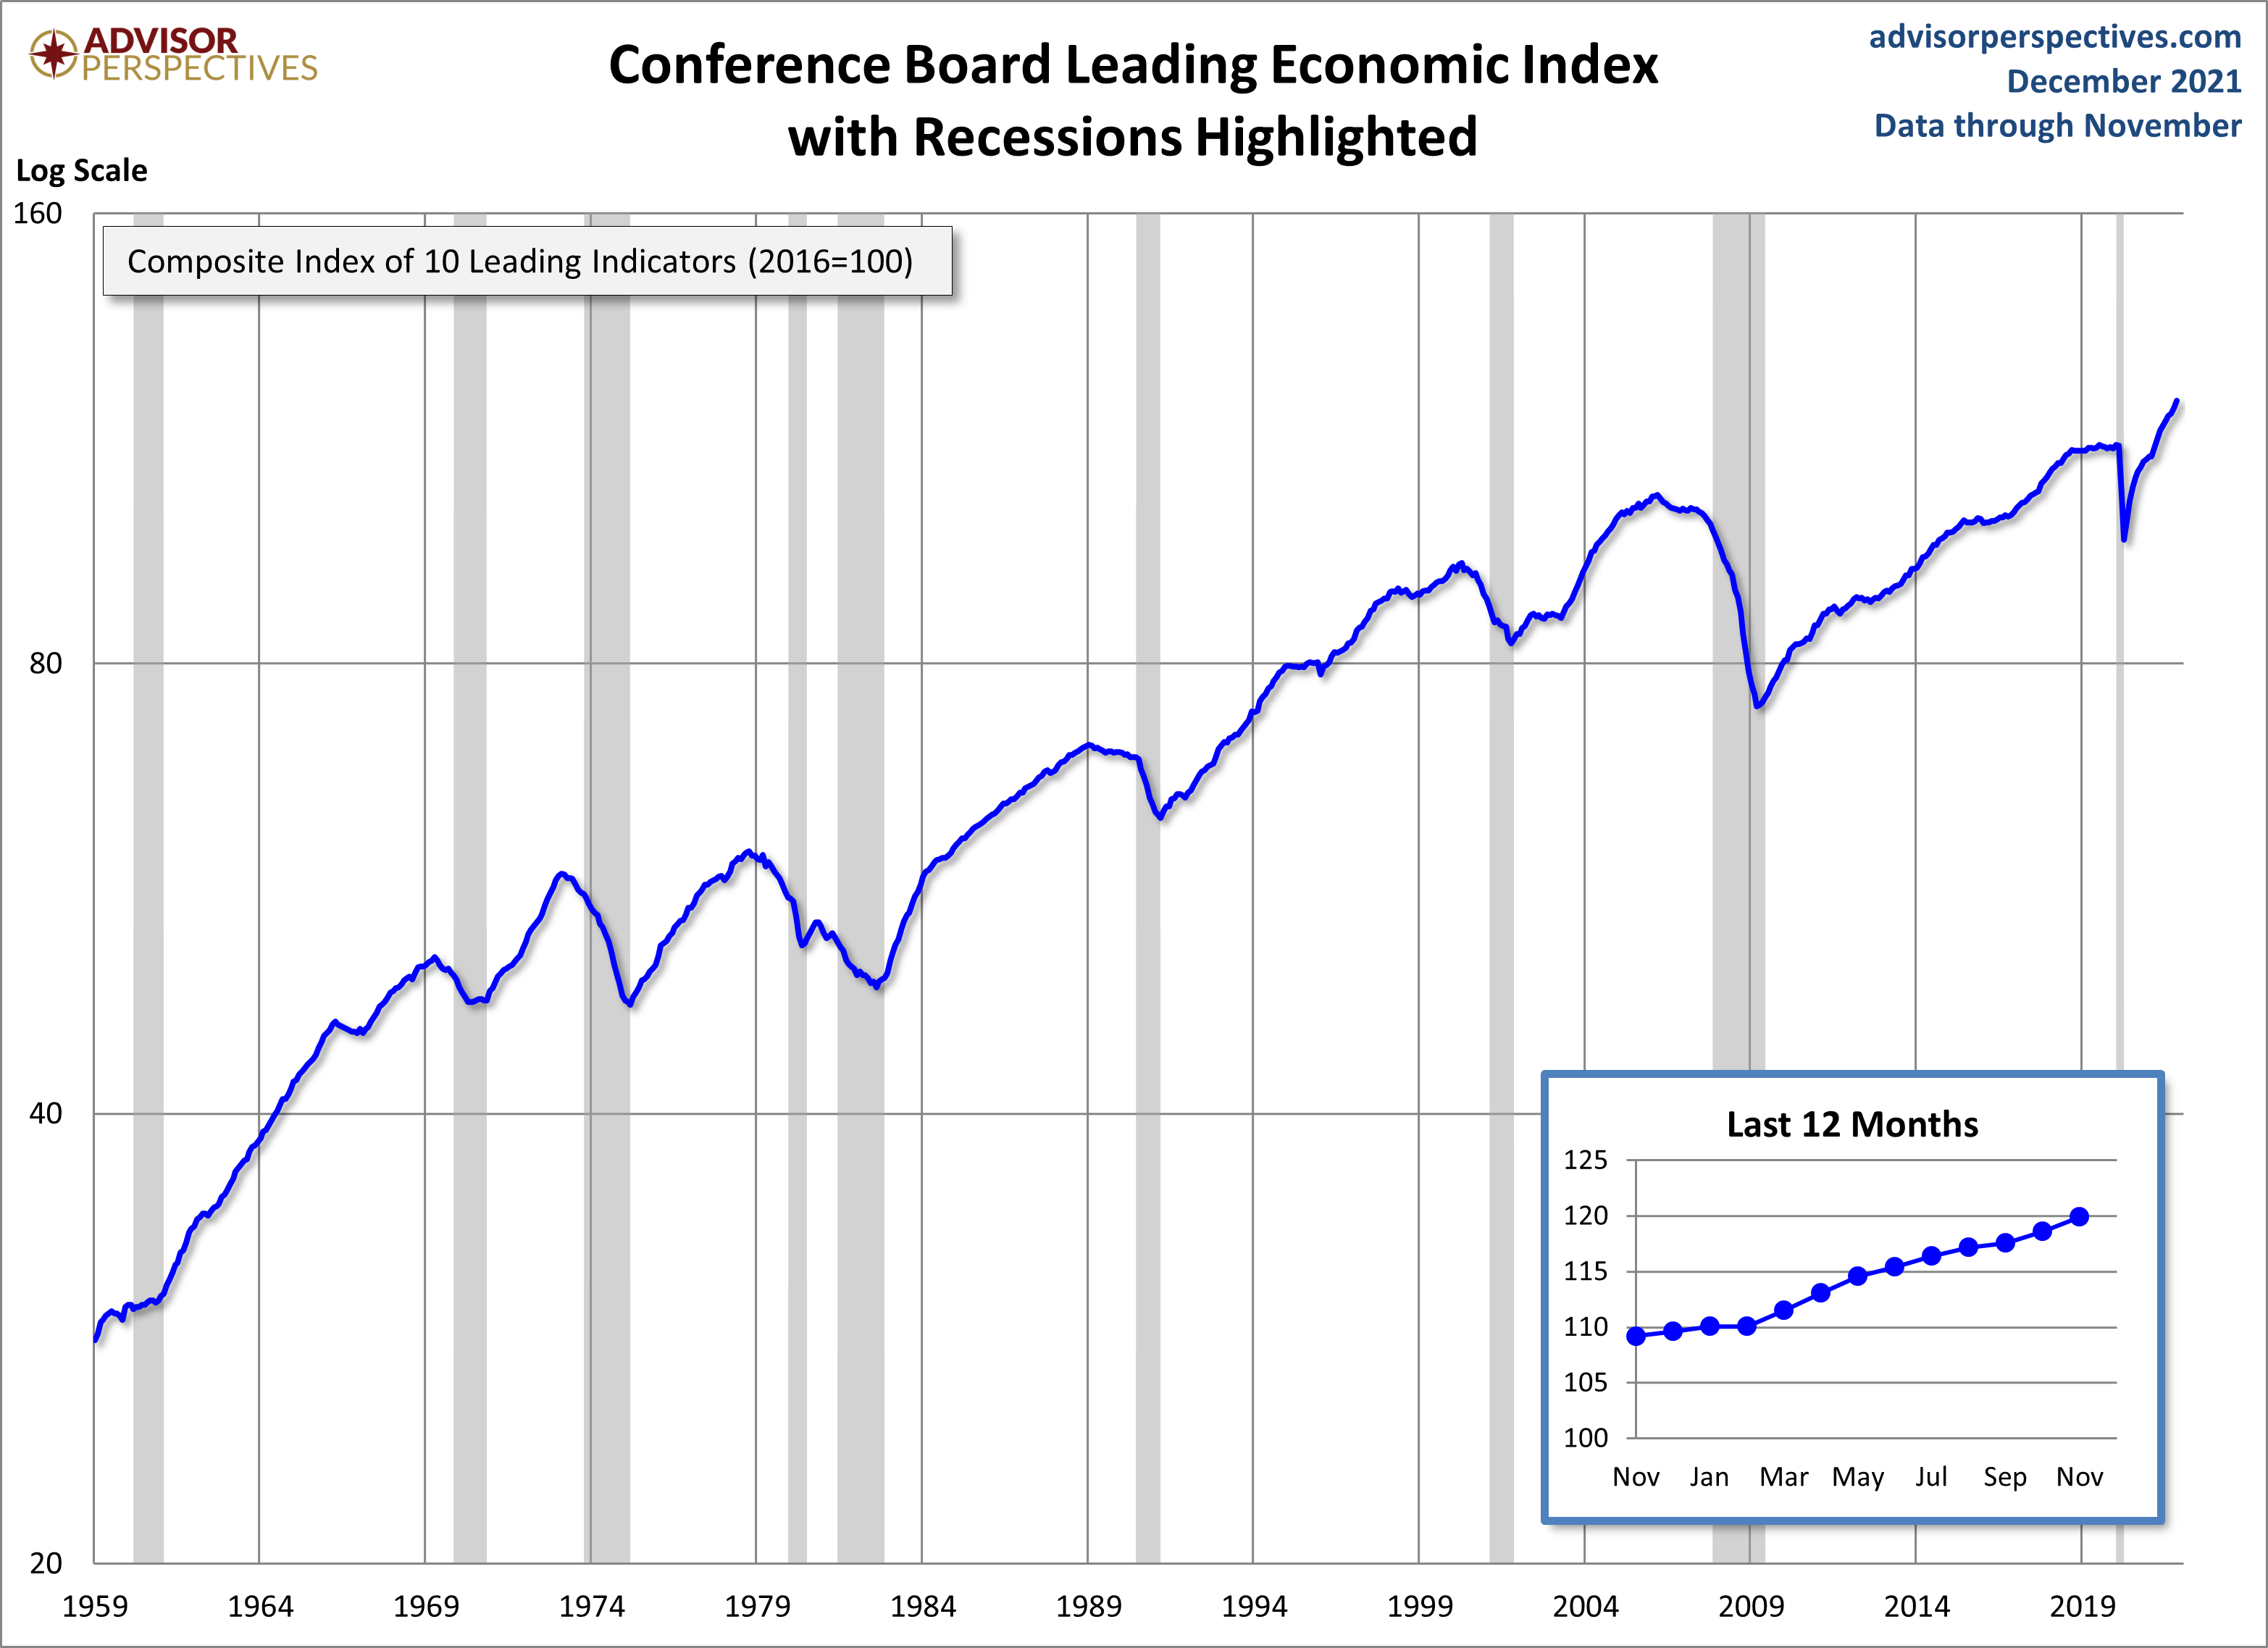
The Conference Board Leading Economic Index (LEI), Coincident Economic Index (CEI), and Lagging Economic Index (LAG):
As per the December 20, 2021 Conference Board press release, titled “The Conference Board Leading Economic Index (LEI) for the U.S. Increased in November” the LEI was at 119.9 in November, the CEI was at 106.7 in November, and the LAG was at 107.2 in November.
An excerpt from the release:
“The U.S. LEI rose sharply again in November, suggesting the current economic expansion will continue into the first half of 2022,” said Ataman Ozyildirim, Senior Director of Economic Research at The Conference Board. “Inflation and continuing supply chain disruptions, as well as a resurgence of COVID-19, pose risks to GDP growth in 2022. Still, the economic impact of these risks may be contained. The Conference Board forecasts real GDP growth to strengthen in Q4 2021 to about 6.5 percent (annualized rate), before moderating to a still healthy rate of 2.2 percent in Q1 2022.”
I post various indicators and indices because I believe they should be carefully monitored. However, as those familiar with this site are aware, I do not necessarily agree with what they depict or imply.
_____
The Special Note summarizes my overall thoughts about our economic situation