Friday, May 29, 2020

Consumer Confidence Surveys – As Of May 29, 2020

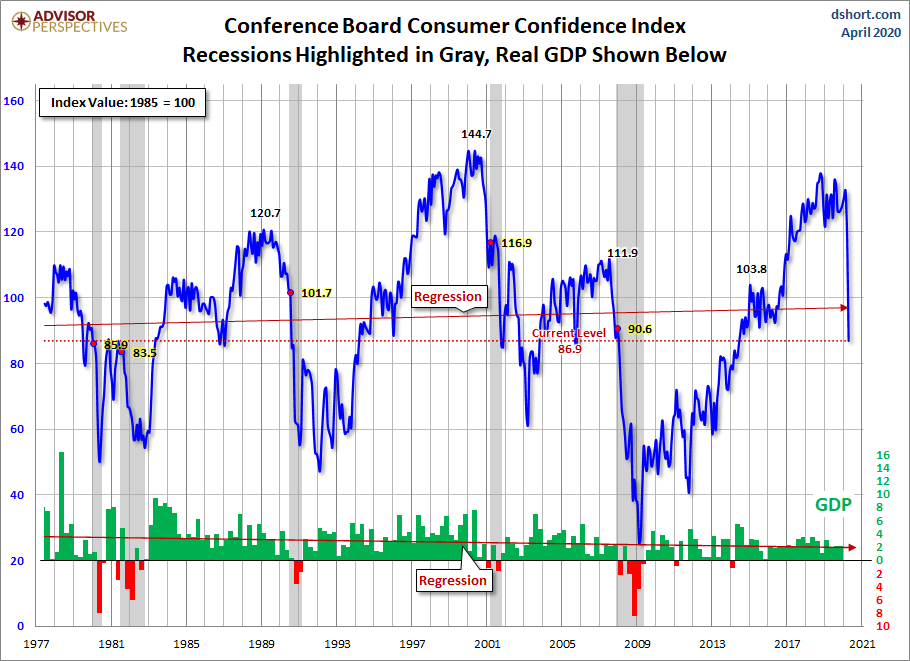
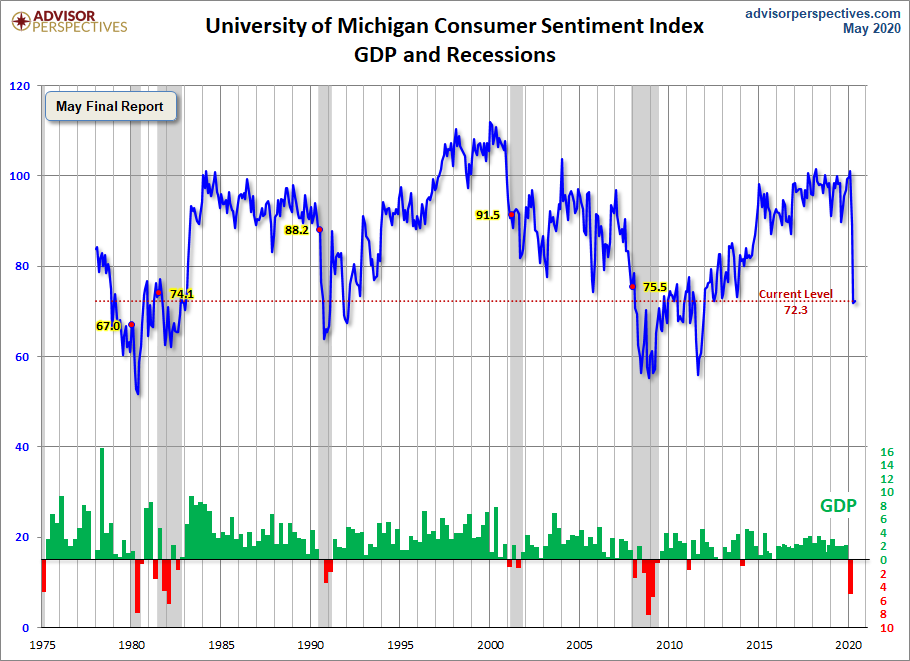
Advisor Perspectives had a post of May 29, 2020 (“Michigan Consumer Sentiment: May Final Mostly Unchanged“) that displays the latest Conference Board Consumer Confidence and Thomson/Reuters University of Michigan Consumer Sentiment Index charts.  They are presented below:
(click on charts to enlarge images)
Conference Board Consumer Confidence
University of Michigan Consumer Sentiment Index
There are a few aspects of the above charts that I find highly noteworthy.  Of course, until the sudden upswing in 2014, the continued subdued absolute levels of these two surveys was disconcerting.
Also, I find the “behavior” of these readings to be quite disparate as compared to the other post-recession periods, as shown in the charts between the gray shaded areas (the gray areas denote recessions as defined by the NBER.)
While I don’t believe that confidence surveys should be overemphasized, I find these readings to be notable, especially in light of a variety of other highly disconcerting measures highlighted throughout this site.
_____
The Special Note summarizes my overall thoughts about our economic situation
SPX at 3015.51 as this post is written
Thursday, May 28, 2020

Corporate Profits As A Percentage Of GDP

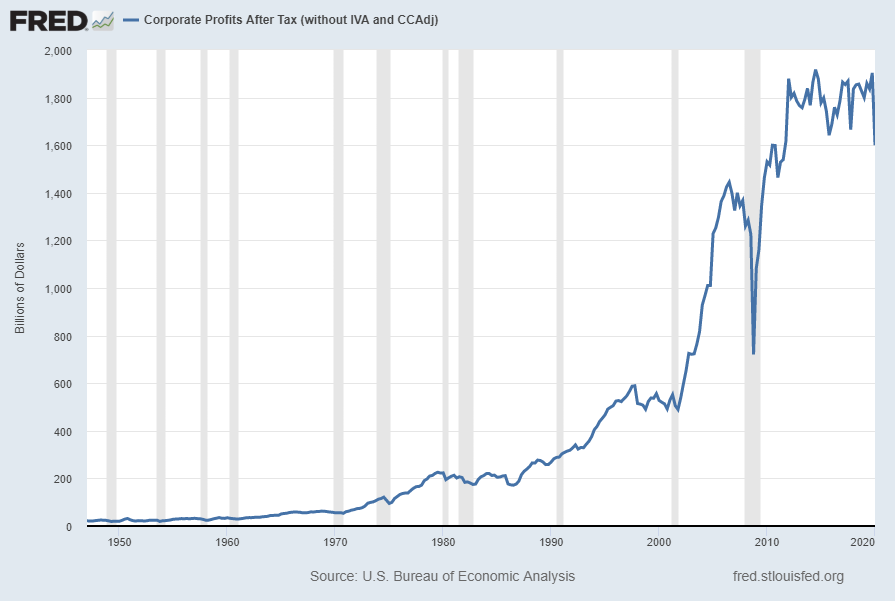
In the last post (“1st Quarter 2020 Corporate Profits“) I displayed, for reference purposes, a long-term chart depicting Corporate Profits After Tax.
There are many ways to view this measure, both on an absolute as well as relative basis.
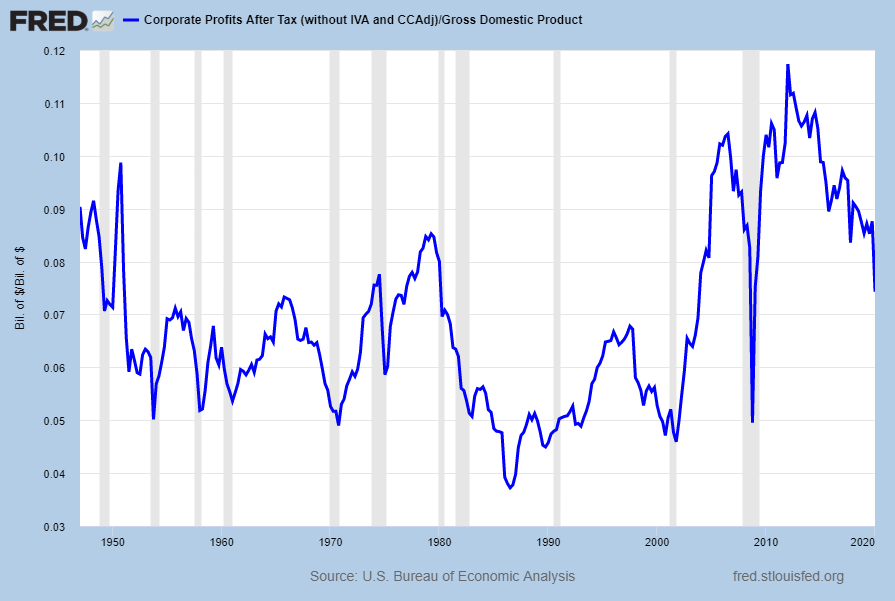
One relative measure is viewing Corporate Profits as a Percentage of GDP.  I feel that this metric is important for a variety of reasons.  As well, the measure is important to a variety of parties, including investors, businesses, and government policy makers.
As one can see from the long-term chart below (updated through the first quarter), (After Tax) Corporate Profits as a Percentage of GDP is still at levels that can be seen as historically high.  While there are many reasons as to why this is so, from a going-forward standpoint I think it is important to recognize both that such a notable condition exists, as well as contemplate and/or plan for such factors and conditions that would come about if (and in my opinion “when”) a more historically “normal” ratio of Corporate Profits as a Percentage of GDP occurs.  This topic can be very complex in nature, and depends upon myriad factors.  In my opinion it deserves far greater recognition.
(click on chart to enlarge image)
Corporate Profits As A Percentage Of GDP
Data Source: FRED, Federal Reserve Economic Data, Federal Reserve Bank of St. Louis; accessed May 28, 2020
_____
The Special Note summarizes my overall thoughts about our economic situation
SPX at 3053.44 as this post is written
1st Quarter 2020 Corporate Profits

Today’s (May 28, 2020) GDP release (Q1 2020, Second Estimate) was accompanied by the Bureau of Economic Analysis (BEA) Corporate Profits report (preliminary estimate) for the 1st Quarter.
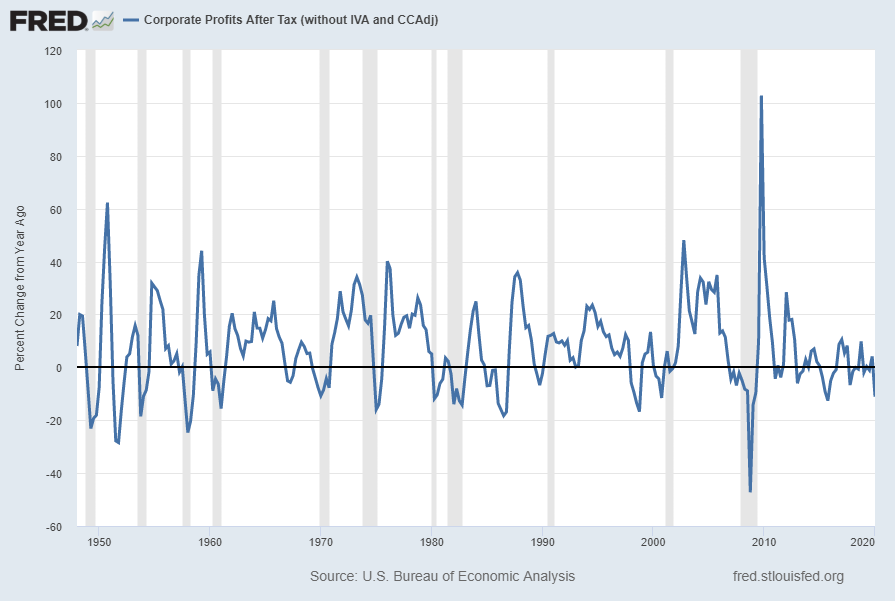
Of course, there are many ways to adjust and depict overall Corporate Profits.  For reference purposes, here is a chart from the St. Louis Federal Reserve (FRED) showing the Corporate Profits After Tax (without IVA and CCAdj) (last updated May 28, 2020, with a value of $1600.139 Billion SAAR):


Corporate Profits After Tax (without IVA and CCAdj)

Here is the Corporate Profits After Tax measure shown on a Percentage Change from a Year Ago perspective:


Corporate Profits After Tax Percent Change From Year Ago

Data Source: FRED, Federal Reserve Economic Data, Federal Reserve Bank of St. Louis: Corporate Profits After Tax [CP]; U.S. Department of Commerce: Bureau of Economic Analysis; accessed May 28, 2020; https://research.stlouisfed.org/fred2/series/CP
_________
I post various indicators and indices because I believe they should be carefully monitored.  However, as those familiar with this site are aware, I do not necessarily agree with what they depict or imply.
_____
The Special Note summarizes my overall thoughts about our economic situation
SPX at 3051.14 as this post is written

Durable Goods New Orders – Long-Term Charts Through April 2020

Many people place emphasis on Durable Goods New Orders as a prominent economic indicator and/or leading economic indicator.
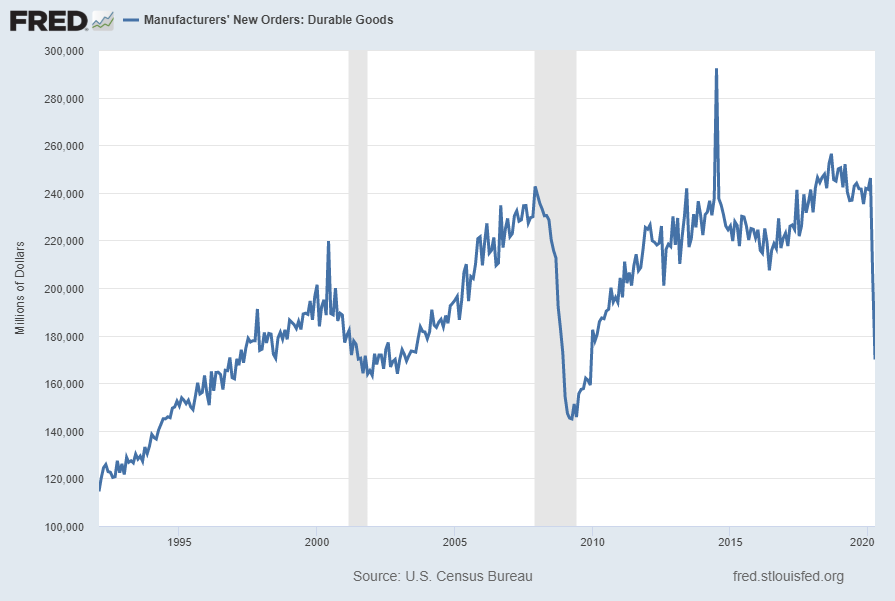
For reference, below are two charts depicting this measure.
First, from the St. Louis Fed site (FRED), a chart through April 2020, updated on May 28, 2020. This value is $169,966 ($ Millions):
(click on charts to enlarge images)
Durable Goods New Orders
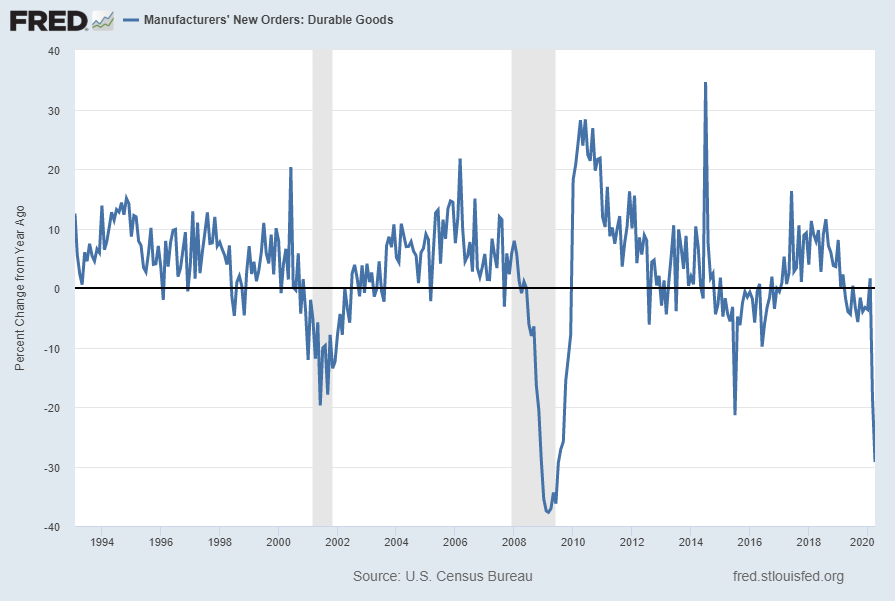
Second, here is the chart depicting this measure on a “Percentage Change from a Year Ago” basis, with a last value of -29.3%:
DGORDER Percent Change From Year Ago
Data Source: FRED, Federal Reserve Economic Data, Federal Reserve Bank of St. Louis: Manufacturers’ New Orders:  Durable Goods [DGORDER]; U.S. Department of Commerce: Census Bureau; accessed May 28, 2020;
http://research.stlouisfed.org/fred2/series/DGORDER
_________
I post various indicators and indices because I believe they should be carefully monitored.  However, as those familiar with this site are aware, I do not necessarily agree with what they depict or imply.
_____
The Special Note summarizes my overall thoughts about our economic situation
SPX at 3046.61 as this post is written

Wednesday, May 27, 2020

House Prices Reference Chart

As a reference for long-term house price index trends, below is a chart, updated with the most current data (through March) from the CalculatedRisk blog post of May 26, 2020 titled “Case-Shiller : National House Price Index increased 4.4% in March“:
Case Shiller indexes
_________
I post various indicators and indices because I believe they should be carefully monitored.  However, as those familiar with this site are aware, I do not necessarily agree with what they depict or imply.
_____
The Special Note summarizes my overall thoughts about our economic situation
SPX at 2991.77 as this post is written

Tuesday, May 26, 2020

Updates Of Economic Indicators May 2020

The following is an update of various indicators that are supposed to predict and/or depict economic activity. These indicators have been discussed in previous blog posts:
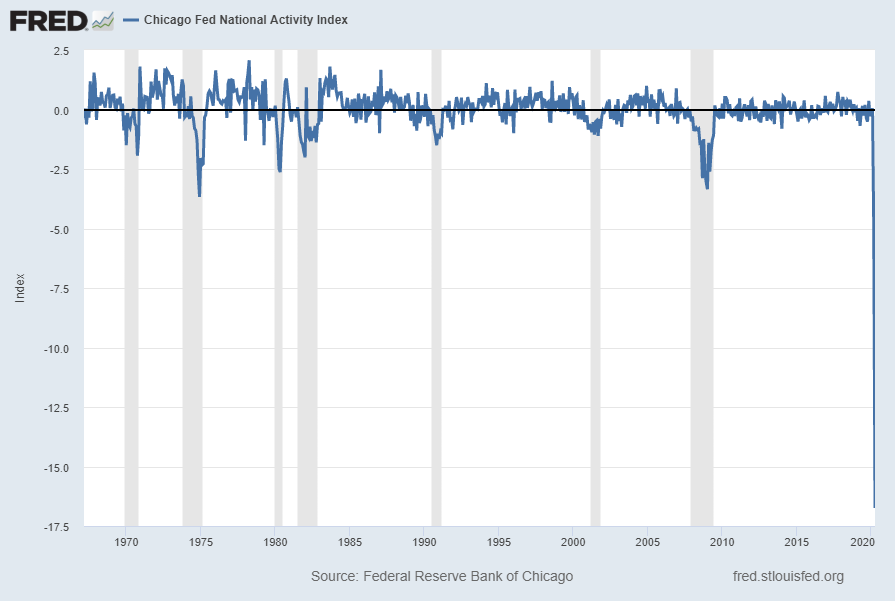
The CFNAI, with current reading of -16.74:
CFNAI chart
source:  Federal Reserve Bank of Chicago, Chicago Fed National Activity Index [CFNAI], retrieved from FRED, Federal Reserve Bank of St. Louis, May 26, 2020;
https://fred.stlouisfed.org/series/CFNAI
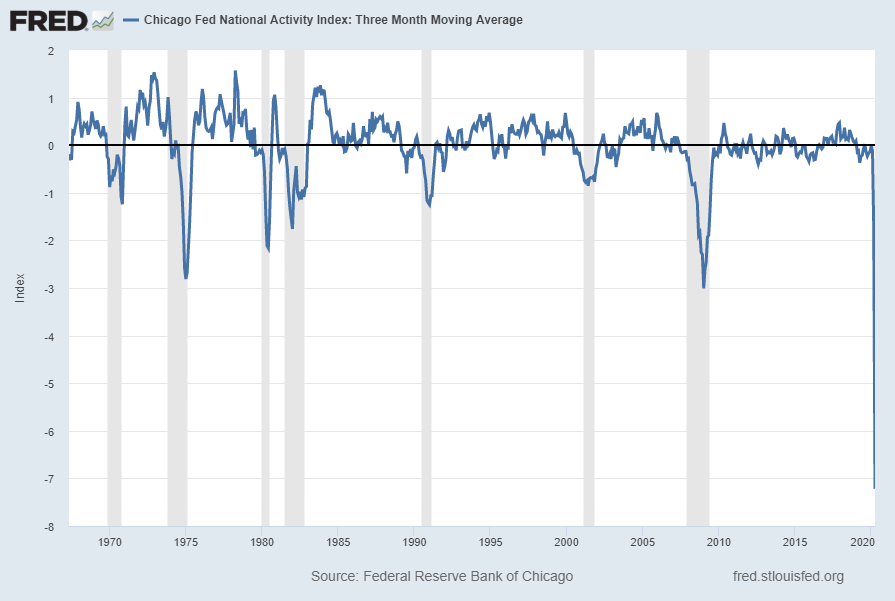
The CFNAI-MA3, with current reading of -7.72:
CFNAIMA3 chart
source:  Federal Reserve Bank of Chicago, Chicago Fed National Activity Index: Three Month Moving Average [CFNAIMA3], retrieved from FRED, Federal Reserve Bank of St. Louis, May 26, 2020;
https://fred.stlouisfed.org/series/CFNAIMA3
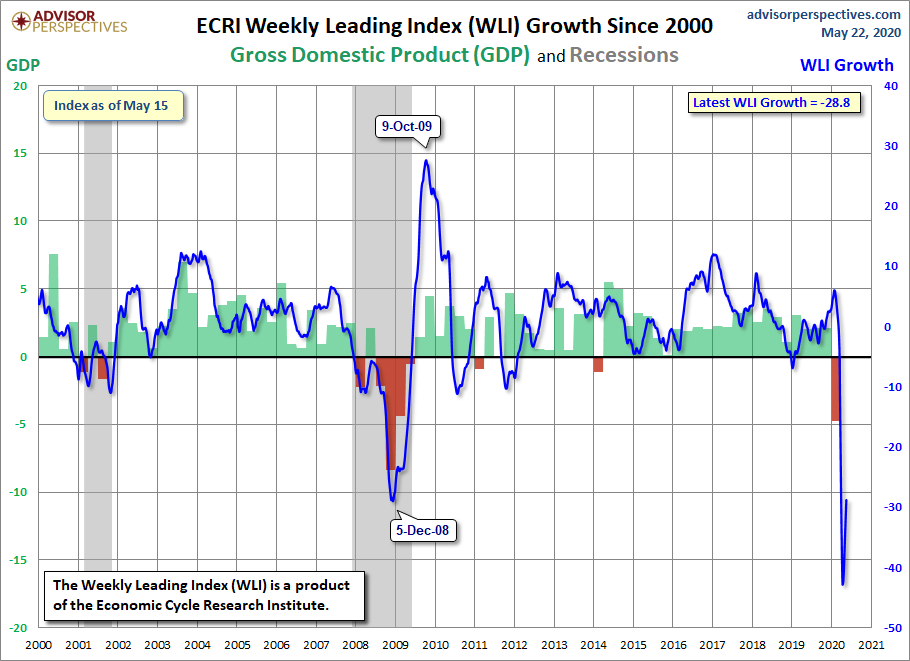
As of May 22, 2020 (incorporating data through May 15, 2020) the WLI was at 122.7 and the WLI, Gr. was at -28.8%.
A chart of the WLI,Gr., from the Advisor Perspectives’ ECRI update post of May 22, 2020:
ECRI WLI,Gr.
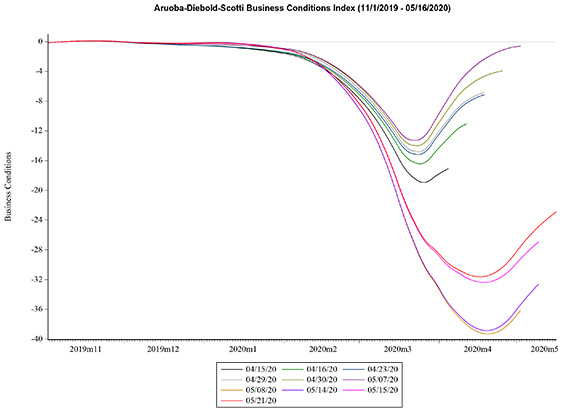
Below is the latest chart, depicting the ADS Index from November 1, 2019 through May 16, 2020:
ADS Index
The Conference Board Leading (LEI), Coincident (CEI) Economic Indexes, and Lagging Economic Indicator (LAG):
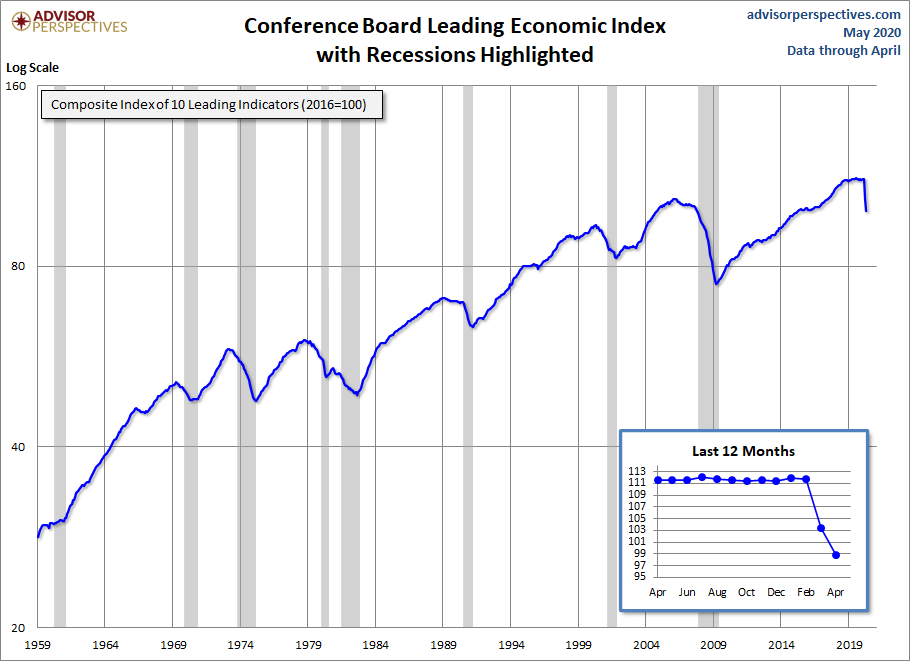
As per the May 21, 2020 Conference Board press release, titled “The Conference Board Leading Economic Index (LEI) for the U.S. Declined in April” the LEI was at 98.8, the CEI was at 96.6, and the LAG was 115.3 in April.
An excerpt from the release:
“In April, the US LEI continued on a downward trajectory, after posting the largest decline in its 60-year history in March,” said Ataman Ozyildirim, Senior Director of Economic Research at The Conference Board. “The erosion has been very widespread, except for stock prices and the interest rate spread which partially reflect the rapid and large response of the Federal Reserve to offset the pandemic’s impact and support financial conditions. The sharp declines in the LEI and CEI suggest that the US economy is now in recession territory.”
“Business conditions may recover for some sectors and industries over the next few months,” added Bart van Ark, Chief Economist at The Conference Board, “But, the breadth and depth of the decline in the LEI suggests that an imminent re-opening of some sectors does not imply a fast rebound for the economy at large.”
Here is a chart of the LEI from the Advisor Perspectives’ Conference Board Leading Economic Index update of May 21, 2020:
Conference Board LEI
_________
I post various indicators and indices because I believe they should be carefully monitored.  However, as those familiar with this site are aware, I do not necessarily agree with what they depict or imply.
_____
The Special Note summarizes my overall thoughts about our economic situation
SPX at 3011.51 as this post is written

The U.S. Economic Situation – May 26, 2020 Update

Perhaps the main reason that I write of our economic situation is that I continue to believe, based upon various analyses, that our economic situation is in many ways misunderstood.  While no one likes to contemplate a future rife with economic adversity, current and future economic problems must be properly recognized and rectified if high-quality, sustainable long-term economic vitality is to be realized.
There are an array of indications and other “warning signs” – many readily apparent – that current economic activity and financial market performance is accompanied by exceedingly perilous dynamics.
I have written extensively about this peril, including in the following:
Building Financial Danger” (ongoing updates)
My analyses continues to indicate that the growing level of financial danger will lead to the next stock market crash that will also involve (as seen in 2008) various other markets as well.  Key attributes of this next crash is its outsized magnitude (when viewed from an ultra-long term historical perspective) and the resulting economic impact.  This next financial crash is of tremendous concern, as my analyses indicate it will lead to a Super Depression – i.e. an economy characterized by deeply embedded, highly complex, and difficult-to-solve problems.
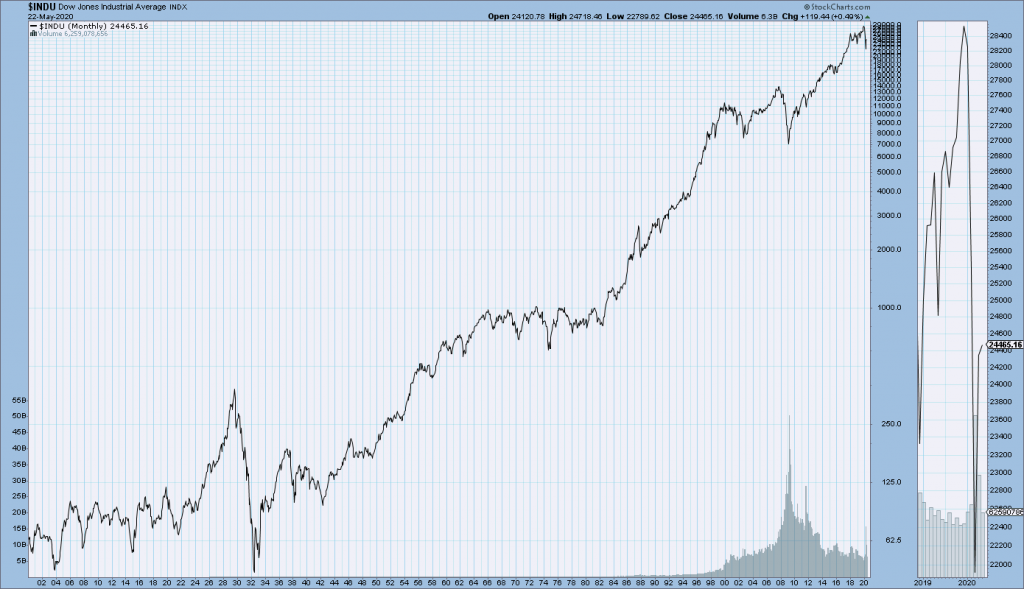
For long-term reference purposes, here is a chart of the Dow Jones Industrial Average since 1900, depicted on a monthly basis using a LOG scale (updated through May 22, 2020, with a last value of 24465.16):
(click on chart to enlarge image)(chart courtesy of StockCharts.com)
DJIA chart since 1900
_____
The Special Note summarizes my overall thoughts about our economic situation
SPX at 2955.45 as this post is written

Thursday, May 21, 2020

Deloitte “CFO Signals” Report Q2 2020 – Notable Aspects

Recently Deloitte released their “CFO Signals” “High-Level Summary” report for the 2nd Quarter of 2020.
As seen in page 3 of the report, there were 147 survey respondents.  As stated:
“Each quarter (since 2Q10), CFO Signals has tracked the thinking and actions of CFOs representing many of North America’s largest and most influential companies.
All respondents are CFOs from the US, Canada, and Mexico, and the vast majority are from companies with more than $1 billion in annual revenue. For a summary of this quarter’s response demographics, please see the sidebars and charts on this page. For other information about participation and methodology, please contact nacfosurvey@deloitte.com.”
Here are some of the excerpts that I found notable:
from page 5:

Findings at a glance

Perceptions

How do you regard the status of the North American, European, and Chinese economies? Perceptions of North America fell drastically, with just 1% of CFOs rating current conditions as good (80% last quarter), but 58% expecting better conditions in a year (up from 35%). Europe’s numbers were also down sharply, coming in at 1% and 33%. Perceptions of China’s current conditions held at 9%, and expectations for a year from now rose sharply to 51%. Page 7.
What is your perception of the capital markets? Sixty-three percent of CFOs say debt financing is attractive (down from 90%) following major drawdowns on credit facilities. Equity financing is considered attractive by 25% (down from 46%) of public company CFOs and 13% (down from 37%) of private company CFOs. Fifty-five percent still say US equity markets are overvalued (down from 83%) despite very sharp market declines. Page 8.

Sentiment

Compared to three months ago, how do you feel about the financial prospects for your company? The net optimism index fell drastically from last quarter’s +24 to an historic survey low of -54. Just 11% of CFOs expressed rising optimism (38% last quarter), and 65% (a historic survey high) expressed declining optimism (14% last quarter). Page 9.

Expectations

What is your company’s business focus for the next year? Companies shifted toward their first collective cost reduction (over revenue growth) focus in survey history, and they doubled down on current geographies (over new ones) and organic growth. Page 10.
How will your key operating metrics change over the next 12 months? YOY growth expectations fell drastically, with each metric hitting a new low and turning negative for the first time in survey history. Revenue growth slid from 3.9% to -8.6%; earnings growth fell from 6.0% to -18.7%. Capital spending slid sharply from an already-low 2.3% to -12.3%. Domestic hiring fell from 1.2% to -6.0%, and dividend growth slid from 3.7% to -4.8%. Page 11.
from page 10:

Expectations

Business focus for next year

Companies shifted toward their first collective cost reduction (over revenue growth) focus in survey history, and they doubled down on current geographies (over new ones) and organic growth.
For the first time in survey history, CFOs indicated a net focus on cost reduction over revenue growth (43% vs. 32%, for a net of -11%). The bias toward investing cash over returning it accelerated (62% vs. 8%, for a net of +54%).
The focus on current offerings over new ones continued to rise (47% vs. 31%, for a net of -16%), with the highest current offering biases in the last four years. The recent focus on current geographies over new ones accelerated markedly (86% vs. 4%, for a net of -82%), with by far the highest focus on current geographies in seven years.
The bias toward organic over inorganic growth rose to its highest level in seven years (70% vs. 7%, for a net of -63%).
Please see the full report for industry-specific charts.
from page 11:

Expectations

Growth in key metrics, year-over-year

All growth expectations declined drastically, and turned negative for the first time in survey history.
Revenue growth fell sharply from 3.9% to -8.6%—negative for the first time, and by far the lowest in survey history. The US, Canada, and Mexico all hit new lows by wide margins. Healthcare/Pharma and Technology are positive  and lead from an industry standpoint; Retail/ Wholesale and Services trail by a wide margin.
Earnings growth fell drastically from 6.0% to -18.7%—a new low by a wide margin, and a very sharp decline even among the other metrics’ strong declines this quarter. The US, Canada, and Mexico all hit new lows by wide margins. Only Technology is above zero; Retail/Wholesale and Services are by far the lowest.
Capital spending growth slid sharply from 2.3% to -12.3%, by far a new survey low, and the first-ever negative reading. The US and Mexico hit new lows by wide margins; Canada was better, but still negative. Only Healthcare/Pharma is above zero; Retail/Wholesale is lowest by a wide margin.
Domestic hiring growth fell markedly from 1.2% to -6.0%, another new survey low. The US and Mexico hit new lows by wide margins; Canada was the only country with positive growth. All industries are negative; Retail/Wholesale is lowest by far.
Dividend growth slid from 3.7% to -4.8%, the lowest-ever level and first-ever negative reading.
Please see the full report for industry-specific charts.
Among the various charts and graphics in the report are graphics depicting trends in “Own Company Optimism” on page 9 and “Economic Optimism” found on page 7.
_____
I post various business and economic surveys because I believe they should be carefully monitored.  However, as those familiar with this site are aware, I do not necessarily agree with many of the consensus estimates and much of the commentary in these surveys.
_____
The Special Note summarizes my overall thoughts about our economic situation
SPX at 2969.62 as this post is written

Wednesday, May 20, 2020

Chicago Fed National Financial Conditions Index (NFCI)

The St. Louis Fed’s Financial Stress Index (STLFSI2) is one index that is supposed to measure stress in the financial system.  Its reading as of the May 14, 2020 update (reflecting data through May 8, 2020) is .6123.
Of course, there are a variety of other measures and indices that are supposed to measure financial stress and other related issues, both from the Federal Reserve as well as from private sources.
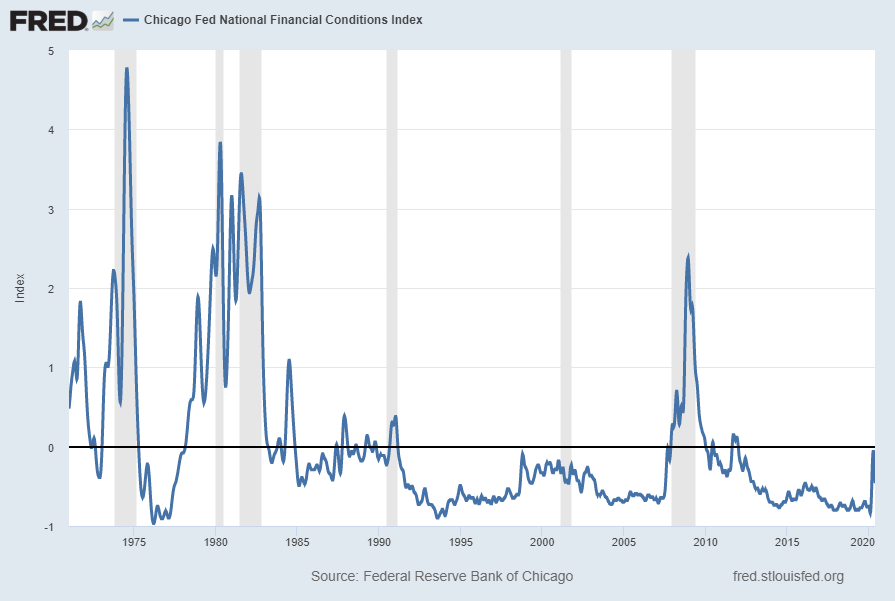
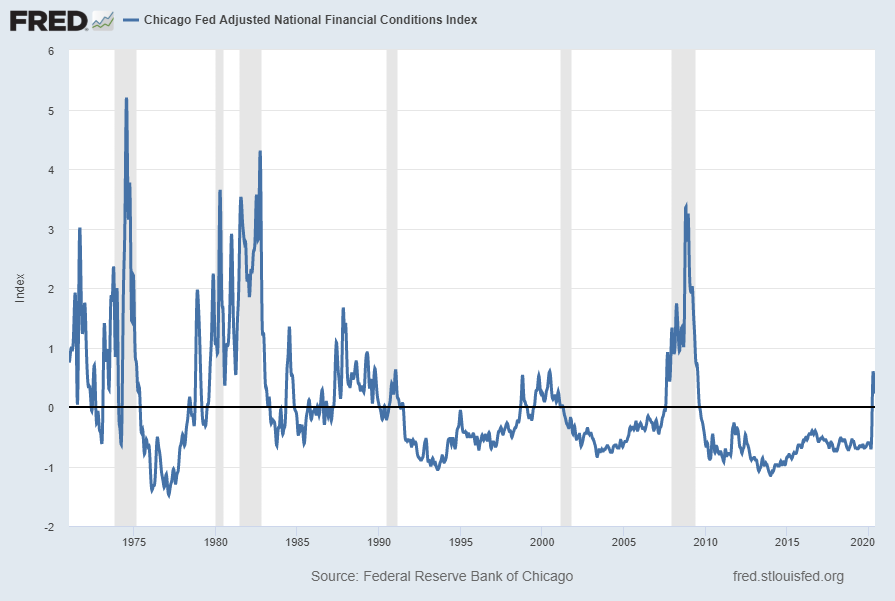
Two other indices that I regularly monitor include the Chicago Fed National Financial Conditions Index (NFCI) as well as the Chicago Fed Adjusted National Financial Conditions Index (ANFCI).
Here are summary descriptions of each, as seen in FRED:
The National Financial Conditions Index (NFCI) measures risk, liquidity and leverage in money markets and debt and equity markets as well as in the traditional and “shadow” banking systems. Positive values of the NFCI indicate financial conditions that are tighter than average, while negative values indicate financial conditions that are looser than average.
The adjusted NFCI (ANFCI). This index isolates a component of financial conditions uncorrelated with economic conditions to provide an update on how financial conditions compare with current economic conditions.
For further information, please visit the Federal Reserve Bank of Chicago’s web site:
Below are the most recently updated charts of the NFCI and ANFCI, respectively.
The NFCI chart below was last updated on May 20, 2020 incorporating data from January 8, 1971 through May 15, 2020, on a weekly basis.  The May 15 value is -.46:
NFCI
Data Source: FRED, Federal Reserve Economic Data, Federal Reserve Bank of St. Louis; accessed May 20, 2020: 
http://research.stlouisfed.org/fred2/series/NFCI
The ANFCI chart below was last updated on May 20, 2020 incorporating data from January 8, 1971 through May 15, 2020, on a weekly basis.  The May 15 value is .25:
ANFCI
Data Source: FRED, Federal Reserve Economic Data, Federal Reserve Bank of St. Louis; accessed May 20, 2020: 
http://research.stlouisfed.org/fred2/series/ANFCI
_________
I post various indicators and indices because I believe they should be carefully monitored.  However, as those familiar with this site are aware, I do not necessarily agree with what they depict or imply.
_____
The Special Note summarizes my overall thoughts about our economic situation
SPX at 2971.61 as this post is written

Tuesday, May 19, 2020

Jerome Powell’s May 17, 2020 “60 Minutes” Interview – Notable Excerpts

Jerome Powell gave an interview to “60 Minutes”, which was broadcast Sunday (May 17, 2020) night. The video of the Interview and transcript can be seen at “Federal Reserve Chairman Jerome Powell On The Coronavirus-Ravaged Economy.”
Below are Jerome Powell’s comments I found most notable in the order they appear in the transcript. (Please note that in general I don’t necessarily agree with his comments, and in many cases disagree with them):
SCOTT PELLEY, CBS NEWS / 60 MINUTES: There’s only one question that anyone wants an answer to, and that is: when does the economy recover?
JEROME POWELL, CHAIRMAN OF THE FEDERAL RESERVE: It’s a good question. And very difficult to answer because it really does depend, to a large degree, on what happens with the coronavirus. The sooner we get the virus under control, the sooner businesses can reopen. And more important than that, the sooner people will become confident that they can resume certain kinds of activity. Going out, going to restaurants, traveling, flying on planes, those sorts of things. So that’s really going to tell us when the economy can recover.
PELLEY: Many states are beginning to reopen their economies. Do you consider the virus under control?
POWELL: Well, I think we’re going to see what happens with that. People will need to take certain measures to protect themselves. Wash their hands, wear masks in certain situations and things like that. And I do think that over the next couple of months, you’re going to be seeing the beginnings of the recovery, as people, as businesses reopen and people go back to work.
The big thing we have to avoid during that period is a second wave of the virus. But if we do, then the economy can continue to recover. We’ll see GDP move back up after the very low numbers of this quarter. We’ll see unemployment come down. But I think though it’ll be a while before we really feel, well recovered.
PELLEY: Well, that is the question that everyone wants an answer to: “What is a while?” Can there be a recovery without a reasonably effective vaccine?
POWELL: Well, I think you’ll see, again assuming there’s not a second wave of the coronavirus, I think you’ll see the economy recover steadily through the second half of this year. I do think that people will be careful about resuming their typical spending behavior. So certain parts of the economy will recover much more slowly. 
Travel, entertainment, things that we do that involve being around lots of other people.
So for the economy to fully recover, people will have to be fully confident. And that may have to await the arrival of a vaccine. But in any case, the economy can continue to, can start getting better fairly soon.
also:
PELLEY: What economic reality do the American people need to be prepared for?
POWELL: Well, I would take a more optimistic cut at that, if I could, and that is: this is a time of great suffering and difficulty. And it’s come on us so quickly and with such force, that you really can’t put into words the pain people are feeling and the uncertainty they’re realizing. And it’s going to take a while for us to get back.
But I would just say this. In the long run, and even in the medium run, you wouldn’t want to bet against the American economy. This economy will recover. And that means people will go back to work. Unemployment will get back down. We’ll get through this. It may take a while. It may take a period of time. It could stretch through the end of next year. We really don’t know. We hope that it will be shorter than that, but no one really knows. What we can do is the part of it that we can control — is to be careful as businesses go back to work. And each of us individually and as a group, you know, take those measures that will protect ourselves and each other from the further spread of the virus.
PELLEY: As this period of time grows longer, what begins to happen to the economy?
POWELL: There’s a real risk that if people are out of work for long periods of time, that their skills atrophy a little bit and they lose contact with the workforce. This is something that shows up in the data — that longer and deeper recessions tend to leave behind damage to people’s careers. And that weighs on the economy going forward.

You could say the same thing about businesses. The small and medium size businesses that are so important to this country, if they have to go through a wave of avoidable insolvencies,  you’ve lost something there that’s more than just a few businesses.
You know, it’s really the job creation machine. And if that happens, it will take some time to recover from it. 
I think the good news is that we have policies that can go some way toward minimizing those effects. And that’s by keeping people and businesses out of insolvency just for maybe three or six more months while the health authorities do what they can do. We can buy time with that. And so I think that kind of support may be appropriate.
PELLEY: Some of the best economic analysts in the world report to you. And I wonder what they’re telling you the height of unemployment will be.
POWELL: Again, nobody knows. I would say this though. It seems as a reasonable base case that there will be more layoffs probably this month and next month. And as we sit here, 20 million people have lost their jobs in a period of really two months. And it’s heartbreaking because where we were just two months ago was we had the lowest unemployment in 50 years, the lowest African-American unemployment ever since we began measuring it.
We had low- and moderate-income communities telling us that this was the best labor market, that you can finally see the benefits of what a tight labor market actually means. More opportunity. And it looked like we would continue to see that going forward for some time and further and further benefits.
Instead, we have this situation where 20 million people have lost their jobs. And my sense is that it’s likely that we’ll have a couple more months of net job losses. Then, assuming that the economy does begin to reopen and we do that successfully, you’ll see people going back to work.
The good news is that the 20 million people who’ve been laid off overwhelming report themselves as having been laid off temporarily. They’re considered temporarily unemployed. And that’s because they expect to go back to their old job.
So if those businesses can reopen and if we can do it in a way that doesn’t create further problems with the virus, then people can go back to work. So I would say the peak unemployment might be in the next couple of months. And then you might see it coming down over the second half of the year.
also:
PELLEY: 25% is the estimated height of unemployment during the Great Depression. Do you think history will look back on this time and call this the Second Great Depression?
POWELL: No, I don’t. I don’t think that’s a likely outcome at all. There’re some very fundamental differences. The first is that the cause here– we had a very healthy economy two months ago. And this is an outside event, it is a natural disaster, in effect. And that’s one big difference. In the ’20s when the Depression, well, when the crash happened and all that, the financial system really failed. Here, our financial system is strong has been able to withstand this. And we spent ten years strengthening it after the last crisis. So that’s a big difference. In addition, the last thing I’ll say is that the government response in the ’30s, the central banks were trying to raise interest rates to keep us on the gold standard all around the world. Exactly the opposite of what needed to be done.
In this case, you have governments around the world and central banks around the world responding with great force and very quickly. And staying at it. So I think all of those things point to what will be — it’s going to be a very sharp downturn. It should be a much shorter downturn than you would associate with the 1930s.
also:
PELLEY: Are the banks sound?
POWELL: So after the last financial crisis, the banks more than doubled their capital and liquidity and they’re far more aware and better at managing the risks they’re taking. They’re so much stronger than they were before the financial crisis, the last financial crisis. In fact, they were right at the heart of that. They were a key mechanism for amplifying bad things that happened. That’s not the case at all now. They’ve been strong. They’ve done all the things you would hope they would do. Companies have pulled down their lines of credit. They’ve funded those. There’s — much more cash has flooded into the banking system as people have sold risky assets. And the banks have absorbed all of that. So the banks have been strong so far.
PELLEY: And for people who wonder whether they should take their money out of the bank and put it in a mattress, you tell them what?
POWELL: There’s no need to do that. No need at all. The banks have been strong, they’ve been fine. There’s absolutely no need to do that.
PELLEY: There’s no worry there?
POWELL: No.
also:
PELLEY: What we’re seeing is the federal government borrowing trillions, upon trillions of dollars to try to dig us out of this hole. How long can that go on?
POWELL: Well, if you take a longer perspective, the U.S. has been spending more than it’s been taking in for some time. And that’s something we’re going to have to deal with. The time to deal with that, the time to get on a sustainable fiscal path, which really just means that the economy is growing faster than the debt, and that means you’ve got to control the growth of the debt — the time to do that is when the economy is strong. When unemployment is low, when economic activity is high, that’s when you deal with that problem. This is not the time to prioritize that concern. 
The United States is the world’s reserve currency. The dollar is the world’s reserve currency. And we have the ability to borrow at low rates. We have the ability to service that debt. And I would say this is the time when we can use that strength to our longer run benefit. It is true that deficits are going to be big for a couple of years here. And that we’ll have to deal with that. The time to deal with that though is when we’re through this recovery. 
Again, this is an economic shock that’s different and bigger than any in our lifetime. But it’s not from inside the economy. It’s from outside the economy. And so it doesn’t say anything bad about our economy. We can get back to a healthy economy fairly quickly. And the spending that we’re doing to support people and businesses will help us do that.
also:
PELLEY: What gives you hope in this dark time?
POWELL: Well, as I mentioned, in the long run, I would say I would never bet against the American economy or the American people. We have a great economy. We have highly industrious people. We have the most dynamic economy in the world. And we’re the home of so much of the great technology in the world.
So in the long run, I would say the U.S. economy will recover. We’ll get back to the place we were in February; we’ll get to an even better place than that. I’m highly confident of that. And it won’t take that long to get there. It will take some time to get there. So I think we’re going to need to help each other through this. And we will.
also:
PELLEY: Finally, what metrics are you looking at here hour by hour, day to day, to divine what the future is going to be?
POWELL: You know, at the moment, the thing that matters more than anything else is the medical metrics, frankly. It’s the spread of the virus. It’s all the things associated with that. Of course, we’re also looking at the employment data.
But in a sense, the real-time economic data that we’re seeing is just a function of how successful the social distancing measures are. So the data we’ll see for this quarter, which ends in June, will be very, very bad. There’ll be a, you know, big decline in economic activity, big increase in unemployment. But in a sense, those are a byproduct. So what we’re really looking at is getting the medical data, which is not what we usually look at, taken care of so that the economic data can start to recover. And that we think can happen as soon as the third quarter.
_____
_____
The Special Note summarizes my overall thoughts about our economic situation
SPX at 2953.91 as this post is written