One of the terms that I frequently mention is "Sustainable Prosperity." I think the term and its meaning have tremendous significance to our economic future at this juncture.
Providing an exact definition for the term is difficult due to the complexity of the underlying concepts.
"Sustainable" can be defined in terms of time, as well as continuity. If a posititive economic trend exists for a few years, can it be termed 'sustainable'? Case in point was the housing bubble. Most would say it lasted between 5 to 10 years. The economy certainly benefitted from it. However, the benefit was not sustainable. In fact, in its wake, it has caused an immense amount of damage and poses a tremendous ongoing threat.
From a continuity standpoint, in order for growth to be sustainable it has to be resistant to severe economic setbacks. Of course, history has shown that recessions, panics, and the occasional depressions are inherent in the economic cycle. However, if economic growth is sustainable in nature it should over the course of time be able to recover "lost ground" and attain new highs.
The concept of "Prosperity" is somewhat difficult to define as well. I like to think of it as being multifaceted and having deep "breadth." Of particular concern should be enrichment that is narrowly achieved, i.e. a large amount of the nation's prosperity concentrated in the hands of a few. This is a concern from both a societal and economic standpoint. Strong, vibrant, and sustainable economies have widespread prosperity.
Other aspects of "Prosperity" is the amount and composition of such. If median household income is growing at a rate greater than inflation, can that be termed prosperity? Can prosperity be defined in GDP growth? Or is prosperity a more general term that encompasses such concepts as standard of living, the ability for the masses to have affordable access to healthcare, higher education, etc.?
As aforementioned, I believe that the concept of Sustainable Prosperity is more important now than ever before. If one assumes, as per the current economic consensus, that we are experiencing economic recovery, I think it would behoove us to constantly assess whether we are experiencing true "Sustainable Prosperity" or something that might only resemble such.
SPX at 1123.89 as this post is written
Wednesday, December 30, 2009
Tuesday, December 29, 2009
An Interesting Letter Regarding Economic Systems
Below is an excerpt from a reader's letter found in The University of Chicago Magazine, Nov-Dec 2009 p. 10-11. It is from Frank R. Tangherlini. I found the ideas he presents to be interesting and notable:
http://magazine.uchicago.edu/0912/every_issue/letters.shtml
"Second was Michael Fitzgerald’s article on the Chicago School and the economy...my experiences as a youngster during the Depression of the Thirties have left an imprint on my thinking about economics, which is why I noticed a glaring omission in the exchanges and comments of these distinguished economists: their failure to empathize with the hardships experienced by average folks because of the severe economic downturn, such as described in the article by Lydialyle Gibson, “On the Line.”
There have been millions of workers who have been laid off in the past few years, who are now living in straightened circumstances, not because of poor performance on their part, but rather because of the poor performance of the market system. Indeed, one reads in Gibson’s article, “‘It’s less and less uncommon,’ says Kathy Donahue, Catholic Charities’ director of programs, ‘to find working people among those in line for a hot meal.’” The basic problem is that the system of economics that informs the thinking of many economists tends to maximize the wealth of a relatively small number of people, without imposing the constraint of requiring the simultaneous well-being of the average citizen, including a substantial reduction and eventual elimination of those below the poverty level, as well as a significant reduction of those in prison. This social constraint is what government is intended to bring about, i.e., “to provide for the general welfare,” as stated in the Preamble to the Constitution. Not placing sufficient emphasis on this fundamental injunction is the basic flaw in the Chicago School of Economics and our present system of capitalism more generally. Unless one admits this and redesigns one’s approach to economics, this tragic situation will reoccur over and over again, eventually, alas, bringing down our nation.
Frank R. Tangherlini, SM’52
San Diego
_____
SPX at 1127.78 as this post is written
Larry Summers On Growth - March 13 2009 Speech
Here is one more excerpt from Larry Summers' speech of March 13. I find this excerpt to be of particular significance with regard to the concept of Sustainable Prosperity:
http://www.brookings.edu/events/2009/0313_summers.aspx
"Of fundamental importance is ensuring that we do not exchange a painful recession for another unsustainable expansion. That would not only be irresponsible – it would be counterproductive. We have seen what happens when we pursue policies that produce short-term, instead of durable and sustainable growth."
SPX at 1127.78 as this post is written
Monday, December 28, 2009
Fannie Mae And Freddie Mac Developments Of December 24
For those who may have missed it, there was a notable development on December 24 concerning Fannie Mae and Freddie Mac. Here is The Wall Street Journal link and the Treasury Dept link:
http://www.ustreas.gov/press/releases/2009122415345924543.htm
http://online.wsj.com/article/SB126168307200704747.html
Basically the government announced plans to cover an unlimited amount of losses at both companies.
It is yet another testament to the extent of intervention in the real estate markets.
I think this "blank check" approach carries many risks. A while back I wrote an article ("Business Planning Principles Applied to the Stimulus / Intervention Efforts") about how interventions could be effectively managed. The article is not intended to condone or support the concept of interventions. However, there should be a regimented approach to their administration. These interventions carry a tremendous amount of risk, aside from the substantial amounts of money being expended.
SPX at 1126.48 as this post is written
Wednesday, December 23, 2009
Article On Detroit Unemployment
Below is an article from The Detroit News of December 16 titled "Nearly half of Detroit's workers are unemployed".
Among other things, Detroit's economic situation seems to refute the theory, with which I vehemently disagree, that we as a nation do not "need" manufacturing in order to be successful.
http://detnews.com/article/20091216/METRO01/912160374
SPX at 1117.83 as this post is written
Among other things, Detroit's economic situation seems to refute the theory, with which I vehemently disagree, that we as a nation do not "need" manufacturing in order to be successful.
http://detnews.com/article/20091216/METRO01/912160374
SPX at 1117.83 as this post is written
Larry Summers On Bubbles - March 13 2009 Speech
As I, as well as others, have been frequently mentioning bubbles, I thought it would be interesting to post a few comments (excerpts) that Larry Summers made concerning their effects during his March 13, 2009 speech. I found these comments to be very interesting, especially in light of our current economic condition and prospects for Sustainable Prosperity.
Here is a link to that speech, which was made to The Brookings Institution:
http://www.brookings.edu/events/2009/0313_summers.aspx
"Our single most important priority is bringing about economic recovery and ensuring that the next economic expansion, unlike it’s predecessors, is fundamentally sound and not driven by financial excess.
This is essential. Without robust and sustained economic expansion, we will not achieve any other national goal. We will not be able to project strength globally or reduce poverty locally. We will not be able to expand access to higher education or affordable health care. We will not be able to raise incomes for middle class families or create opportunities for new small businesses to thrive."
later:
"We have seen housing prices reach unsustainably high levels and credit spreads reach unsustainably low levels in the middle of this decade. And we saw bubbles in technology in the late 1990s.
Bubble driven economic growth is problematic because of disruption and dislocation – affecting those who took part in the bubble’s excesses and those who did not. And, it is not entirely healthy even while it lasts."
later:
"If growth in the coming years is not to be driven by asset price inflation-induced consumption, other engines of growth must be identified. These forms of growth should be sustainable and shared by the majority of American households."
SPX at 1117.83 as this post is written
Tuesday, December 22, 2009
Total Household Net Worth As Percent Of GDP
The following chart is from the CalculatedRisk Blog on December 13 http://www.calculatedriskblog.com/
and depicts Total Household Net Worth as a Percent of GDP. The underlying data is from the Federal Reserve Flow of Funds 3Q 2009 report.
I am posting it here for reference purposes, and I might comment upon it in the future. I find it to be a very interesting chart.

SPX at 1116.34 as this post is written
Stiglitz On 2010
Here is a story from yesterday on comments by Joseph Stiglitz about his views on 2010 economic performance:
http://www.cnbc.com/id/34507080
From the article: "Nobel Prize-winning economist Joseph Stiglitz warned there's a "significant" chance the U.S. economy will contract in the second half of next year..."
I find Stiglitz's view significant because it is in marked contrast to that of the 2010 economic consensus among mainstream economists.
SPX at 1117.67 as this post is written
Monday, December 21, 2009
Banker Pay
Recently, both President Obama and Treasury Secretary Geithner have bemoaned the banker pay issue.
Here is a Wall Street Journal story of December 14 containing President Obama's comments on the issue, which contains his "fat cat" quote:
http://online.wsj.com/article/SB126073152465089651.html
Here is a Bloomberg article of December 5 that mentions Treasury Secretary Geithner's comments:
http://www.bloomberg.com/apps/news?pid=20601109&sid=aWBnxBZDUtZo
What I find notable about President Obama's and Treasury Secretary Geithner's utterances on the subject is that of all the people that could potentially change the situation regarding banker pay, these two are probably most foremost. For them to simply bemoan the situation, when they are the most empowered to act upon rectifying it, seems odd.
SPX at 1112.10 as this post is written
"Too Big To Fail"
The term "Too Big To Fail" is heard frequently.
However, for all of the talk regarding its danger, very little if anything has been done to rectify the condition.
As seen in The Wall Street Journal of December 16, p C18, "The top four banks have combined assets of $7.4 trillion, or 56% of the U.S. banking sector's total. In 2000, the top four's $2 trillion of assets accounted for 35% of the total."
"Too Big To Fail" has many adverse consequences. Perhaps the most serious is that it potentially fuels moral hazard.
SPX at 1102.47 as this post is written
Sunday, December 20, 2009
2010 S&P500 Earnings Projections
Tommorrow's Barron's cover story has forecasts provided by 12 strategists and investment managers. I would like to highlight their S&P500 earnings forecasts for 2010.
As seen on page 28, the average of the 12 stated forecasts is $75.75.
From what I have seen, this $75 level is very common among forecasters, and as such seems like the predominant forecast for "operating earnings."
SPX at 1102.47 as this post is written
As seen on page 28, the average of the 12 stated forecasts is $75.75.
From what I have seen, this $75 level is very common among forecasters, and as such seems like the predominant forecast for "operating earnings."
SPX at 1102.47 as this post is written
Two Notable Ben Bernanke Articles
Here are two articles on Ben Bernanke that I found interesting. There is much I could comment upon in each. I disagree or otherwise have differing opinions on various statements in these articles; however, I do feel the stories are valuable as they present an in-depth look at Ben Bernanke from a historical and philosophical perspective.
The first is the Time Magazine "Person of the Year" story of December 16:
http://www.time.com/time/specials/packages/article/0,28804,1946375_1947251_1947520-3,00.html
The second is titled "Bernanke's Philospher" and is found in the December 2009 Reason.com:
http://reason.com/archives/2009/11/17/bernankes-philosopher
SPX at 1102.47 as this post is written
Jim Rogers And Ron Paul Video Interviews
Here are two interviews that I found interesting. Although I don't necessarily agree with all of the views voiced by Jim Rogers and Ron Paul, I think both interviews are well worth watching.
Here is the Jim Rogers interview (length 5:20), titled "What Recovery? America's Problems 'Getting Worse, Not Better,' Jim Rogers Says" on Yahoo Tech Ticker December 10, 2009:
http://finance.yahoo.com/tech-ticker/what-recovery-america's-problems-%22getting-worse-not-better%22-jim-rogers-says-388223.html?tickers=SKF,XLF,FAS,FAZ,%5EDJI,%5EGSPC,UUP
Here is the link to the Ron Paul FoxBusiness.com interview (length of 8:56) of December 16, 2009 in which he responds to Ben Bernanke being named Time Magazine's Person of the Year:
http://www.youtube.com/watch?v=O3q3UUi0IDQ
SPX at 1102.47 as this post is written
Friday, December 18, 2009
Wall Street Journal Article On "Strategic Defaults"
Yesterday The Wall Street Journal had an article titled "Debtor's Dilemma: Pay the Mortgage or Walk Away." Here is the link:
http://online.wsj.com/article/SB126100260600594531.html
The article has a variety of statistics and views on the issue of "strategic defaults." As well, it discusses the legality and consequences of such.
I have previously written numerous blog posts on the issue of "strategic defaults." (Those posts can be found under the "Real Estate" category listed along the right side of the home page). "Strategic defaults" is an exceedingly important concept for a variety of reasons. Like many economic issues, it is a very complex topic dependent upon many factors. I find the topic fascinating.
It should be very interesting to see the course of "strategic defaults" as time progresses.
SPX at 1096.08 as this post is written
Thursday, December 17, 2009
US Dollar and S&P500 Comments
Here are two charts that I find notable.
The first is the daily chart of the US Dollar. I have added the 50-day moving average. As one can see, the trend seems to be "up." This increase, if sustained, will pressure the US Dollar carry trade and that would likely have an outsized negative impact on various markets:

chart courtesy of StockCharts.com
The second daily chart is of the S&P500. The trading range from roughly mid-November until now has created a lessening of the Bollinger Bands, as shown on the chart. The width of these Bollinger Bands is seen below. As those familiar with Technical Analysis are aware, this lessening can often signal that a large directional move lies ahead in the price of the security:

chart courtesy of StockCharts.com
SPX at 1098.94 as this post is written
Wednesday, December 16, 2009
Article on Asset Price Bubbles
In my opinion, the existence of asset price bubbles is of paramount importance.
I have recently written a few posts on the subject. I would now like to comment on a Wall Street Journal article from Monday titled "Economists Warn of Asset-Price Bubbles." Here is the link:
http://online.wsj.com/article/SB126074172673289729.html
First, I would like to reiterate that I believe there are many bubbles in existence right now. This is in contrast to the commonly held theory that bubbles may form in the future if low interest rates and other stimulative measures are maintained.
Second, from the article, I completely disagree with the following excerpt with regards to "don't appear to be taking any chances":
"Although global growth and financial markets are rebounding more quickly than was expected last summer, the Fed and the European Central Bank don't appear to be taking any chances."
I base my disagreement on several factors. In my previous writings I have extensively written about the potential perilousness of interventions, moral hazard issues, asset bubbles, etc.
Third, I strongly disagree with this excerpt:
"The usual warning sign of new bubbles, rising inflation..."
Assuming that "inflation" refers to inflation as measured by CPI, I disagree that rising inflation is definitely one, if not the key, warning signs of new bubbles. Without writing extensively about this, I would point out that two of the largest bubbles of the recent past (as well as from a long-term historical context) were created in periods of low (CPI) inflation: the housing bubble and the surrealisticly absurd internet stock "hyperbubble."
I will be commenting further upon bubbles as time progresses...
SPX at 1107.93 as this post is written
Tuesday, December 15, 2009
The Federal Reserve's Role
In his December 7 speech, Ben Bernanke made the following comments with regard to the role of The Federal Reserve. For now, I will post an excerpt I found notable, and may comment upon it at a later date:
"In all of these efforts, our objective has not been to support specific financial institutions or markets for their own sake. Rather, recognizing that a healthy economy requires well-functioning financial markets, we have moved always with the single aim of promoting economic recovery and economic opportunity. In that respect, our means and goals have been fully consistent with the traditional functions of a central bank and with the mandate given to the Federal Reserve by the Congress to promote price stability and maximum employment."
SPX at 1113.69 as this post is written
Monday, December 14, 2009
A Comment On Ben Bernanke's December 7 Speech
I would like to briefly comment on Ben Bernanke's December 7 speech, that can be found at this link:
http://www.federalreserve.gov/newsevents/speech/bernanke20091207a.htm
Here is one excerpt that I found notable:
"Economic forecasts are subject to great uncertainty, but my best guess at this point is that we will continue to see modest economic growth next year--sufficient to bring down the unemployment rate, but at a pace slower than we would like."
I found this notable as he is reiterating his opinion that economic forecasting is inherently uncertain. In his May 22 speech, which I commented upon in a June 17 post, he had spoken at length on this issue.
I think that this inherent uncertainty in economic forecasting is a very important point. I have written about the topic, and have extensively detailed how accurate economic forecasting, especially since 2007 has proven incredibly difficult. This issue doesn't seem to gather much attention. However, among other issues, it seems as if it should call into question the potential accuracy of current economic forecasts.
SPX at 1112.25 as this post is written
Thursday, December 3, 2009
S&P500 Trendline And 50% Retracement
The following chart shows a Weekly Log Chart of the S&P500 from 2007. I have drawn a trendline from the October 2007 highs as well as a retracement indicator from the March 2009 bottom of ~666. (Please note that the trendline and retracement both might be off by a "hair," but this is relatively immaterial to the main message)

Chart courtesy of StockCharts.com
The trendline is significant as it represents the downtrend line from the October 2007 highs. As one can see, the current S&P500 price of 1110 is very close to that downtrend line.
As well, the current price is very close to the 50% retracement of the move from the S&P500 October 2007 high to the March 2009 low. This 50% retracement is shown in gray and is at 1121.44.
SPX at 1109.58 as this post is written
When Might I Become "Bullish"?
In this post I would like to respond to a question that was raised in response to the final post (November 6) of my "Danger In The Markets?" series.
The question raised was "What would have to occur before you considered moving bullish?"
I will answer this question in the context of the general stock market (S&P500). As readers of this blog know, I have repeatedly expressed doubts as to the sustainability of this stock market rally. I continue to view it as a bear market rally, albeit a strong one. If this indeed proves to be a bear market rally, by definition it will go below the 666 March low. There are a variety of technical, fundamental, general economic, and "behavioral" characteristics of this stock market rally that cause me to draw such conclusions.
Additionally, as I have previously stated there are a lot of factors and conditions in various other markets (outside the stock market) that cause me to be very concerned. Posts explaining these concerns can be found under the "Investor" category on the right-hand side of the home page.
Another concern that I have is that, as stated in yesterday's post, I view many asset classes as being in bubbles now. This is a very serious condition. Investing in bubbles can be extremely profitable on the way up; however, for the "long" investor they can produce huge losses if one doesn't time the exit appropriately. While I view some bubbles as being bigger than others, if the markets enter a "general liquidation" phase like they did in 2008 and most asset classes prove to be tightly correlated, as they were in 2008's decline, there would be widespread severe losses throughout most asset classes.
A few years ago I ran across a quote that I found most valuable. In essence, it said that the last place you want to invest is in an asset class whose bubble has popped.
To conclude, before I would change my overall stock market stance to "bullish," I would want to see an overall market environment considerably different than that currently existent. While I can't exactly specify the parameters of this change, because so many factors are involved, I think a change to "bullishness" will be plain to see, if not explicitly stated, in the blog posts.
One other thought...bear markets can last for years and can make many turns. Assuming we are in a bear market, the ultimate low could be years away.
SPX at 1111.62 as this post is written
Wednesday, December 2, 2009
Bubbles
from the November 3 FOMC Minutes:
"Members noted the possibility that some negative side effects might result from the maintenance of very low short-term interest rates for an extended period, including the possibility that such a policy stance could lead to excessive risk-taking in financial markets or an unanchoring of inflation expectations. While members currently saw the likelihood of such effects as relatively low, they would remain alert to these risks."
from the book Meltdown, p8, by Thomas E. Woods, Jr.:
"The Fed's policy of intervening in the economy to push interest rates lower than the market would have set them was the single greatest contributor to the crisis that continues to unfold before us. Making cheap credit available for the asking does encourage excessive leverage, speculation, and indebtedness."
____
As one can see from the above two quotes, there is a considerable difference in philosophies regarding the probability of prolonged low interest rates in creating asset bubbles. The top quote is from the November 3 Federal Open Market Committee Minutes, while the quote below it from Tom Woods Jr. and seems to offer a concise view of the Austrian philosophy on the low interest rate matter.
The issue of whether the ultra-low interest rate environment that has been put in place has fomented asset bubbles is a critical one. For background on this matter, the November 30 BusinessWeek had a story titled "Is the Fed Creating New Bubbles?" and can be found at this link:
http://www.businessweek.com/magazine/content/09_48/b4157022781639.htm
My opinion on the matter is that there are currently multiple bubbles that have formed across various asset classes. They are of various sizes and "vintages." Asset bubbles that burst can of course cause tremendous economic damage. Perhaps the best example of this is "bursting" of the housing bubble.
Some bubbles are harder to spot than others. Bubbles, almost by definition, include irrational behavior, and therefore can be hard to predict both in their formation as well as their ultimate size. There are many factors that can come into play in order to cause bubbles.
I have addressed my thoughts as to whether Gold is in a bubble in a November 20 post. Another question, that is critical to both investors and the economy, is whether U.S. Treasury securities, especially the 10 Year, is in a bubble. I believe the answer to this is "yes." The reasoning for my opinion is rather lengthy and complex; however, the previous post (from November 30) represents some of my thought on the issue.
SPX at 1112.28 as this post is written
Monday, November 30, 2009
The National Debt - A Few Comments
In August, I wrote an article titled "America's Trojan Horse" (which can also be found listed along the right-side of the homepage.)
This article had to do with various facets of our national debt, many unexplored. Here is an excerpt that I would like to further comment upon:
"The first of these concepts is that the financial markets have allowed us to grow and perpetuate our debt loads, absorbing this debt issuance at reasonable, if not low, interest rates. While this continual absorption of ever-increasing debt at lower rates is counterintuitive, it has nonetheless occurred. Why this counterintuitive event has occurred is largely unknown. Although it appears to be a long-term market anomaly (a propitious one at that) it might also be a concatenation of short-term market anomalies. The latter supposition is certainly a troubling facet to ponder, as it would likely make our ability to sustain such debt levels more tenuous."
Here is a long-term monthly chart of the 10-year Treasury yield. As one can see, the trend in yields has been down:

Chart courtesy of Stockcharts.com
Various economists have recently stated the national debt is at roughly $6 Trillion, or roughly 40% of GDP. They view the "danger point" as the national debt to GDP ratio of 100%, meaning that we can incur an additional $8 Trillion in national debt (to roughly $14 Trillion) before reaching the 100% level. Given that $8 Trillion in additional national indebtedness would likely take a few years to incur, it would appear based off of this reasoning that we have some time before the 100% "danger point" is reached. I don't agree with these figures (IMHO the actual level of debt is far higher) as well as the line of reasoning. No one really knows at what time or level the national debt hits a critical level.
It currently appears that the amount of the national debt is "tolerable" and is not causing undue concern in the markets. Metrics that cause me to draw this conclusion include the subdued level of interest rates on government debt (as seen by the above chart), seemingly low price levels of the sovereign credit default swaps of the United States, and a general lack of concern shown by the public and Congress, despite ever-increasing deficits that appear to be heading for at least $1 Trillion annually for the foreseeable future. It wasn't too long ago that a $500 Billion annual deficit was considered exceedingly high.
However, is this national debt level really as "acceptable" as it appears? Do we have a number of years at current deficit levels before we hit the "danger point?" When we do approach the "danger point," how long will we have before there are repercussions, and how serious will these repercussions be?
These questions are difficult to answer, as they appear contingent upon a number of complex, interrelated factors. I have some theories as to how and when the "danger point" will be reached, as well as the repercussions. However, these theories are still in the "formative" stages and thus I do not wish to explicitly specify a number or timeframe.
However, I will say that I am led to believe that the level of national debt, as well as our present propensity to accrue it, is not as "tolerable" as it may appear. In other words, I believe the "danger point" and subsequent repercussions may be reached sooner than the consensus believes.
If this "danger point" does present itself relatively quickly, of course it would have ramifications in many areas. Stimulus-based deficit spending, as well as other deficit spending, could likely become prohibitive. As well, other tangential effects could include higher interest rates. Furthermore, there may be a sudden need to actually reduce significant portions of the national debt.
SPX at 1087.27 as this post is written
Friday, November 27, 2009
Investment Frauds
In June I wrote a post about investment frauds. That post can be found here:
http://economicgreenfield.blogspot.com/2009/06/madoff-fraud-are-there-more.html
Since that June post, there have been a number of investment frauds uncovered. Of course, none have rivaled the size of Madoff's; however, they haven't been small either.
Perhaps the most disconcerting aspect of these frauds is that most appear to be unsophisticated. This could signal that there are many more that have yet to be uncovered, as the "bar" or "barriers to entry" for committing sizable investment frauds seems to have been set low.
I do believe there are many investment frauds, of different types, waiting to be uncovered. Sadly, the vast majority of these frauds should have never happened if proper due diligence was performed by investors. For whatever reason, a sense of wariness towards many of these investments seems to have been nonexistent for whatever reason.
While a discussion of due diligence is beyond the scope of this blog post, many of these frauds possessed similarities which should have instantly raised suspicions.
SPX at 1097.96 as this post is written
Wednesday, November 25, 2009
"Underwater Mortgages" Statistics
Yesterday The Wall Street Journal published an article titled "One in Four Borrowers Is Underwater."
The story contains a variety of statistics with regard to homeowner equity and home ownership issues. It gives a good overview of the situation, and this facet of the residential real estate situation is not pretty. As the headline states, 23% of all mortgage holders are "underwater," i.e. they owe more on their mortgages than the underlying house is worth.
There are several reasons that this situation is important. A couple include:
-These statistics are being generated despite the fact that there has been massive intervention and stimulus programs directed toward residential real estate. The majority of intervention and stimulus programs in some way, either directly or indirectly, are aimed toward supporting housing. It is highly disconcerting that we have such a dire situation despite such outsized intervention efforts. We, as a nation, have committed, both directly and indirectly (via various "guarantees") an epic amount of money toward this problem.
-As I have stated before, I do not believe that we have even come near the bottom of residential real estate prices. To the extent that residential real estate prices fall from here, this "underwater mortgage" situation will be exacerbated. A resumption of falling house prices would fuel many other problems, including the temptation of homeowners to commit "strategic defaults."
As I have written previously (my other Real Estate posts are under the "Real Estate" Category listed on the right-hand side of the home page) the real estate issues facing this country are severe, very complex, and not well understood.
SPX at 1107.71 as this post is written
Ron Paul On The U.S. Dollar
One of the facts that Ron Paul frequently quotes is that since the Federal Reserve's inception (it was created in 1913) the U.S. Dollar has lost more than 95% of its purchasing power.
I wonder how many people are actually concerned by this occurrence? I hardly ever hear this discussed among people or by the media.
They should be very concerned, however...
SPX at 1105.61 as this post is written
I wonder how many people are actually concerned by this occurrence? I hardly ever hear this discussed among people or by the media.
They should be very concerned, however...
SPX at 1105.61 as this post is written
Tuesday, November 24, 2009
Another Thought On Gold
A November 20 Wall Street Journal article stated that Gold's January 1980 record high would have an inflation-adjusted equivalent of $2,290/oz.
I find it amazing that even after the long parabolic rise we have seen in Gold since 2001, we are still far short of that inflation-adjusted price. On an "all things considered" basis one would have thought that Gold would have performed stronger over the last 30 or so years. The Gold price really went into submission from 1980-2000.
I think it underscores the fact that at least from a historical perspective of the last few decades, it has been very important as to when Gold is purchased.
I mention this as Gold appears overdue for at least some type of correction. The recent price action, resulting with Gold now at $1169 (December futures) has been strongly parabolic.
I think that many factors are now in play that will generate considerable volatility in Gold's price going forward.
Gold's price should be very interesting to watch, and I think it carries great significance on a number of fronts.
SPX at 1106.24 as this post is written
Monday, November 23, 2009
Two Notable Developments
I would like to highlight two notable developments that have lately arisen.
Both have to do with interest rates on short-term US Government securities - the 3-month bill and 2-year note.
First, a chart of each of these securities' yields. Shown is a daily chart from January 2008 to the present, in LOG scale to show detail:


Charts Courtesy of StockCharts.com
As one can see, yields on each have fallen dramatically lately and now are near or at levels last seen during the height of the Financial Crisis during Q4 2008. During that time, investors aggressively moved into these securities as they were perceived to be a "safe haven."
The most common reason given for the recent yield movements on these securities is that there is high demand driven by needs for year-end portfolio adjustments and similar motives - i.e. the movements are "benign" in nature.
I do not necessarily concur with these "common" rationales, especially in a market environment where there have been myriad danger signals exhibited, of which I have previously written. While I am not certain this drop in yields is due entirely to a "flight to safety" (i.e. as purported "safe haven" securities) as in 4Q 2008, I suspect it is a least a major driver.
If indeed some or most of this yield movement is being caused by investors' fears, it would be most odd in that these securities are reflecting heightened fears while a broad array of securities don't appear to be reflecting such fears as measured by their price movements.
To illustrate, here is a simple comparison between the three month Treasury Yield and VIX (seen below in red) since 2008. I will use VIX as a general "fear" proxy. Note the inverse correlation during 4Q 2008 and the lack thereof now:

Chart Courtesy of StockCharts.com
Another aspect of this dropoff in yields bears comment. Why would a rather large class of investors settle for minuscule yields, at a time when major asset classes have done very well over the last few months?
"The markets" don't always make sense - and this appears to be an outsized example...
SPX at 1091.38 as this post is written
Friday, November 20, 2009
Is Gold Experiencing A Bubble?
One of the questions that frequently arises with Gold's recent strong performance is "Is Gold in a bubble?"
Before I make some comments concerning this question, here is a long-term monthly chart of Gold for reference:

Chart Courtesy of StockCharts.com
Anytime a security acts as strongly as Gold has, it is natural to suspect a bubble. This is especially true with Gold's price currently, as many people don't understand the complexity of the factors that can drive Gold's price.
As I have previously noted in various blog posts (which can be found under the "Investor" Category on the right-hand side of the home page) Gold's price can be very hard to predict. To a greater extent than other securities, there are many different, hard-to-quantify factors that can drive the Gold price.
Furthermore, the market for Gold is relatively small in relation to other asset markets, so investment flows both in and out of Gold can be magnified.
Is Gold in a bubble? Given the aforementioned, I would hesitate to make an affirmative declaration. This is not to say that it is not overvalued or "ahead of itself." As I wrote in a September 25 post, "I like Gold's properties. However, I don't believe that the economic factors now in existence support a strong Gold price, from an 'all things considered' basis."
Perhaps the greater question should be whether various asset classes are currently experiencing bubbles, and whether Gold is just one of a few (or many) classes in such a condition. In effect, is Gold's price strongly (positively) correlated to that of other asset classes, and if so, why?
SPX at 1091.01 as this post is written
Thursday, November 19, 2009
Interesting Comments From Liu Mingkang
Here is a link to a November 16 Wall Street Journal article titled "China's Blunt Talk for Obama":
http://online.wsj.com/article/SB125826103009548975.html
I found this to be particularly interesting:
"Liu Mingkang, chairman of the China Banking Regulatory Commission, said that a weak U.S. dollar and low U.S. interest rates had led to "massive speculation" that was inflating asset bubbles around the world. It has created "unavoidable risks for the recovery of the global economy, especially emerging economies," Mr. Liu said. The situation is "seriously impacting global asset prices and encouraging speculation in stock and property markets."
SPX at 1109.80 as this post is written
Wednesday, November 18, 2009
Ben Bernanke On Unemployment
Ben Bernanke gave a speech on Monday at the Economic Club of New York. Here is the link:
http://www.federalreserve.gov/newsevents/speech/bernanke20091116a.htm
I found his comments on unemployment to be noteworthy:
Here are some excerpts:
"In addition to constrained bank lending, a second area of great concern is the job market. Since December 2007, the U.S. economy has lost, on net, about 8 million private-sector jobs, and the unemployment rate has risen from less than 5 percent to more than 10 percent.6 Both the decline in jobs and the increase in the unemployment rate have been more severe than in any other recession since World War II.7
Besides cutting jobs, many employers have reduced hours for the workers they have retained. For example, the number of part-time workers who report that they want a full-time job but cannot find one has more than doubled since the recession began, a much larger increase than in previous deep recessions. In addition, the average workweek for production and nonsupervisory workers has fallen to 33 hours, the lowest level in the postwar period. These data suggest that the excess supply of labor is even greater than indicated by the unemployment rate alone."
also:
"The best thing we can say about the labor market right now is that it may be getting worse more slowly."
also:
"As the recovery becomes established, however, payrolls should begin to grow again, at a pace that increases over time. Nevertheless, as net gains of roughly 100,000 jobs per month are needed just to absorb new entrants to the labor force, the unemployment rate likely will decline only slowly if economic growth remains moderate, as I expect."
SPX at 1110.32 as this post is written
Tuesday, November 17, 2009
Gold And XLF
One of the charts that I follow is the ratio of Gold to XLF. As XLF is a prominent ETF of the financial stocks, it can serve as a proxy to "paper assets."
While I think it is difficult to make concrete conclusions based upon the Gold:XLF chart, I think it does provide a "feel" for some aspects of Gold's performance.
Here is the daily chart from 2007:

Chart Courtesy of StockCharts.com
In the above chart, Gold:XLF is plotted highest, with Gold and XLF plotted separately below. I find it interesting that while Gold's price has been performing strongly recently, the peak in the Gold:XLF ratio actually came in March. This seems to cast doubt upon the idea that Gold's recent strong performance is being driven by its "safe haven" qualities. As I commented in my November 10 post on Gold:
"In effect, could the current strong performance of Gold somehow be a precursor of (more) economic problems? The answer ... can certainly be “yes.” However, if so, it would be odd to have Gold rising strongly at the same time low quality paper assets have been rising strongly as well. From a long-term historical perspective, usually Gold’s “safe haven” qualities are most highly valued when “paper” assets are suffering."
Many people have traditionally viewed Gold as an "alternative" asset - one that should hold its value if other asset values fell. Given Gold's performance over the last few years, a Gold investor should assess if such an inverse relationship still exists, or if Gold has somehow transmogrified into just another asset that is (highly) correlated with all other assets.
SPX at 1107.02 as this post is written
Monday, November 16, 2009
The Latest Wall Street Journal Economic Forecast Survey
Here is a link to the latest (November) WSJ Economic Forecast Survey:
http://online.wsj.com/article/SB125797275784744057.html
There doesn't appear to be any major changes in expectations among the surveyed economists. As the survey states, "The economists expect gross domestic product to expand around 3% at a seasonally adjusted annual rate through 2010, slightly slower than the 3.5% recorded in the third quarter."
Also:
"More than half of the respondents see a U-shaped recovery with some slowness followed by solid growth, and 31% forecast a stronger, V-shaped recovery. Just 11% of economists expect an L-shaped rebound where economic activity stabilizes at a low level, and only 7% see a double-dip recession—another drop in gross domestic product after a short rebound—as the most likely scenario."
I find the 7% figure that see a double-dip scenario as being somewhat surprising. However, what I really found amazing was found in the detail section of the survey. The question was presented:
"What is the most likely potential asset bubble?"
Commodities 41%
Emerging-market equities 27%
Emerging-market real estate 22%
Treasurys 6%
High-yield bonds 4%
U.S. equities 0%
I found the responses to the last five categories (Emerging Market Equities to U.S. Equities) to be very low, and the 0% response to U.S. equities is amazing.
One other miscellaneous comment attached to the above "asset bubble" question was notable as well: "Rebounds in markets after widespread depression worries is not the making of a bubble."
_____
Regular readers of this blog know that I am not in agreement with the consensus displayed by economists with regard to the present and future economic condition...
As an FYI, I put together a recap of various economic forecasts and predictions made from mid-2007 through March 2009. They can be found on this page under "Predictions", the second article listed:
http://economicgreenfield.blogspot.com/p/directory-of-articles.html
Economic forecasts since mid-March 2009 can be found under the "Economic Forecasts" Category.
SPX at 1111.05 as this post is written
Singapore's Healthcare System
I ran across this piece, titled "What Singapore Can Teach the White House," in the Wall Street Journal from October 20. I found it very interesting, as it discussed the healthcare system for Singapore.
SPX at 1110.73 as this post is written
SPX at 1110.73 as this post is written
Friday, November 13, 2009
A Note On Healthcare Legislation
There is so much that can be said about our healthcare system and the reform efforts underway. My previous post on the topic is from August 19.
There is one special aspect of the current legislation that I would like to comment upon. This aspect is that no member of Congress or the President would participate in the proposed healthcare program.
I find this highly notable, and I am very disappointed by it.
It is a responsibility and obligation of leadership for them to be included in such a proposal. As well, their enrollment in the plan would signal confidence in the quality and benefits of the legislation.
If they have acted in a forthright and dignified fashion, and have fulfilled their fiduciary responsibilities as well as moral obligations in creating this legislation, they would ostensibly have no objection in including themselves in such a plan.
SPX at 1087.24 as this post is written
Thursday, November 12, 2009
Ron Paul - "Be Prepared for the Worst"
I would like to comment on a commentary by Ron Paul in the November 16 edition of Forbes. It is titled "Be Prepared for the Worst" and subtitled "The large-scale government intervention in the economy is going to end badly."
The commentary can be found at this link:
http://www.forbes.com/forbes/2009/1116/opinions-great-depression-economy-on-my-mind_print.html
While I don't agree with everything that Ron Paul says, I did find this commentary to be very interesting and well worth reading. Here are some excerpts that I found particularly noteworthy:
"A false recovery is under way."
also:
"This is nothing less than the creation of another bubble. By attempting to cushion the economy from the worst shocks of the housing bubble's collapse, the Federal Reserve has ensured that the ultimate correction of its flawed economic policies will be more severe than it otherwise would have been."
also:
"What is more likely happening is a repeat of the Great Depression. We might have up to a year or so of an economy growing just slightly above stagnation, followed by a drop in growth worse than anything we have seen in the past two years."
SPX at 1095.85 as this post is written
Wednesday, November 11, 2009
Food Bank Article
On October 30 The Chicago Tribune had an article titled "Trying to keep up with hunger." The article was about food assistance provided by the Northern Illinois Food Bank, of which Dennis Smith is executive director and CEO.
There are some interesting (and disturbing) passages in the article. Here are a few:
"'The number of people visiting the 525 food pantries, soup kitchens and youth locations across the region has gone up 35 percent from a year ago,' Smith said."
"'Hunger is exploding in northern Illinois and the small agencies are being hit harder than ever before,' Smith said."
"'A lot of the people we're seeing today have never been to a food pantry before,' he [Smith] said during the Oct. 22 tour."
_____
The last quote shown above further reinforces a trend that I commented upon in a July 15 post. I called this trend the "first time of adversity" effect, a very important concept.
SPX at 1104.90 as this post is written
Tuesday, November 10, 2009
A Few Comments About Gold
Gold's recent price performance has been very strong.
There are, however, quite a few indicators that, from a historical perspective, seem to disconfirm Gold's current price, which as I write this is $1101 for the December futures contract.
One of the factors that seems to be speaking against Gold is the lagging performance of the HUI Index. As I wrote in the June 16 blog post:
"One measure that I follow is the ratio of HUI (an index of gold stocks) to that of the physical metal itself. One theory, perhaps the predominant one, is that the gold stocks should move, or at least verify, the price movements of the physical gold itself. Looking at the weekly chart (seen below) over the last 10 years seems to indicate that although gold has been relatively buoyant over the last year, the gold stocks, as seen by the HUI Index, have lagged since early 2008. One interpretation of this is that the gold stocks are not confirming the move in gold, meaning that gold may soon head down..."
Although Gold has continued to head up, as one can see in the chart below, the HUI:Gold ratio continues to lag and is at subdued (relative to the last ten years') levels:

Chart Courtesy of StockCharts.com
I find the lagging performance of the Gold stocks, as seen by the HUI Index, to be very conspicuous. This is especially so given the current investment environment where investors have shown they are even willing to aggressively bid up prices for securities that possess the most dubious of fundamental value.
In my opinion, predicting Gold's price has always been difficult. There are a variety of reasons for this, including the fact that the markets for both physical Gold and Gold stocks are relatively small. It doesn't take large investment inflows, or outflows, to move the price significantly.
Of course, Gold can be viewed as the ultimate "safe haven" security. Placing a value on this "safe haven" aspect is very difficult. Could Gold's current price be reflecting a significant "safe haven" premium? In effect, could the current strong performance of Gold somehow be a precursor of (more) economic problems? The answer to both of these questions can certainly be "yes." However, if so, it would be odd to have Gold rising strongly at the same time low quality paper assets have been rising strongly as well. From a long-term historical perspective, usually Gold's "safe haven" qualities are most highly valued when "paper" assets are suffering.
Gold's price action should be interesting going forward...
SPX at 1093.69 as this post is written
Monday, November 9, 2009
Two Unemployment Charts
The following chart is from the CalculatedRISK blog of November 8 http://www.calculatedriskblog.com/2009/11/summary-and-look-ahead.html
I like this chart as it presents a relative depiction of Post WWII recession job losses. As one can see, our current period of economic weakness's job losses are outsized both in duration and severity:
(click on images to enlarge charts)

Here is a long-term view of the official stated Unemployment Rate. This chart is from the St. Louis Federal Reserve site. I find this chart interesting for many reasons. As one can see, our current official Unemployment Rate (U3) is second only to that of the early 80's. Also, one can see that although large spikes up in the Unemployment Rate are relatively common, in prior periods the spikes up were (relatively) quickly followed by a quick retreat:

I have written frequently about the Unemployment situation. These blog posts can be found under the "Unemployment" Category. For those interested, here are a couple of the latest posts:
http://economicgreenfield.blogspot.com/2009/10/another-note-on-unemployment-statistics.html
http://economicgreenfield.blogspot.com/2009/10/note-about-unemployment-statistics.html
Furthermore, I wrote a blog series titled "Why Aren't Companies Hiring?"
SPX at 1079.79 as this post is written
Friday, November 6, 2009
Danger In The Markets? Part V
This is the last blog post (Part V of V) in this "Danger In The Markets?" blog series.
I would like to end this blog series with another look at the daily 1-year S&P500 chart. This chart depicts a Rising Wedge from the March lows. As well, I have indicated a potential H&S (Head and Shoulders) pattern in red. For those unaware, both of these patterns are bearish. I believe more in the Rising Wedge than the H&S, as it is more established. Additionally, the VIX can be found along the bottom of the chart:

Chart Courtesy of StockCharts.com
One will note that in yesterday's post (Part IV) there was a daily S&P500 chart that showed a Rising Wedge pattern as well. The difference in appearance between that chart and the one above is that the bottom trendline is drawn differently - the chart above incorporates the early October low. Regardless, should this Rising Wedge pattern be validated through future price action, conventional Technical Analysis methods would "measure" a resulting price far below the March low of 666.
As I have mentioned repeatedly on the blog (and these commentaries can be found under the "Stock Market" and "Investor" categories) I strongly believe the rally from the March low of 666 is a Bear Market Rally. The implications of this belief, should it prove accurate, are profound both from a financial markets perspective as well as an economic one.
As I have stated previously, I do hope that my analysis and conclusions as to where the markets and economy are heading are incorrect, and that we are on the path to true Sustainable Prosperity. However, I am firmly convinced from both an economic and markets perspective that we face an array of difficult problems in our economic future and resolving them will likely prove most vexing.
It should be noted that, as mentioned repeatedly on this blog, my views are very contrarian in nature. As such, they are quite at odds with those held by the vast majority of economic and financial professionals who are firmly convinced that we are currently experiencing a recovery with little or no risk of further economic damage...
SPX at 1066.63 as this post is written
Thursday, November 5, 2009
Danger In The Markets? Part IV
The charts seen in this post are from Maurice Walker, http://thechartpatterntrader.com. First, a daily 1-year chart of the S&P500. The large broadening pattern (in blue) is notable, as is the smaller one, as seen by the dotted line.
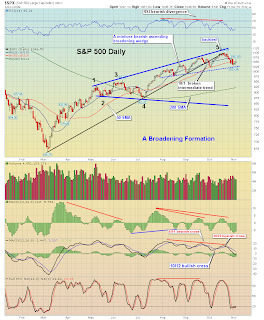
chart provided by http://thechartpatterntrader.com
Chart Courtesy of StockCharts.com
Here is a weekly chart of the S&P500. Notable here is the downtrend line (in black) from the October 2007 highs that seems to be serving as resistance. Also, the MACD and Full Stochastics seem to be reflecting weakness.

chart provided by http://thechartpatterntrader.com
Chart Courtesy of StockCharts.com
Next is a weekly chart of the QQQQ. Again, as with the S&P500 chart above, the downtrend line (in black) from the October 2007 highs that seems to be serving as resistance. Also, the MACD and Full Stochastics seem to be reflecting weakness. As well, the RSI is declining:

chart provided by http://thechartpatterntrader.com
Chart Courtesy of StockCharts.com
Now onto Part V...
SPX at 1046.50 as this post is written

chart provided by http://thechartpatterntrader.com
Chart Courtesy of StockCharts.com
Here is a weekly chart of the S&P500. Notable here is the downtrend line (in black) from the October 2007 highs that seems to be serving as resistance. Also, the MACD and Full Stochastics seem to be reflecting weakness.

chart provided by http://thechartpatterntrader.com
Chart Courtesy of StockCharts.com
Next is a weekly chart of the QQQQ. Again, as with the S&P500 chart above, the downtrend line (in black) from the October 2007 highs that seems to be serving as resistance. Also, the MACD and Full Stochastics seem to be reflecting weakness. As well, the RSI is declining:

chart provided by http://thechartpatterntrader.com
Chart Courtesy of StockCharts.com
Now onto Part V...
SPX at 1046.50 as this post is written
Wednesday, November 4, 2009
Danger In The Markets? Part III
Moving on to the stock market. First, a 1-year daily chart of the S&P500. Although at first glance, the advance from the March lows doesn't appear too suspect, two aspects are notable. One can see that currently the price has dipped below the 50 day moving average (line seen in blue -the red line is the 200 day moving average) for only the second time since the rally began in March; and second, the MACD indicator along the bottom seems at best lethargic; at worst, it is a significant divergence from the advancing price:

Chart Courtesy of StockCharts.com
Next, here is a daily chart from ~ mid '07 of the NYSE Summation Index. I have put in the S&P500 as an overlay in green, with the NYSE Summation Index's MACD at the bottom of the chart. What I continue to find interesting here is the negative MACD divergence as indicated on the chart, as seen by the blue trendlines:

Chart Courtesy of StockCharts.com
Next is a 10-year daily chart of the VIX. The level of 20 (as seen by the blue horizontal line) on the VIX seems to be a good demarcation of stress. I originally made this observation on September 16, and note how the 20 level seems to have subsequently acted as support.
The VIX has been above this 20 level continuously since early September of 2008:

Chart Courtesy of StockCharts.com
Now on to Part IV...
SPX at 1045.41 as this post is written

Chart Courtesy of StockCharts.com
Next, here is a daily chart from ~ mid '07 of the NYSE Summation Index. I have put in the S&P500 as an overlay in green, with the NYSE Summation Index's MACD at the bottom of the chart. What I continue to find interesting here is the negative MACD divergence as indicated on the chart, as seen by the blue trendlines:

Chart Courtesy of StockCharts.com
Next is a 10-year daily chart of the VIX. The level of 20 (as seen by the blue horizontal line) on the VIX seems to be a good demarcation of stress. I originally made this observation on September 16, and note how the 20 level seems to have subsequently acted as support.
The VIX has been above this 20 level continuously since early September of 2008:

Chart Courtesy of StockCharts.com
Now on to Part IV...
SPX at 1045.41 as this post is written
Tuesday, November 3, 2009
Danger In The Markets? Part II
Before displaying some charts of the stock market, I would like to post a couple of the Japanese Yen. My comment of September 14 is relevant today:
"Additionally, is it not odd, on an “all things considered” basis, that the Japanese Yen is rising at what appears to be an increasing rate? This rise commenced in mid-2007, as seen below:"
Here is the 5-year daily chart of the Japanese Yen:

Chart Courtesy of StockCharts.com
Here is the 1-year daily chart. As one can see, there may be a Cup and Handle chart pattern forming from early 2009:

Chart Courtesy of Stockcharts.com
Now onto Part III...
SPX at 1040.14 as this post is written
Monday, November 2, 2009
Danger In The Markets? Part I
This series of blog posts represents a periodic Technical Analysis of the markets. My last series of posts (5 parts) of this nature was titled "Peril In The Markets?" and started September 13. At the conclusion of that series of posts, I wrote this September 17 blog post summarizing my thoughts.
Although a stock market crash did not occur in September or October, as I thought likely given the overall situation, my overall assessment of the markets (and the economic situation) is that the level of risk has increased. There continues to be an extreme degree of peril embedded in the financial markets - as well as the economy in general. In my opinion, from these price levels this peril can only be resolved via a crash of possibly extreme magnitude.
Before displaying some charts, I would like to make a couple of disclaimers. First, an extensive overview of all of my Technical Analysis observations would be very lengthy, and it would also infringe upon some facets I consider to be proprietary. As such, I will limit my observations, but I think most people will still get a clear overview of my thoughts. Second, I am aware that many people don’t believe in Technical Analysis. Even though I use Technical Analysis extensively, I will readily admit it is not infallible. As readers of this blog are aware, the majority of my focus is on fundamental aspects of the markets and the economic situation.
Now, on to Part II and some charts...
SPX at 1036.19 as this post is written
Sunday, November 1, 2009
"Cash For Clunkers" : Incremental Sales Analysis
My last post about "Cash For Clunkers" was on October 8.
On Thursday, there was an interesting story on CNNMoney.com concerning a sales analysis of the Cash For Clunkers program. It can be found at this link:
http://money.cnn.com/2009/10/28/autos/clunkers_analysis/?postversion=2009102910
Here are some excerpts that are particularly notable:
"A total of 690,000 new vehicles were sold under the Cash for Clunkers program last summer, but only 125,000 of those were vehicles that would not have been sold anyway, according to an analysis released Wednesday by the automotive Web site Edmunds.com."
and later in the article:
"The average rebate was $4,000. But the overwhelming majority of sales would have taken place anyway at some time in the last half of 2009, according to Edmunds.com. That means the government ended up spending about $24,000 each for those 125,000 additional vehicle sales."
and later in the article:
"In order to determine whether these sales would have happened anyway, Edmunds.com analysts looked at sales of luxury cars and other vehicles not included under the Clunkers program.
Using traditional relationships between sales volumes of those vehicles and the types of vehicles sold under Cash for Clunkers, Edmunds.com projected what sales would normally have been during the Cash for Clunkers period and in the weeks after.
Edmunds.com's estimate of the ultimate sales increase generally matches what industry experts had thought, said George Pipas, a sales analyst with Ford Motor Co (F, Fortune 500)."
SPX at 1036.19 as this post is written
Friday, October 30, 2009
Another Note On Unemployment Statistics
On October 6 I wrote about my thoughts regarding Unemployment Statistics.
I recently ran across the following from John Mauldin, found in his October 23 "Thoughts From The Frontline" newsletter:
"With 9.8% unemployment, 7% underemployed (temporary), and another 3-4% off the radar screen because they are so discouraged they are not even looking for jobs, and thus are not counted as unemployed (who made up these rules?) ..."
______
There are numerous aspects of the Unemployment situation that I find highly noteworthy. If one assumes that the "true" Unemployment Rate is 20%, as per above, that in itself is outsized from a historical perspective. One would have to look back to the worst period(s) of The Great Depression to see such (stated) Unemployment Rates.
Also, for all of the hardship this unemployment situation is causing, it doesn't seem to be causing undue concern or focus. Perhaps the vast majority has adopted the traditional view, one that economists routinely site, that Unemployment is a lagging indicator and thus the problem will improve as the purported economic recovery progresses.
Another facet of note is that the stock market valuation seems incredibly high when compared to the Unemployment Rate. While this dichotomy may last temporarily, I would expect a definite "resolution" to close the gap.
SPX at 1057.71 as this post is written
Thursday, October 29, 2009
Another Story Concerning Homelessness
Here is a story from yesterday's Chicago Tribune titled, "Homelessness rises, redefining living conditions for schoolchildren."
http://www.chicagotribune.com/news/education/chi-homeless-studentsoct28,0,7967162.story
As I have previously written:
"As I discussed in my September 3 post, I think it is important to have stories and statistics concerning poverty and misfortune published on a more frequent basis. While they are certainly disheartening, it is far better to have awareness of the trends and circumstances regarding poverty and related issues than to be ignorant of them, and pretend they don't exist."
SPX at 1053.87 as this post is written
Wednesday, October 28, 2009
The McClellan Oscillator's Performance
There are several interesting facets of the markets right now. I will soon comment on some of them.
From a stock market perspective, the performance of the McClellan Oscillator is one such facet. Here is commentary from yesterday's http://www.sentimentrader.com/ that I found very interesting:
"Remarkably, the Oscillator hit a deeply oversold reading yesterday, nearly 2 standard deviations below its 70-year average. At a current level of -73, the Oscillator is giving off one of its most oversold readings since the March bottom...even though the S&P was within 1% of a new 52-week high at one point during the session.
Since 1940, this has never happened before. The S&P was never within 1% of a new yearly high on the same day the Oscillator dipped to -70 or below."
SPX at 1056.91 as this post is written
Tuesday, October 27, 2009
Aruoba-Diebold-Scotti Business Conditions (ADS) Index
The below link discusses a new economic forecast index called the Aruoba-Diebold-Scotti Business Conditions (ADS) Index:
http://knowledgetoday.wharton.upenn.edu/2009/10/the-economy-right-now.html
Here is a chart of the index that can be found on the Philadelphia Fed website at this link:
http://www.philadelphiafed.org/research-and-data/real-time-center/business-conditions-index/

From the above Philadelphia Fed link:
"The Aruoba-Diebold-Scotti business conditions index is designed to track real business conditions at high frequency. Its underlying economic indicators (weekly initial jobless claims; monthly payroll employment, industrial production, personal income less transfer payments, manufacturing and trade sales; and quarterly real GDP) blend high- and low-frequency information and stock and flow data. Both the ADS index and this web page are updated as data on the index's underlying components are released.
The average value of the ADS index is zero. Progressively bigger positive values indicate progressively better-than-average conditions, whereas progressively more negative values indicate progressively worse-than-average conditions. The ADS index may be used to compare business conditions at different times. A value of -3.0, for example, would indicate business conditions significantly worse than at any time in either the 1990-91 or the 2001 recession, during which the ADS index never dropped below -2.0.
The vertical lines on the figure provide information as to which indicators are available for which dates. For dates to the left of the left line, the ADS index is based on observed data for all six underlying indicators. For dates between the left and right lines, the ADS index is based on at least two monthly indicators (typically employment and industrial production) and initial jobless claims. For dates to the right of the right line, the ADS
index is based on initial jobless claims and possibly one monthly indicator."
________
At this point, I don't have a lot to say about this index. I do find the latest downturn from about mid-August to be notable.
Also, it would be interesting to see how this index compares historically to the S&P500 as well as the other index and forecasts I have previously discussed on this site such as the ECRI WLI, Fortune Big Picture Index, and Dow Jones ESI.
SPX at 1062.47 as this post is written
Monday, October 26, 2009
Christina Romer's October 22, 2009 Testimony
Here is testimony by Christina Romer before the Joint Economic Committee on October 22, 2009:
http://jec.senate.gov/index.cfm?FuseAction=Hearings.HearingsCalendar&ContentRecord_id=6dd4483c-5056-8059-7664-1856ea0ee4e6
Readers of this blog will know that I don't agree with many of the statements and forecasts found in this testimony. However, I am calling attention to it because it has several notable passages, as well as forecasts.
Although we have heard similar statements from other economists, here is one such notable passage found beginning on the bottom of page 10:
"Leaving aside timing issues, the unemployment rate typically falls when GDP growth exceeds its normal rate of roughly two and a half percent per year and rises when GDP growth falls short of this pace. With predicted growth right around two and a half percent for most of the next year and a half, movements in the unemployment rate either up or down are likely to be small. As a result, unemployment is likely to remain at its severely elevated level."
SPX at 1079.60 as this post is written
Friday, October 23, 2009
Warren Buffett - Recent Interview
Here are a couple of links to a recent Warren Buffett interview. I have not been able to pinpoint a date, but apparently the interview was from a month or so ago:
The video link:
http://pymnts.com/warren-buffett-on-what-s-next-in-the-payments-industry-2
The transcript link:
http://pymnts.com/transcript-warren-buffett-on-what-s-next-in-the-payments-industry/
The first part of the interview deals with his views on the economy. Although I don't necessarily agree with his views, I did find the interview to be interesting on various fronts.
SPX at 1087.14 as this post is written
Thursday, October 22, 2009
3Q Double-Digit Percentage Revenue Declines
As I have discussed previously, double-digit percentage declines in corporate revenues is a serious issue.
Many well-respected, broadly-based companies have posted double-digit percentage revenue declines for 3Q. This is highly significant in that we are purportedly in an economic recovery; as well, 3Q 2008 should provide a (relatively) easy comparable period as the economy was struggling.
SPX at 1078.7 as this post is written
Wednesday, October 21, 2009
Moral Hazard Speech
Here is a link to an October 20 speech given by Mervyn King. The speech speaks of the concept of Moral Hazard:
http://www.bankofengland.co.uk/publications/speeches/2009/speech406.pdf
Although there are various notable passages, I found this line perhaps most interesting:
"The massive support extended to the banking sector around the world, while necessary to avert economic disaster, has created possibly the biggest moral hazard in history."
I have commented on Moral Hazard previously on this blog. As I have noted, there has been very little (especially relative to the size of the issue) commentary or attention given to the issue. I believe the Moral Hazard issue is of the greatest importance.
Moral hazard should have been addressed via credible policy many years ago. I am certain that by neglecting this issue we will see immense damage.
SPX at 1098.22 as this post is written
Monday, October 19, 2009
The "Crowded Trade" Concept
Here is a story from Friday on CNBC.com that caught my interest:
http://www.cnbc.com/id/33339374
It is titled "Stocks, Gold Are Crowded Trades: Hugh Hendry"
I found it interesting for two main reasons. First, it discusses the concept of the "Crowded Trade." This is a phrase that isn't often heard these days. Nonetheless, I think the concept is important to consider, especially in today's investment environment.
Second, I found this interesting:
"The remarkable thing about the stock market is 'the absence of volume associated with it'," Hendry said.
Compared with previous rebounds in stocks from previous recessions, volume in this recovery from the March lows is 60 percent lower, according to Hendry."
SPX at 1089.31 as this post is written
Friday, October 16, 2009
Tax Increases And Our Economic Situation
Lately there has been quite a bit of activity in either increasing or proposing increasing taxes (also increases in fees, fines, etc). This activity is occurring at all levels, i.e. local, state, and national.
These tax increases are very noteworthy given our current period of economic weakness. I will be addressing various aspects of this in the future.
For now, I would like to highlight the dynamic between taxes and the national debt, which is especially important. I discuss this in the "America's Trojan Horse" for those who haven't read it.
SPX at 1086.22 as this post is written
Thursday, October 15, 2009
Unemployment And Stimulus
Here is a Wall Street Journal editorial from Monday:
http://online.wsj.com/article/SB10001424052748703298004574459341050610398.html
I found it interesting for two reasons. First, it has a chart that shows the actual Unemployment Rate vs. that forecast in "The Job Impact of the American Recovery and Reinvestment Plan." Currently the Unemployment Rate is approximately 2% above the rate forecasted with the stimulus.
Second, the editorial mentions the idea of an employment tax credit, i.e. granting a tax credit to employers who hire. This is yet another stimulus idea, and as such is subject to the same risks and unintended consequences that I have previously written of. Apparently one idea is to grant a $3000 tax credit for each new hire in 2010.
I don't believe an employment tax credit will solve, or present a significant solution to, our national unemployment problem. As I wrote in the "Why Aren't Companies Hiring?" blog series the Unemployment problem is not simple in nature.
SPX at 1092.02 as this post is written
Wednesday, October 14, 2009
A Quizzical Quote From Barney Frank
Here is a story from The New York Times of October 8 that discusses the situation at the FHA:
http://www.nytimes.com/2009/10/09/business/09fha.html?pagewanted=1&_r=2
What I found particularly interesting in this story was a quote from Barney Frank, the chairman of the House Financial Services Committee:
"I don’t think it’s a bad thing that the bad loans occurred,” he said. “It was an effort to keep prices from falling too fast. That’s a policy.”
My comment on the above quote:
??
SPX at 1085.74 as this post is written
Tuesday, October 13, 2009
NABE Economic Forecast Survey
Here is another economic forecast survey, this time from NABE:
http://www.cnbc.com/id/33278490/
From the article: "The survey of 44 professional forecasters released by the National Association of Business Economists (NABE) found that 80 percent of the respondents believed the economy was growing again after four straight quarters of declines."
The survey's results for 2010 GDP and Unemployment appear similar to those from The Wall Street Journal's survey I posted yesterday.
This article also mentions housing: "About two-thirds of respondents believed house prices would reach a bottom this year and the survey found that high house prices would not pose a threat to the sector's recovery."
SPX at 1076.19 as this post is written
Monday, October 12, 2009
The Latest WSJ Forecasting Survey
I would like to highlight a couple of facets of the latest Wall Street Journal Forecasting Survey:
http://online.wsj.com/article/SB125494927938671631.html?mod=djemalertNEWS
As stated, "The Wall Street Journal surveys a group of 52 economists throughout the year. Broad surveys on more than 10 major economic indicators are conducted every month. Once a year, economists are ranked on how well their forecasts have fared. For prior installments of the surveys, see: WSJ.com/Economist ."
I found two aspects particularly interesting. First, with regard to unemployment, "On average the economists -- not all of whom answered every question -- expect the unemployment rate to peak at 10.2% in February."
Second, for all of 2010, the average forecast is for 2.8% GDP growth. This forecast of 2.8% growth has not changed significantly since May's first response.
SPX at 1078.17 as this post is written
Friday, October 9, 2009
Updates On Economic Indicators
I would like to do a quick update of some indicators that are supposed to predict economic activity. These indicators have been discussed in previous blog posts:
The ECRI WLI (Weekly Leading Index) was at 127.1 in the week to September 25. Here is Press Release:
http://www.businesscycle.com/news/press/1582/
Fortune's Big Picture Index is at 14.25 as of October 2. This is at a level that is very near to the low of the data series; furthermore, as one can see, its gauge depicting "recession v. recovery" seems to strongly indicate "recession."
http://money.cnn.com/magazines/fortune/storysupplement/recovery_index/index.html
Lastly, the Dow Jones ESI (Economic Sentiment Indicator) is shown to be 34.1, according to the September 30 Press Release here:
http://solutions.dowjones.com/economicsentimentindicator/
I find all three of these indicators to be very interesting, and will continue to post them on occasion.
SPX at 1065.48 as this post is written
Thursday, October 8, 2009
"Cash For Clunkers" Revisited
Here is an October 5 Wall Street Journal editorial reviewing the "Cash For Clunkers" stimulus plan:
http://online.wsj.com/article/SB10001424052748703628304574453280766443704.html
Also, to provide perspective, a chart of Vehicle Sales from the CalculatedRisk blog (10/1 post) at this link:
http://www.calculatedriskblog.com/2009/10/light-vehicle-sales-92-million-saar-in.html

As one can see, the "Cash for Clunkers" seems to have been successful in temporarily causing a surge in auto sales for July and August.
One could casually observe that the program was successful, in that it caused a short-term sales spike and the purported associated economic and environmental benefits.
However, this observation would be flawed, as many other factors are present as well. I mentioned some of them during my August 4 post.
SPX at 1057.58 as this post is written
Wednesday, October 7, 2009
"Stimulus Spending Doesn't Work" Op-Ed
Here is an October 1 op-ed in The Wall Street Journal titled "Stimulus Spending Doesn't Work" :
http://online.wsj.com/article/SB10001424052748704471504574440723298786310.html
Although I don't concur with some of the statements in this Op-Ed, I do believe that its overall message and conclusions are important.
SPX at 1054.72 as this post is written
http://online.wsj.com/article/SB10001424052748704471504574440723298786310.html
Although I don't concur with some of the statements in this Op-Ed, I do believe that its overall message and conclusions are important.
SPX at 1054.72 as this post is written
Tuesday, October 6, 2009
A Note About Unemployment Statistics
From time to time, I will write posts that contain the Unemployment Rate or various other job loss measures. I show these statistics as they are widely used and quoted by others.
From my perspective, however, the methodology used to measure the various job loss and unemployment statistics does not provide an accurate depiction. There are a variety of reasons for this that become evident if one carefully analyzes the unemployment calculations.
I feel that if one were to accurately gauge the Unemployment Rate, the rate would be at least 20%, which is roughly double the official Unemployment Rate of 9.8%. This 20% figure is above the U6 measure of 17% that many have adopted as an accurate benchmark.
What is bothersome is that even the official unemployment statistics that I show in the blog posts display a very worrisome situation.
SPX at 1054.65 as this post is written
Subscribe to:
Posts (Atom)