Wednesday, September 30, 2015

Chicago Fed National Financial Conditions Index (NFCI)

The St. Louis Fed’s Financial Stress Index (STLFSI) is one index that is supposed to measure stress in the financial system.  Its reading as of the September 24, 2015 update (reflecting data through September 18) is -.715.
Of course, there are a variety of other measures and indices that are supposed to measure financial stress and other related issues, both from the Federal Reserve as well as from private sources.
Two other indices that I regularly monitor include the Chicago Fed National Financial Conditions Index (NFCI) as well as the Chicago Fed Adjusted National Financial Conditions Index (ANFCI).
Here are summary descriptions of each, as seen in FRED:
The National Financial Conditions Index (NFCI) measures risk, liquidity and leverage in money markets and debt and equity markets as well as in the traditional and “shadow” banking systems. Positive values of the NFCI indicate financial conditions that are tighter than average, while negative values indicate financial conditions that are looser than average.
The adjusted NFCI (ANFCI). This index isolates a component of financial conditions uncorrelated with economic conditions to provide an update on how financial conditions compare with current economic conditions.
For further information, please visit the Federal Reserve Bank of Chicago’s web site:
Below are the most recently updated charts of the NFCI and ANFCI, respectively.
The NFCI chart below was last updated on September 30, 2015 incorporating data from January 5,1973 to September 25, 2015, on a weekly basis.  The September 25, 2015 value is -.64:
NFCI
Data Source: FRED, Federal Reserve Economic Data, Federal Reserve Bank of St. Louis; accessed September 30, 2015:
The ANFCI chart below was last updated on September 30, 2015 incorporating data from January 5,1973 to September 25, 2015, on a weekly basis.  The September 25 value is .42:
ANFCI
Data Source: FRED, Federal Reserve Economic Data, Federal Reserve Bank of St. Louis; accessed September 30, 2015:
_________
I post various indicators and indices because I believe they should be carefully monitored.  However, as those familiar with this blog are aware, I do not necessarily agree with what they depict or imply.
_____
The Special Note summarizes my overall thoughts about our economic situation
SPX at 1920.02 as this post is written

Tuesday, September 29, 2015

Consumer Confidence Surveys – As Of September 29, 2015

Doug Short had a blog post of September 29, 2015 (“Consumer Confidence Improved Moderately in September“) in which he presents the latest Conference Board Consumer Confidence and Thomson/Reuters University of Michigan Consumer Sentiment Index charts.  They are presented below:
(click on charts to enlarge images)
Conference Board Consumer Confidence
Michigan Consumer Sentiment Survey
There are a few aspects of the above charts that I find highly noteworthy.  Of course, until the recent sudden upswing, the continued subdued absolute levels of these two surveys was disconcerting.
Also, I find the “behavior” of these readings to be quite disparate as compared to the other post-recession periods, as shown in the charts between the gray shaded areas (the gray areas denote recessions as defined by the NBER.)
While I don’t believe that confidence surveys should be overemphasized, I find these readings to be very problematical, especially in light of a variety of other highly disconcerting measures highlighted throughout this site.
_____
The Special Note summarizes my overall thoughts about our economic situation
SPX at 1882.37 as this post is written

Friday, September 25, 2015

Stock Market Capitalization To GDP – Through Q2 2015 - Update

“Stock market capitalization to GDP” is a notable and important metric regarding stock market valuation.  In February of 2009 I wrote of it in “Does Warren Buffett’s Market Metric Still Apply?
Doug Short has recently published a post depicting this “stock market capitalization to GDP” metric.
As seen in his September 25, 2015 post titled “Market Cap to GDP:  The Buffett Valuation Indicator Hovers in Levitation Mode” he shows two different versions, varying by the definition of stock market capitalization. (note:  additional explanation is provided in his post.)
For reference purposes, here is the first chart, with the stock market capitalization as defined by the Federal Reserve:
(click on charts to enlarge images)
stock market capitalization to GDP
Here is the second chart, with the stock market capitalization as defined by the Wilshire 5000:
Stock market capitalization to GDP
As one can see in both measures depicted above, “stock market capitalization to GDP” is at notably high levels from a long-term historical perspective.
_____
The Special Note summarizes my overall thoughts about our economic situation
SPX at 1951.51 as this post is written

Money Supply Charts Through August 2015

For reference purposes, below are two sets of charts depicting growth in the money supply.
The first shows the MZM (Money Zero Maturity), defined in FRED as the following:
M2 less small-denomination time deposits plus institutional money funds.
Money Zero Maturity is calculated by the Federal Reserve Bank of St. Louis.
Here is the “MZM Money Stock” (seasonally adjusted) chart, updated on September 25, 2015 depicting data through August 2015, with value $13,551.9 Billion:
MZMSL
Here is the “MZM Money Stock” chart on a “Percent Change From Year Ago” basis:
MZMSL Percent Change From Year Ago
Data Source: FRED, Federal Reserve Economic Data, Federal Reserve Bank of St. Louis; accessed September 25, 2015:
The second set shows M2, defined in FRED as the following:
M2 includes a broader set of financial assets held principally by households. M2 consists of M1 plus: (1) savings deposits (which include money market deposit accounts, or MMDAs); (2) small-denomination time deposits (time deposits in amounts of less than $100,000); and (3) balances in retail money market mutual funds (MMMFs). Seasonally adjusted M2 is computed by summing savings deposits, small-denomination time deposits, and retail MMMFs, each seasonally adjusted separately, and adding this result to seasonally adjusted M1.
Here is the “M2 Money Stock” (seasonally adjusted) chart, updated on September 24, 2015, depicting data through August 2015, with value $12,138.4 Billion:
M2SL
Here is the “M2 Money Stock” chart on a “Percent Change From Year Ago” basis:
M2SL percent change from year ago
Data Source: FRED, Federal Reserve Economic Data, Federal Reserve Bank of St. Louis; accessed September 25, 2015:
_____
The Special Note summarizes my overall thoughts about our economic situation
SPX at 1945.45 as this post is written

Thursday, September 24, 2015

Durable Goods New Orders – Long-Term Charts Through August 2015

Many people place emphasis on Durable Goods New Orders as a prominent economic indicator and/or leading economic indicator.
For reference, below are charts depicting this measure.
First, from the St. Louis Fed site (FRED), a chart through August, updated on September 24, 2015. This value is $236,322 ($ Millions):
(click on charts to enlarge images)
durable goods new orders
Here is the chart depicting this measure on a “Percentage Change from a Year Ago” basis:
durable goods new orders percent change from year ago
Data Source: FRED, Federal Reserve Economic Data, Federal Reserve Bank of St. Louis: Manufacturers’ New Orders:  Durable Goods [DGORDER]; U.S. Department of Commerce: Census Bureau; accessed September 24, 2015;
_________
I post various indicators and indices because I believe they should be carefully monitored.  However, as those familiar with this blog are aware, I do not necessarily agree with what they depict or imply.
_____
The Special Note summarizes my overall thoughts about our economic situation
SPX at 1914.14 as this post is written

Updates Of Economic Indicators September 2015

Here is an update of various indicators that are supposed to predict and/or depict economic activity. These indicators have been discussed in previous blog posts:
The September 2015 Chicago Fed National Activity Index (CFNAI) updated as of September 24, 2015:
CFNAI-MA3
As of September 18, 2015 (incorporating data through September 11, 2015) the WLI was at 131.1 and the WLI, Gr. was at -2.2%.
A chart of the WLI,Gr., from Doug Short’s post of September 18, 2015, titled “ECRI Weekly Leading Index: Up Slightly from Last Week“:
ECRI WLI, Gr.
Here is the latest chart, depicting the ADS Index from December 31, 2007 through September 19, 2015:
ADS Index
The Conference Board Leading (LEI) and Coincident (CEI) Economic Indexes:
As per the September 18, 2015 press release, titled “The Conference Board Leading Economic Index (LEI) for the U.S. Increased Slightly,” (pdf) the LEI was at 123.7 and the CEI was at 112.6 in August.
An excerpt from the September 18 release:
“The U.S. LEI suggests economic growth will remain moderate into the New Year, with little reason to expect growth to pick up substantially,” said Ataman Ozyildirim, Director of Business Cycles and Growth Research at The Conference Board. “Average working hours and new orders in manufacturing have been weak, pointing to more slow growth in the industrial sector. However, employment, personal income and manufacturing and trade sales have all been rising, helping to offset the weakness in industrial production in recent months.”
Here is a chart of the LEI from Doug Short’s blog post of September 18 titled “Conference Board Leading Economic Index Sees Fractional Increase In August“:
Conference Board LEI
_________
I post various indicators and indices because I believe they should be carefully monitored.  However, as those familiar with this blog are aware, I do not necessarily agree with what they depict or imply.
_____
The Special Note summarizes my overall thoughts about our economic situation
SPX at 1915.87 as this post is written

Wednesday, September 23, 2015

Chicago Fed National Financial Conditions Index (NFCI)

The St. Louis Fed’s Financial Stress Index (STLFSI) is one index that is supposed to measure stress in the financial system.  Its reading as of the September 17, 2015 update (reflecting data through September 11) is -.68.
Of course, there are a variety of other measures and indices that are supposed to measure financial stress and other related issues, both from the Federal Reserve as well as from private sources.
Two other indices that I regularly monitor include the Chicago Fed National Financial Conditions Index (NFCI) as well as the Chicago Fed Adjusted National Financial Conditions Index (ANFCI).
Here are summary descriptions of each, as seen in FRED:
The National Financial Conditions Index (NFCI) measures risk, liquidity and leverage in money markets and debt and equity markets as well as in the traditional and “shadow” banking systems. Positive values of the NFCI indicate financial conditions that are tighter than average, while negative values indicate financial conditions that are looser than average.
The adjusted NFCI (ANFCI). This index isolates a component of financial conditions uncorrelated with economic conditions to provide an update on how financial conditions compare with current economic conditions.
For further information, please visit the Federal Reserve Bank of Chicago’s web site:
Below are the most recently updated charts of the NFCI and ANFCI, respectively.
The NFCI chart below was last updated on September 23, 2015 incorporating data from January 5,1973 to September 18, 2015, on a weekly basis.  The September 18, 2015 value is -.61:
NFCI
Data Source: FRED, Federal Reserve Economic Data, Federal Reserve Bank of St. Louis; accessed September 23, 2015:
The ANFCI chart below was last updated on September 23, 2015 incorporating data from January 5,1973 to September 18, 2015, on a weekly basis.  The September 18 value is .40:
ANFCI
Data Source: FRED, Federal Reserve Economic Data, Federal Reserve Bank of St. Louis; accessed September 23, 2015:
_________
I post various indicators and indices because I believe they should be carefully monitored.  However, as those familiar with this blog are aware, I do not necessarily agree with what they depict or imply.
_____
The Special Note summarizes my overall thoughts about our economic situation
SPX at 1937.85 as this post is written

The U.S. Economic Situation – September 23, 2015 Update

Perhaps the main reason that I write of our economic situation is that I continue to believe, based upon various analyses, that our economic situation is in many ways misunderstood.  While no one likes to contemplate a future rife with economic adversity, current and future economic problems must be properly recognized and rectified if high-quality, sustainable long-term economic vitality is to be realized.
There are an array of indications and other “warning signs” – many readily apparent – that current economic activity and financial market performance is accompanied by exceedingly perilous dynamics.
I have written extensively about this peril, including in the following:
Building Financial Danger” (ongoing updates)
My analyses continues to indicate that the growing level of financial danger will lead to the next stock market crash that will also involve (as seen in 2008) various other markets as well.  Key attributes of this next crash is its outsized magnitude (when viewed from an ultra-long term historical perspective) and the resulting economic impact.  This next financial crash is of tremendous concern, as my analyses indicate it will lead to a Super Depression – i.e. an economy characterized by deeply embedded, highly complex, and difficult-to-solve problems.
For long-term reference purposes, here is a chart of the Dow Jones Industrial Average since 1900, depicted on a monthly basis using a LOG scale (updated through September 18, 2015, with a last value of 16384.79):
(click on chart to enlarge image)(chart courtesy of StockCharts.com)
DJIA from 1900

_____
The Special Note summarizes my overall thoughts about our economic situation
SPX at 1942.74 as this post is written

Trends Of S&P500 Earnings Forecasts

S&P500 earnings trends and estimates are a notably important topic, for a variety of reasons, at this point in time.
FactSet publishes a report titled “Earnings Insight” that contains a variety of information including the trends and expectations of S&P500 earnings.
For reference purposes, here are two charts as seen in the “Earnings Insight” (pdf) report of September 18, 2015:
from page 20:
(click on charts to enlarge images)
S&P500 earnings estimate trends
from page 21:
S&P500 earnings trends
_____
I post various economic forecasts because I believe they should be carefully monitored.  However, as those familiar with this blog are aware, I do not agree with many of the consensus estimates and much of the commentary in these forecast surveys.
_____
The Special Note summarizes my overall thoughts about our economic situation
SPX at 1942.74 as this post is written

Tuesday, September 22, 2015

S&P500 Annual EPS Estimates For 2015, 2016 & 2017

As many are aware, Thomson Reuters publishes earnings estimates for the S&P500.  (My other posts concerning S&P earnings estimates can be found under the S&P500 Earnings label)
The following estimates are from Exhibit 12 of “The Director’s Report” (pdf) of September 22, 2015, and represent an aggregation of individual S&P500 component “bottom up” analyst forecasts.  For reference, the Year 2014 value is $118.78:
Year 2015 estimate:
$118.73/share
Year 2016 estimate:
$131.22/share
Year 2017 estimate:
$145.36/share
_____
I post various economic forecasts because I believe they should be carefully monitored.  However, as those familiar with this blog are aware, I do not agree with many of the consensus estimates and much of the commentary in these forecast surveys.
_____
The Special Note summarizes my overall thoughts about our economic situation
SPX at 1942.74 as this post is written

Standard & Poor’s S&P500 Earnings Estimates For 2015 & 2016 – As Of September 18, 2015

As many are aware, Standard & Poor’s publishes earnings estimates for the S&P500.  (My posts concerning their estimates can be found under the S&P500 Earnings label)
For reference purposes, the most current estimates are reflected below, and are as of September 18, 2015:
Year 2015 estimates add to the following:
-From a “bottom up” perspective, operating earnings of $111.27/share
-From a “top down” perspective, operating earnings of N/A
-From a “bottom up” perspective, “as reported” earnings of $99.58
Year 2016 estimates add to the following:
-From a “bottom up” perspective, operating earnings of $129.73/share
-From a “top down” perspective, operating earnings of N/A
-From a “bottom up” perspective, “as reported” earnings of $120.19/share
_____
I post various economic forecasts because I believe they should be carefully monitored.  However, as those familiar with this blog are aware, I do not agree with many of the consensus estimates and much of the commentary in these forecast surveys.
_____
The Special Note summarizes my overall thoughts about our economic situation
SPX at 1939.92 as this post is written

Monday, September 21, 2015

U.S. Deflation – September 21, 2015 Update

This post provides an update to various past posts discussing deflation and “deflationary pressures,” including the most recent post, that of July 27, 2015 titled “U.S. Deflation – July 27, 2015 Update.”   I have extensively written of “deflationary pressures” and deflation as I continue to believe that prolonged and deep U.S. deflationary conditions are on the horizon, and that such deflationary conditions will cause, as well as accompany, inordinate economic hardship. [note: to clarify, for purposes of this discussion, when I mention “deflation” I am referring to the CPI going below zero. Also, I have been using the term “deflationary pressures” as a term to describe deflationary manifestations within an environment that is still overall inflationary but heading towards deflation.]
The subject of deflation contains many complex aspects, and as such no short discussion can even begin to be a comprehensive discussion of such.  However, in this post I would like to highlight some recent notable developments.
Of note, the shortfall between the Federal Reserve’s stated inflation target (2% on the PCE Price Index) and the actual inflation reading continues.  This 2% inflation target has been “missed” (inflation has been less than 2%) for well over 3 years.  For reference, here is a chart of the PCE Price Index from Doug Short's post of August 28, 2015, titled "The PCE Price Index Still Below Target":
PCE price index
The issue of inflation continuing to be below the 2% target seems to be receiving more public discussion by the Federal Reserve.  Vice Chairman Stanley Fischer gave an August 29, 2015 speech titled "U.S. Inflation Developments" as well as various mentions by Fed Chair Janet Yellen in the September 17, 2015 FOMC Press Conference.
In that Press Conference, one notable comment from Janet Yellen was the following:
Survey-based measures of longer-term inflation expectations have remained stable.  However, the Committee has taken note of recent declines in market-based measures of inflation compensation and will continue to monitor inflation developments carefully.
There are many surveys containing inflation expectations as well as "market-based" measures of the same.  One survey is the Federal Reserve's September 17, 2015 “Economic Projections of Federal Reserve Board Members and Federal Reserve Bank Presidents, September 2015“ (pdf); another survey can be seen in the September Wall Street Journal Economic Forecast Survey.  It should be noted that neither of these surveys shows future PCE or CPI figures below zero.
As well, The University of Michigan's "Inflation Expectations" survey shows stable inflation expectations, and prominent surveys of corporate expectations of inflation, such as the Federal Reserve Bank of Atlanta's Business Inflation Expectations (BIE) are also relatively stable, with the September 2015 survey showing an anticipated 1.7 percent inflation over the next year.
"Market-based" measures of inflation expectations include the Federal Reserve Bank of Atlanta’s series titled “Deflation Probabilities,” which has recently noticeably increased, but still remains low at 5% as of the September 16, 2015 reading.
Another "market-based" measure of inflation is the "10-Year Breakeven Inflation Rate," described in FRED as:
The breakeven inflation rate represents a measure of expected inflation derived from 10-Year Treasury Constant Maturity Securities (http://research.stlouisfed.org/fred2/series/DGS10 ) and 10-Year Treasury Inflation-Indexed Constant Maturity Securities (http://research.stlouisfed.org/fred2/series/DFII10 ). The latest value implies what market participants expect inflation to be in the next 10 years, on average.
Here is the long-term chart, with a reading of 1.58 percent as of September 18, 2015:
inflation expectations
source:  Federal Reserve Bank of St. Louis, 10-Year Breakeven Inflation Rate [T10YIE], retrieved from FRED, Federal Reserve Bank of St. Louis https://research.stlouisfed.org/fred2/series/T10YIE/, September 21, 2015.
While neither the inflation surveys or "market-based" measures depict a deflationary situation - or provide strong indications of impending deflation - is it correct to assume that they would?  For many reasons I don't believe that they will provide significant "advance" warning of impending deflation.
While deflation has many attributes and causes, one of its characteristics is its relative rarity since the beginning of the 20th Century.  As I mentioned in the November 14, 2013 post (“Thoughts Concerning Deflation”):
Given that deflationary episodes have been recently relatively nonexistent, “seeing” and “proving” explicit signs of such an impending condition is especially challenging.
I continue to believe that the many continuing signs of “deflationary pressures” is a foreboding.  Among these signs is the pronounced weakness in many commodities.  One such measure is the Bloomberg Commodity Index, as seen below:
(charts courtesy of StockCharts.com; chart creation and annotation by the author)
Bloomberg Commodity Index
Another manifestation of deflationary pressures is seen in U.S. import and export prices.
Still another sign is economic weakness.  While there is recent widespread consensus that the U.S. economy is "advancing," if not "strong," my analyses indicates that the economy continues to have many problematical areas of weakness and the widespread consensus concerning current economic vitality is (substantially) incorrect.
In conclusion, I continue to believe that significant (in extent and duration) U.S. deflation is on the horizon.  As discussed in the aforementioned November 14, 2013 post, deflation often accompanies financial system distress.  My analyses continue to show an exceedingly complex future financial condition in which a very large “financial system crash” will occur, during which outright deflation will both accompany and exacerbate economic and financial conditions.
_____
The Special Note summarizes my overall thoughts about our economic situation
SPX at 1963.80 as this post is written

Total Household Net Worth As Of 2Q 2015 – Two Long-Term Charts

In the last post (“Total Household Net Worth As A Percent Of GDP 2Q 2015“) I displayed a long-term chart depicting Total Household Net Worth as a percentage of GDP.
For reference purposes, here is Total Household Net Worth from a long-term perspective (from 1945:Q4 to 2015:Q2).  The last value (as of September 21, 2015) is $85.71199 Trillion:
(click on each chart to enlarge image)
TNWBSHNO
Also of interest is the same metric presented on a “Percent Change from a Year Ago” basis:
TNWBSHNO percent change from year ago
Data Source: FRED, Federal Reserve Economic Data, Board of Governors of the Federal Reserve System; accessed September 21, 2015:
_____
The Special Note summarizes my overall thoughts about our economic situation
SPX at 1963.43 as this post is written

Total Household Net Worth As A Percent Of GDP 2Q 2015

The following chart is from the CalculatedRisk blog post of September 18, 2015 titled “Fed’s Flow of Funds:  Household Net Worth at Record High at end of Q2.” It depicts Total Household Net Worth as a Percent of GDP.  The underlying data is from the Federal Reserve’s Z.1 report, “Financial Accounts of the United States“:
(click on chart to enlarge image)
household net worth as a percent of GDP
As seen in the above-referenced CalculatedRisk blog post:
Household net worth was at $85.7 trillion in Q2 2015, up from $85.0 billion in Q1.  Net worth will probably decline in Q3 due to the decline in the stock market..
The Fed estimated that the value of household real estate increased to $21.5 trillion in Q2 2015. The value of household real estate is still $1.0 trillion below the peak in early 2006 (not adjusted for inflation).
I have written in previous posts on this Household Net Worth (as a percent of GDP) topic:
As one can see, the first outsized peak was in 2000, and attained after the stock market bull market / stock market bubbles and economic strength.  The second outsized peak was in 2007, right near the peak of the housing bubble as well as near the stock market peak.
also:
I could extensively write about various interpretations that can be made from this chart.  One way this chart can be interpreted is a gauge of “what’s in it for me?” as far as the aggregated wealth citizens are gleaning from economic activity, as measured compared to GDP.
_____
The Special Note summarizes my overall thoughts about our economic situation
SPX at 1978.30 as this post is written

Friday, September 18, 2015

Janet Yellen’s September 17, 2015 Press Conference – Notable Aspects

On Thursday, September 17, 2015 Janet Yellen gave her scheduled September 2015 FOMC Press Conference. (link of video and related materials)
Below are Janet Yellen’s comments I found most notable – although I don’t necessarily agree with them – in the order they appear in the transcript.  These comments are excerpted from the “Transcript of Chairman Yellen’s Press Conference“(preliminary)(pdf) of September 17, 2015, with the accompanying “FOMC Statement” and “Economic Projections of Federal Reserve Board Members and Federal Reserve Bank Presidents, September 2015“ (pdf).
From Janet Yellen’s opening comments:
CHAIR YELLEN.  Good afternoon.  As you know from our policy statement released a short time ago, the Federal Open Market Committee reaffirmed the current 0 to 1/4 percent target range for the federal funds rate.  Since the Committee met in July, the pace of job gains has been solid, the unemployment rate has declined, and overall labor market conditions have continued to improve.  Inflation, however, has continued to run below our longer-run objective, partly reflecting declines in energy and import prices.  While we still expect that the downward pressure on inflation from these factors will fade over time, recent global economic and financial developments are likely to put further downward pressure on inflation in the near term.  These developments may also restrain U.S. activity somewhat but have not led at this point to a significant change in the Committee’s outlook for the U.S. economy.
also:
The labor market has shown further progress so far this year toward our objective of maximum employment.  Over the past three months, job gains averaged 220,000 per month.  The unemployment rate, at 5.1 percent in August, was down four-tenths of a percent from the latest reading available at the time of our June meeting, although that decline was accompanied by some reduction in the labor force participation rate over the same period.  A broader measure of unemployment that includes individuals who want and are available to work but have not actively searched recently and people who are working part time but would rather work full time has continued to improve.  That said, some cyclical weakness likely remains:  While the unemployment rate is close to most FOMC participants’ estimates of the longer-run normal level, the participation rate is still below estimates of its underlying trend, involuntary part-time employment remains elevated, and wage growth remains subdued.
Inflation has continued to run below our 2 percent objective, partly reflecting declines in energy and import prices.  My colleagues and I continue to expect that the effects of these factors on inflation will be transitory.  However, the recent additional decline in oil prices and further appreciation of the dollar mean that it will take a bit more time for these effects to fully dissipate.  Accordingly, the Committee anticipates that inflation will remain quite low in the coming months.  As these temporary effects fade and, importantly, as the labor market improves further, we expect inflation to move gradually back toward our 2 percent objective.  Survey-based measures of longer-term inflation expectations have remained stable.  However, the Committee has taken note of recent declines in market-based measures of inflation compensation and will continue to monitor inflation developments carefully.
Janet Yellen’s responses as indicated to the various questions:
STEVE LIESMAN. Steve Liesman, CNBC. Madam Chair, this notion of uncertainty and economic and global developments, is it fair to say that it could be many months before those global developments worked their way to the U.S. economic data, and that you would not have the certainty that you're looking for to raise interest rates for many months and perhaps well into next year?
CHAIR YELLEN. Well, Steve, I think, you can see from the SEP projections that most participants continued to think that economic conditions will call for or make appropriate an increase in the federal funds rate by the end of this year. Four participants moved their projections into 2016 or later, but the great majority of participants continued to hold that view, and of course, there will always be uncertainty. We can't expect that uncertainty to be fully resolved. But in light of the developments that we have seen and the impacts on financial markets, we want to take a little bit more time to evaluate the likely impacts on United States. And, as I mentioned, the inflation outlook has softened slightly. We've had some further developments, namely lower oil prices and a further appreciation of the dollar that have put some downward pressure in the near term on inflation. Now, we fully expect those further effects like the earlier moves in the dollar and in oil prices to be transitory, but there is a little bit of downward pressure on the inflation and we would like to see some further developments and this importantly could include, is likely to include further improvements in the labor market that would bolster our confidence that inflation will move back to 2 percent over the medium term.
also:
BINYAMIN APPELBAUM. Binyam Appelbaum, the New York Times. The economic projections that you all released today show that committee members expect roughly a three-year period in which the unemployment rate will be at its lowest sustainable level and yet inflation will not rise above 2 percent. That seems extraordinary could you talk about why as a moment ago you said, we are expecting inflationary pressures when unemployment is at a low level? Why is inflation going to be so weak for so long under those circumstances and does it indicate when you are projecting that basically much of a decade will pass without the Fed reaching its inflation target? Does it indicate that you have failed to do enough to revive this economy in recent years?
CHAIR YELLEN. Well, we have been very focused, Binyam, on doing everything we can to revive this economy and to achieve our maximum employment objective. And after we took the funds rate down to zero, as you know, we put in place a number of other extraordinary measures including forward guidance and large scale asset purchases in order to speed the recovery and attain both our inflation objective and our maximum employment objective. And I mean when you look at the projection, you see as you mentioned that we see sufficient growth to push the unemployment rate. It's already very close to participants' estimates of its longer run normal level. We expect the unemployment rate to fall slightly or at least participants project that that it will fall slightly below that level. As that occurs, we would expect labor force participation, the cyclical component of that to diminish over time and we would hope to see some decline in the portion of slack that's reflected in high levels of part-time involuntary employment.

Now, inflation is going back in our projection to 2 percent. It takes 2018 to get there. It's awfully close in 2017 and it's not terribly far away even next year. We have very large drags from import prices and energy prices and over the next year or so, those things should dissipate and the behavior of inflation should mainly if we-- if our understanding of the inflationary process is correct and if inflation expectations are well anchored at 2, which I believe they are. As the labor market heals and as that healing progresses, we will see further upward pressure on inflation. That's what we expect. Now, it's a slow process, it's characterized by lags and that's why it takes a few years as the inflation, as the unemployment rate falls and even overshoots its longer-run normal level, it just takes some time for inflation to get back to 2 percent. But the overshooting helps it get back faster than it otherwise would, and it certainly important for us and I think our credibility hinges on defending our inflation target, not only from threats that it rises above but also that we not have-- that over the medium term that we want to see inflation get back to 2 percent. And we believe the policies we're following are designed to accomplish that and will do so.
also:
PETER BARNES. Hi, Chairman Yellen. Peter Barnes, FOX Business. Could you talk about a little bit more specifically about what foreign developments you discussed in the meeting today, what you're concerned about? We all assume it might be China. That was in the July minutes. Are you concerned about the Chinese economy slowing and the markets there? Do you have any concerns about the European economy? And then related to stock markets, could I ask you how you feel about US equity markets right now because you did talk about your concerns about them back in May. You saw they were generally quite high and we're worried about potential dangers in US equity market evaluations but now equity prices have pulled back. Thank you.
CHAIR YELLEN. So, with respect to global developments, we reviewed developments in all important areas of the world but we're focused particularly on China and emerging markets. Now, we've long expected, as most analysts have, uh, to see some slowing in Chinese growth over time as they rebalance their economy. And they have planned that I think there are no surprises there. The question is whether or not there might be a risk of a more abrupt slowdown than most analysts expect. And I think developments that we saw in financial markets in August, in part reflected concerns that uh, Chinese-- there was downside risk to Chinese economic performance and perhaps concerns about the deafness with which policymakers were addressing those concerns.

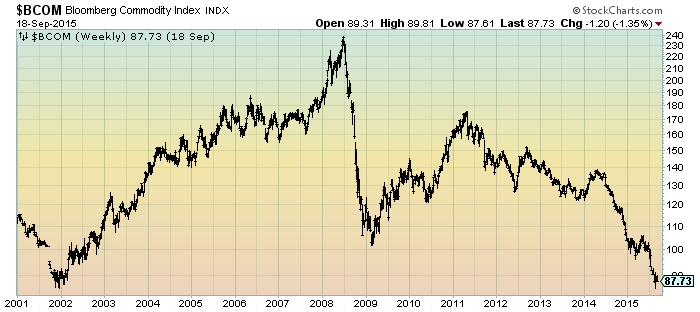
In addition, we saw a very substantial downward pressure on oil prices and commodity markets and those developments have had a significant impact on many emerging market economies that are important producers of commodities, as well as more advanced countries including Canada, which is an important trading partner of ours that has been negatively affected by declining commodity prices, declining energy prices.

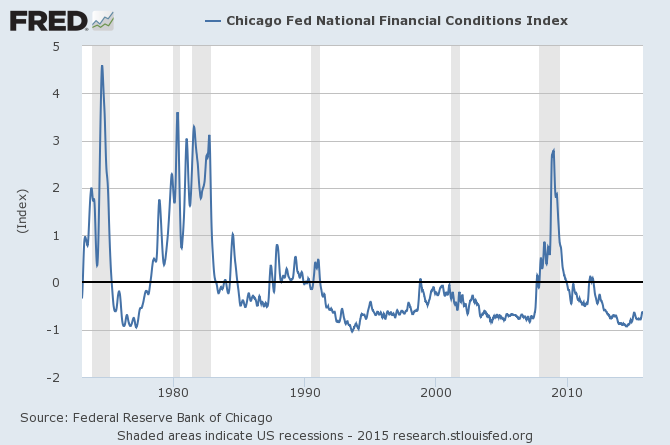
Now, there are a lot of countries that are net importers of energy, that are positively affected by those developments but emerging markets, important emerging markets have been negatively affected by those developments. And we've seen significant outflows of capital from those countries, pressures on their exchange rates and concerns about their performance going forward. So, a lot of our focus has been on risks around China but not just China, emerging markets, more generally in how they may spill over to the United States. In terms of thinking about financial developments and our reaction to them, I think a lot of the financial developments were really-- so we don't want to respond to market turbulence. The Fed should not be responding to the ups and downs of the markets and it is certainly not our policy to do so. But when there are significant financial developments, it's incumbent on us to ask ourselves what is causing them. And of course what we can't know for sure, it seem to us as though concerns about the global economic outlook were drivers of those financial developments. And so, they have concerned us in part because they take us to the global outlook and how that will affect us. And to some extent, look, we have seen a tightening of financial conditions during, as I mentioned, during the inter-meeting period. So, the stock market adjustment combined with a somewhat stronger dollar and higher risk spreads thus represent some tightening of financial conditions.

Now, in and of itself, it's not the end of story in terms of our policy because we have to put a lot of different pieces together. We are looking at, as I emphasized, a US economy that has been performing well and impressing us by the pace at which it's creating jobs and the strength of domestic demand. So, we have that. We have some concerns about negative impacts from global developments and some tightening of financial conditions. We're trying to put all of that together in the picture. I think, importantly we see in our statement that in spite of all of this, we continue to view the risks to economic activity and labor markets as balanced. So, it's a lot of different pieces, different cross currents, some strengthening the outlook, some creating concerns, but overall, no significant change in the economic outlook.
also:
MICHAEL MCKEE. Michael McKee from Bloomberg Radio on television. If the economy develops as the summary of economic projection suggests, you will see improvement in labor markets but it won't push inflation up any faster. So I'm wondering what the argument is for raising rates this year as suggested by the dot plot, because even allowing for long and variable lags, you're not forecasting an inflation problem that would seem to suggest the need for a steeper and faster rate path for at least a couple of years.
CHAIR YELLEN. So, if we maintain a highly accommodative monetary policy for a very long time from here and the economy performs as we expect, namely it's strong and the risk that are out there don't materialize, my concern will be that we will have much more tightening in labor markets than you see in these projections and the lags will be probably slow, but eventually we will find ourselves with a substantial overshoot of our inflation objective and then we'll be forced into a kind of stop-go policy. We will have pushed the economy so far it will have become overheated. And we will then have to tighten policy more abruptly than we like. And instead of having slow steady growth improvement in the labor market and continued improvement in good performance in the labor market, I don't think it's good policy to have to then slam on the brakes and risk a downturn in the economy.
also:
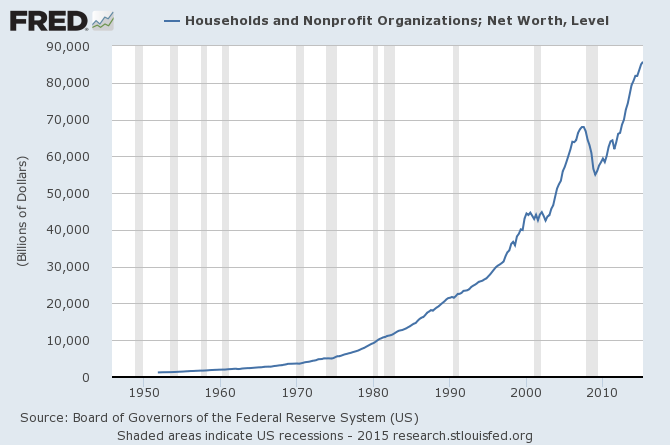
NANCY MARSHALL-GENZER. Nancy Marshall-Genzer with Marketplace. You mentioned you've gotten a lot of unsolicited advice, the folks outside. But there is another side that says the Fed should raise interest rates because keeping rates so long-- so low for so long has actually exacerbated the wealth gap. Do you think the Fed has widened the wealth gap with its low interest rate policy? These people say low interest rates mainly benefit the wealthy.
CHAIR YELLEN. Well, I guess I really don't see it that way. It is true that interest rates affect asset prices but they have complex effect through balance sheets, through liabilities and assets. To me the main thing that an accommodative monetary policy does is put people back to work. And since income and equality is surely exacerbated by a high-- having high unemployment and a weak job market that has the most profound negative effects on the most vulnerable individuals, to me, putting people back to work and seeing a strengthening of the labor market that has a disproportionately favorable effect on vulnerable portions of our population, that's not something that increases income and equality.

There have been a number of studies that have done-- been done recently that have tried to take account of many different ways in which monetary policy acting through different parts of the transmission mechanism affect inequality. And there's a lot of guesswork involved and different analyses can come up with different things. But a pretty recent paper that's quite comprehensive concludes that policy has not exacerbated income and equality.

_____
The Special Note summarizes my overall thoughts about our economic situation
SPX at 1967.64 as this post is written