Below are Jerome Powell’s comments I found most notable – although I don’t necessarily agree with them – in the order they appear in the transcript. These comments are excerpted from the “Transcript of Chairman Powell’s Press Conference“ (preliminary)(pdf) of April 29, 2020, with the accompanying “FOMC Statement.”
From Chairman Powell’s opening comments:
The forceful measures that we as a country are taking to control the spread of the virus have brought much of the economy to an abrupt halt. Many businesses have closed, people have been asked to stay home, and basic social interactions are greatly curtailed. People are putting their lives and livelihoods on hold, at significant economic and personal cost. All of us are affected, but the burdens are falling most heavily on those least able to carry them. It is worth remembering that the measures we are taking to contain the virus represent an investment in our individual and collective health. As a society, we should do everything we can to provide relief to those who are suffering for the public good.
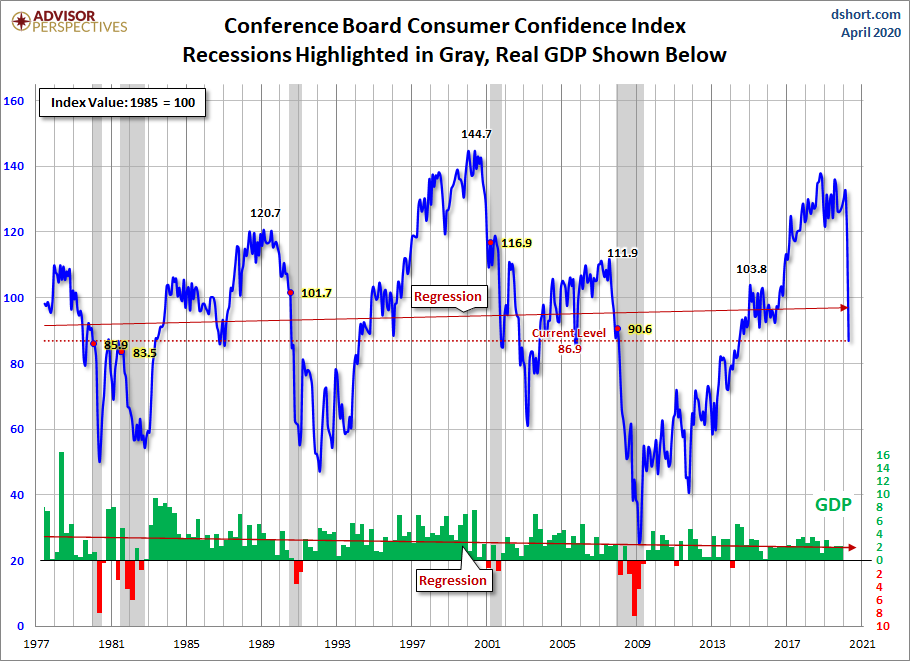
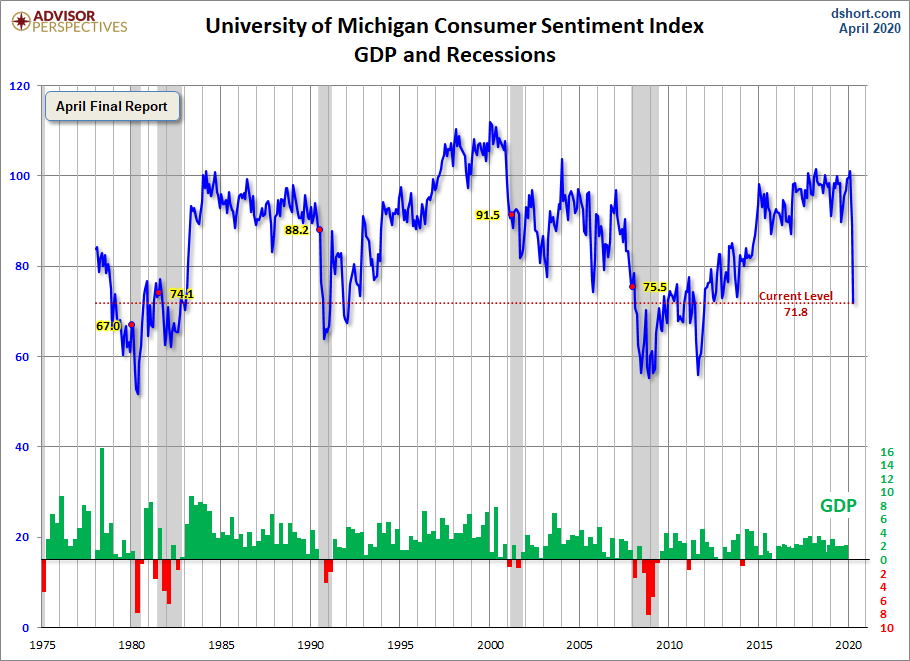
While many standard economic statistics have yet to catch up with the reality we are experiencing, it is clear that the effects on the economy are severe. Millions of workers are losing their jobs. Next week’s jobs report is expected to show that the unemployment rate, which was at 50-year lows just two months ago, has surged into double-digits. Household spending has plummeted as people stay home, and measures of consumer sentiment have fallen precipitously. Hotels, airlines, restaurants, department stores, and other retailers have been particularly hard hit. Manufacturing output fell sharply in March and is likely to drop even more rapidly this month as many factories have temporarily closed. Overall, economic activity will likely drop at an unprecedented rate in the second quarter. Inflation is also being held down, reflecting weaker demand as well as significantly lower energy prices.
also:
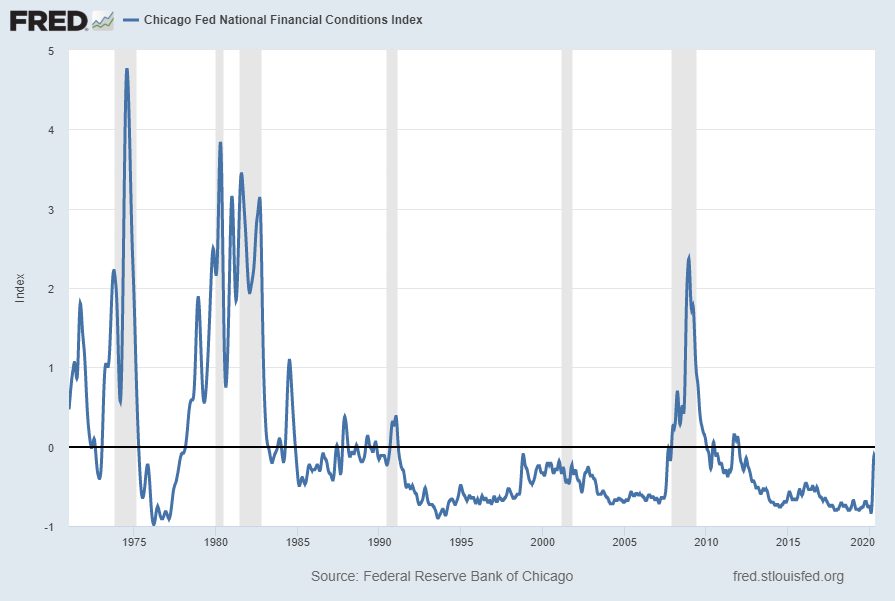
We are also undertaking programs to provide stability to the financial system and to more directly support the flow of credit in the economy—for households, for businesses of all sizes, and for state and local governments. These programs benefit the economy by providing financing where it is not otherwise available. In addition, by serving as a backstop to key credit markets, the programs can improve market functioning by increasing the willingness of private lenders to extend credit. Many of these programs rely on emergency lending powers that are available only in very unusual circumstances, such as those we find ourselves in today. We are deploying these lending powers to an unprecedented extent, enabled in large part by the financial backing and support from Congress and the Treasury. We will continue to use these powers forcefully, proactively, and aggressively until we are confident that we are solidly on the road to recovery.
I would stress that these are lending powers, and not spending powers. The Fed cannot grant money to particular beneficiaries. We can only make loans to solvent entities with the expectation that the loans will be repaid. Many borrowers will benefit from our programs, as will the overall economy. But for many others, getting a loan that may be difficult to repay may not be the answer. In these cases, direct fiscal support may be needed. Elected officials have the power to tax and spend and to make decisions about where we, as a society, should direct our collective resources. The CARES Act and other legislation provide direct help to people, businesses, and communities. This direct support can make a critical difference, not just in helping families and businesses in a time of need, but also in limiting long-lasting damage to our economy.
Jerome Powell’s responses as indicated to the various questions:
STEVE LIESMAN. Mr. Chairman, question, Steve Liesman with CNBC. I’ve got two questions here. First of all, why aren’t you announcing or conducting a specific quantitative easing program? And maybe you could explain what the context is now of the purchases that will be made and the amounts that are to come. The second question I have is, is the Federal Reserve really taking enough risk to help households and businesses here? In that you just said that the programs that are out there may be best for those who are able to repay loans, but so don’t you have a series of programs, essentially, lending only those able to repay, which is essentially helping those who may need it the least? Thank you.
CHAIR POWELL. So, let me say again, in terms of asset purchases and other measures, we do think our policy stance is appropriate now. We’ve had discussions, as I’ve mentioned over time and done quite a bit of thinking about what we might do in the future. We think, for now, our policy stance is appropriate. We’re not going to change it now. And we’re really waiting to see more from the economy. There are a range of potential paths the economy could be on, and I think, as the time approaches for, then we’ll, you know, we’ll address your first question which is about asset purchases. So, but that’s not something we’re doing today. It’s something that we have talked about and, you know for now, we like our current policy stance. In terms of risk, so, you know, we operate under the laws that Congress passes. And there are a number of aspects under section 13(3), and you can see that they’ve permitted us to, I think, move very quickly and move into areas where we’ve never been before and do so quite aggressively. So, I think we’re going places and providing help in places where we never have. And I’m glad that we are. I think it’s appropriate that we are. Nonetheless, these are lending powers and, if you read section 13(3) of the Dodd Frank Act – or of the Federal Reserve Act—I know you have—it does require that we be secured to our satisfaction, and we can’t lend to insolvent companies. You know, it’s clear, these are lending powers. And we are, ultimately, bound to implement the laws that Congress gives us. We do not make grants; we can’t make grants. And the reason I raised that in my remarks is that I just want to be clear on that. We, you know, we can do what we can do, and we will do it to the absolute limit of those powers. We will keep at it. And you, I just want people to know that we will be at it with the legal authorities that we have until we get through this thing. We will keep using our authorities. But there are authorities that we don’t have, and there may be a need for those authorities to be used as well as ours.
also:
HOWARD SCHNEIDER. Oh hi, Chair Powell, and thanks for doing this. I wanted to get a little more expansion on the timing of recovery and the connection between the health response. You said earlier, I think, that you thought the second half of the year could see a pretty robust rebound. Is that now out of the question? And do you think a steady recovery is really possible until a vaccine’s developed, given the patchwork of measures we’ve seen taken around the states? Is that going to really lead us to a steady path out absent a vaccine?
CHAIR POWELL. You know, as you know, economic forecasts are always uncertain. Today, they’re unusually uncertain, and that’s really because so much of the performance of the economy depends on the path of the virus and the success of the measures we take to control it. Our success in reopening the economy and also the time it takes to develop new drugs. And our tools, the things that we do, don’t affect any of those things. We’re not experts on those things either, but what the experts tell us is that the outcomes are highly uncertain. So, this is an unusually new kind of uncertainty added on top of our regular uncertainty. But I will say, there, I think there are a few things you can say about the path ahead. First, this time, now, is going to be a time of sharp contraction in economic activity, high unemployment, personal consumption expenditures have declined sharply, business investment as well, unemployment moved up. We’re going to see economic data for the second quarter that’s worse than any data we’ve seen for the economy. And they’re a direct consequence of the disease and the measures that we’re taking to protect ourselves from it. So, then we will enter this new phase, and we’re just beginning to maybe do that, where we will, formal measures that require social distancing will be rolled back gradually and at different paces in different parts of the country. And, in time, during this period, the economy will begin to recover. People will come out of their homes, start to spend again. We’ll see unemployment go down; we’ll see economic activity pick up. And, you know, when will that be? It’s very hard to say. But let’s just say, for this purpose, that it’s in the third quarter. So, as I mentioned earlier, that could be a fairly, you know, a large increase. Given the size of the fall, the increase could also be substantially large, although it’s unlikely that it would bring us quickly all the way back to pre-crisis levels. Of course, this is the period as well, that carries the risk of new outbreaks of the virus, something we really want to avoid. I think then, after that period, at some point, you will have, you know, the kind of formal social distancing measures will be gone, but you’ll still be left with, probably, a level of caution on the part of people who will worry and probably keep worrying for some time. You would think that behavior will change as people gain confidence, so that the sooner we get the virus under control, the sooner people can regain that confidence and regain their economic activity. I think trying to be really precise about when that might happen and what the numbers might look like is, I think it’s very tough to do that.
also:
MICHAEL MCKEE. Mr. Chairman, given the demand drop, demand shock and the drop in oil prices, do you anticipate that we might see any kind of deflation even for a very short period that would require a Fed response? If we got a negative print on CPI or PCE, how should people think about that? And second question, there is a disconnect, it appears, between the markets and the economic outlook right now. And I know you said that this isn’t the time to worry about moral hazard, but do you worry, with the size of stimulus that you and the Congress are putting into the economy, there could be financial stability problems if this goes along?
CHAIR POWELL. In terms of inflation, we think that inflation is very closely and strongly related to inflation expectations. And during the global financial crisis, there was a concern that we might see deflation, but it didn’t happen. Inflation tended to move down a little bit, as it will when demand is weak. And but, inflation expectations did not move strongly down here in the United States. They have in other places in the world though, over the past 25 years. There’s been downward pressure on inflation really for several decades now. So, I would say, as long as inflation expectations remain anchored, then we shouldn’t see deflation. And the Federal Reserve is strongly committed to maintaining two percent inflation over time. So, we’ll be there to work on that. I think you asked really about headline inflation. If low-energy prices, very low energy prices were to drop headline inflation negative, I would hope that people would see through that. And we’ll be monitoring that very carefully. Would see through it though, and look to core which is a better predictor of future inflation. So, needless to say, we’ll be keeping very close track of that. In terms of the markets, you know, our concern is that they be working. We’re not, we’re not focused on the level of asset prices in particular, it’s just markets are trying to price in something that is so uncertain as to be unknowable which is the path of this virus globally and its effect on the economy. And that’s very, very hard to do. That’s why you see volatility the way it’s been, market reacting to things with a lot of volatility. But, you know, what we’re trying to assure really, is that the market is working. The market is assessing risks, lenders are lending, borrowers are borrowing, asset prices are moving in response to events. That is really important for everybody, including, you know, the most vulnerable among us because, if markets stop working and credit stops flowing, then you see, that’s when you see, you know, very sharp negative, even more negative economic outcomes. So, I think our measures have supported market function pretty well. You know, we’re going to stay very careful, carefully monitoring that. But I think it’s been good to see markets working again, particularly the flow of credit in the economy has been a positive thing as businesses have been able to build up their liquidity buffers. And households have been able to be home, you know, people have been home, you know, concerned about their jobs, but they’re not concerned about the financial system collapsing as they were in 2008 and ‘9.
CHRISTOPHER RUGABER. Hi, Chair Powell. Chris Rugaber over at AP, thank you. I guess I had two questions. I wanted to start on the unemployment picture and nail down a little bit how you see things going from here. You did talk about potential loss of skills over time. So, are you worried about structural changes in job markets that would keep unemployment high and, therefore, potentially beyond the ability of the Fed to do anything about, which was something that was debated, as you know, after the last recession? And then eventually, of course, the unemployment rate did go lower than people thought. Second question is just on the money from Treasury, the 454 billion, it sounds like you want to keep that in reserve for programs that have high demand such as the Main Street program. Are you willing to use that to backstop, say, a program that is having more losses? I mean, you know, what’s your tolerance for loss among that 454 billion? Thank you.
CHAIR POWELL. So, in terms of the labor market, the risk of damage to people’s skills and their careers and their lives is a function of time to some extent. So, the longer one is unemployed, the harder it gets, I think, and we’ve probably all seen this in our lives, the harder it is to get back into the workforce and get back to where you were, if you ever do get back to where you were. So, and you know, longer and deeper downturns have had, have left more of a mark, generally, in that dimension with the labor force. And so, that’s why, as I mentioned, that’s why the urgency in doing what we can to prevent that longer-run damage. It doesn’t have to be that way. We won’t be able to limit all of it. But we do have the tools to do what we can to keep people in touch with the labor force and working. And, also, out of insolvency too, it doesn’t seem fair that people should lose everything they have, including their homes, over this. So, nonetheless, there will be some of that. But we do have some tools to ameliorate that. In terms of the, so, in terms of the money, you know the $454 billion, it’s a couple things. First, the Treasury Secretary really has authority over that, right? And it stands in front of our losses. So, you know, but I do think we are, we are clearly moving into areas where there is more risk than there has been in the past. And that’s okay. I think that’s what we’re supposed to do. This is a very unusual time. And so, but in terms of the way to think about that money, I think that’s really a question for the Treasury Department. You know, we are, we set up the facilities, and we work very, very closely and successfully and collaboratively with the Treasury on this, but that particular aspect of it falls more to the Secretary.
NANCY MARSHALL-GENZER. Nancy Marshall-Genzer with Marketplace. Chair Powell, I’m wondering what you would say to savers who are hurt by very low interest rates and maybe going into investments maybe in the stock market that aren’t so great for them. And, also, I’m wondering if you can give us any more of a clue as to how long you think we’re going to have interest rates near zero?
CHAIR POWELL. So, we think that low interest rates affect the economy through a number of channels in a positive way. Lower interest rates support economic activity through channels that we, overall, through channels that we understand reasonably well. They make it cheaper to borrow, they make, they drive, you know, your cost of borrowing down. They do raise asset prices including the value of your home. If your saver owns a home or has a 401(k), your saver will benefit from that. But for people who are really, really just relying on their bank savings account earnings, this is, you know, that’s, you’re not going to benefit from low interest rates. But we, you know, we have to look out for the overall economy. Low interest rates support employment, they support economic activity, and those are our mandates. And I think for the overall good of the economy, low interest rates are a good thing. And does not say they’re good for every single person, but that shouldn’t stop us from doing what we think is good for the whole. In terms of how low, I really don’t want to speculate, you know, we will turn to questions like that soon enough but the, in terms of how long we’ll stay, and under what conditions we’ll stay at the effective lower bound, those are just exactly the things we’re thinking about. Right now, we like the place we are. We’ve said that we’ll keep our rates where they are until we’re confident that the economy has weathered the effects of the outbreak and is on track to achieve our goals. So, that’s where we are. We’re not changing that guidance today. You know, but it’ll be, that means we’re going to be very patient. That means we’re not going to be in any hurry to move rates up. Thank you very much. Thanks.
_____
_____
The Special Note summarizes my overall thoughts about our economic situation
SPX at 2899.60 as this post is written