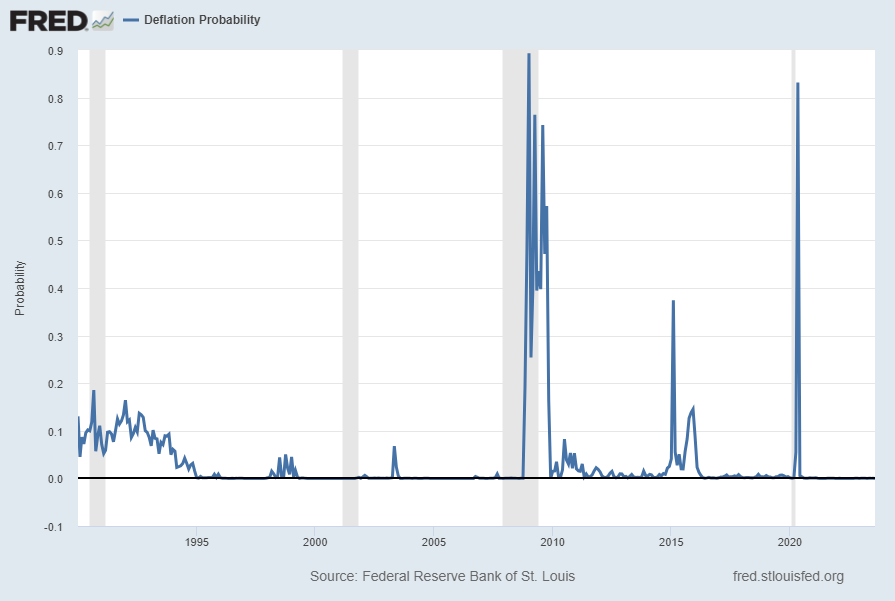
For reference, below is a chart of the St. Louis Fed Price Pressures Measures – Deflation Probability [FRED STLPPMDEF] through August 2023.
While I do not necessarily agree with the current readings of the measure, I view this as a proxy of U.S. deflation probability.
A description of this measure, as seen in FRED:
This series measures the probability that the personal consumption expenditures price index (PCEPI) inflation rate (12-month changes) over the next 12 months will fall below zero.
The chart, on a monthly basis from January 1990 – August 2023, with a last reading of .00002, last updated on August 31, 2023:
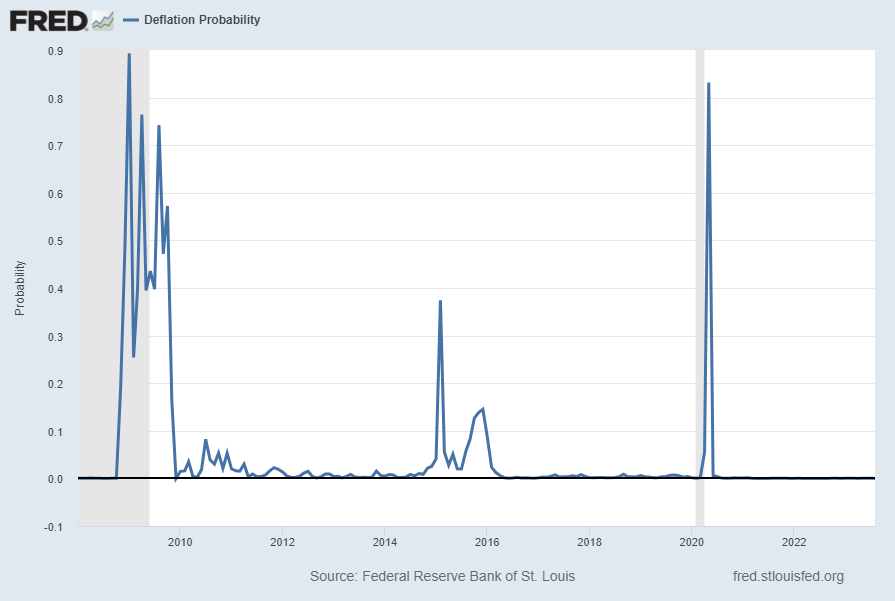
Here is this same U.S. deflation probability measure since 2008:
source: Federal Reserve Bank of St. Louis, Deflation Probability [STLPPMDEF], retrieved from FRED, Federal Reserve Bank of St. Louis; accessed August 31, 2023: https://fred.stlouisfed.org/series/STLPPMDEF
_________
I post various economic indicators and indices because I believe they should be carefully monitored. However, as those familiar with this site are aware, I do not necessarily agree with what they depict or imply.
_____
The Special Note summarizes my overall thoughts about our economic situation
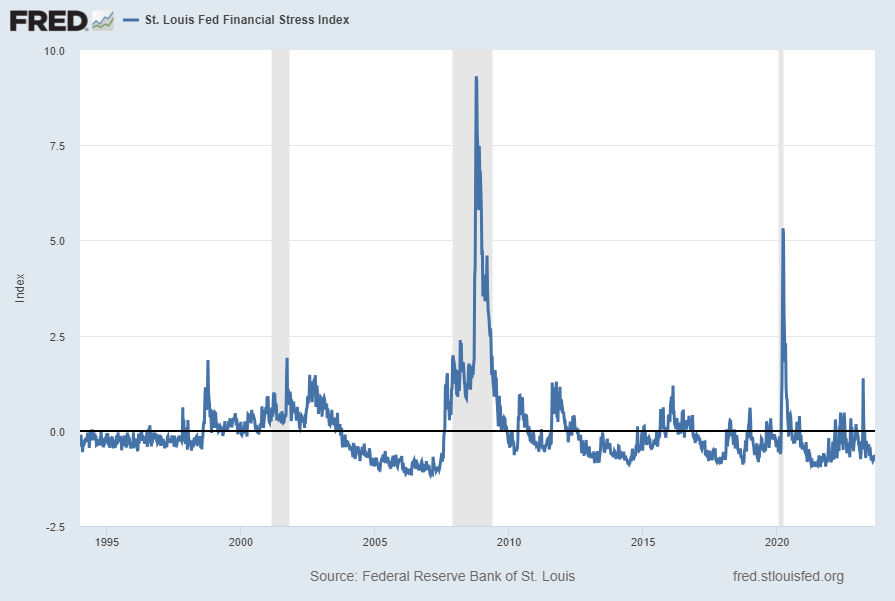
The St. Louis Fed’s Financial Stress Index (STLFSI4) is one index that is supposed to measure stress in the financial system. Its reading as of the August 31, 2023 update (reflecting data through August 25, 2023) is -.7220:
source: Federal Reserve Bank of St. Louis, St. Louis Fed Financial Stress Index [STLFSI4], retrieved from FRED, Federal Reserve Bank of St. Louis; accessed August 31, 2023: https://fred.stlouisfed.org/series/STLFSI4
Of course, there are a variety of other measures and indices that are supposed to measure financial stress and other related issues, both from the Federal Reserve as well as from private sources.
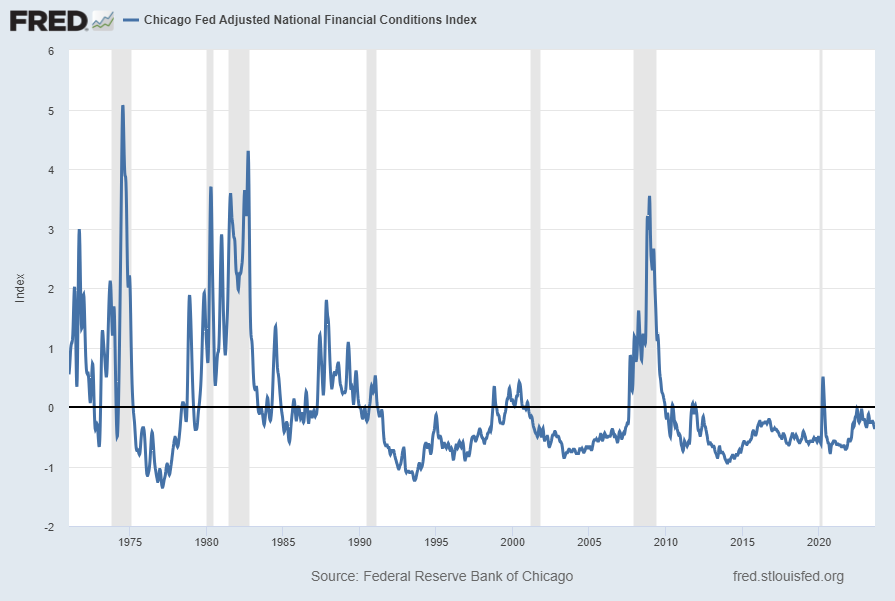
Two other indices that I regularly monitor include the Chicago Fed National Financial Conditions Index (NFCI) as well as the Chicago Fed Adjusted National Financial Conditions Index (ANFCI).
Here are summary descriptions of each, as seen in FRED:
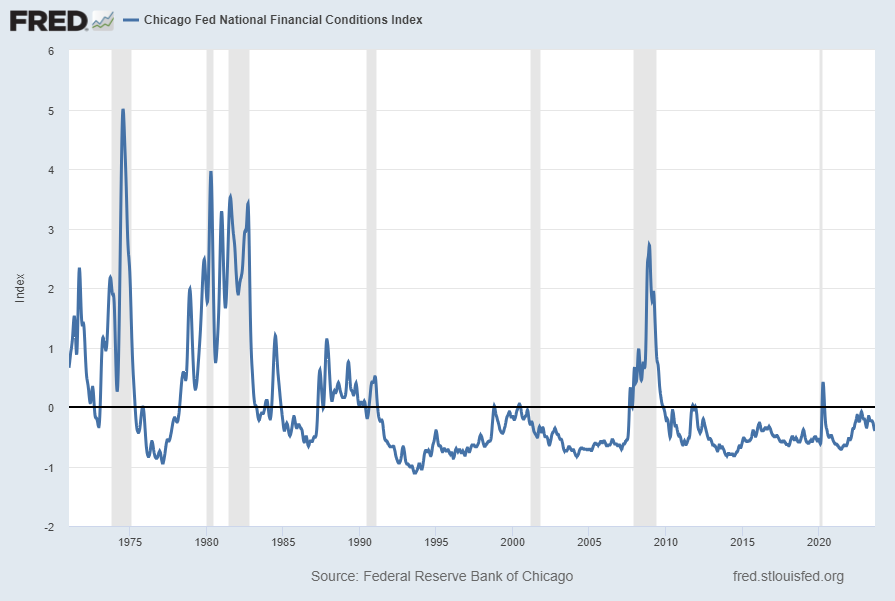
The National Financial Conditions Index (NFCI) measures risk, liquidity and leverage in money markets and debt and equity markets as well as in the traditional and “shadow” banking systems. Positive values of the NFCI indicate financial conditions that are tighter than average, while negative values indicate financial conditions that are looser than average.
The adjusted NFCI (ANFCI). This index isolates a component of financial conditions uncorrelated with economic conditions to provide an update on how financial conditions compare with current economic conditions.
For further information, please visit the Federal Reserve Bank of Chicago’s web site:
Below are the most recently updated charts of the NFCI and ANFCI, respectively.
The NFCI chart below was last updated on August 30, 2023 incorporating data from January 8, 1971 through August 25, 2023 on a weekly basis. The August 25 value is -.40:
The ANFCI chart below was last updated on August 30, 2023 incorporating data from January 8, 1971 through August 25, 2023, on a weekly basis. The August 25, 2023 value is -.35:
I post various indicators and indices because I believe they should be carefully monitored. However, as those familiar with this site are aware, I do not necessarily agree with what they depict or imply.
_____
The Special Note summarizes my overall thoughts about our economic situation
In the last post (“2nd Quarter 2023 Corporate Profits“) I displayed, for reference purposes, a long-term chart depicting Corporate Profits After Tax.
There are many ways to view this measure, both on an absolute as well as relative basis.
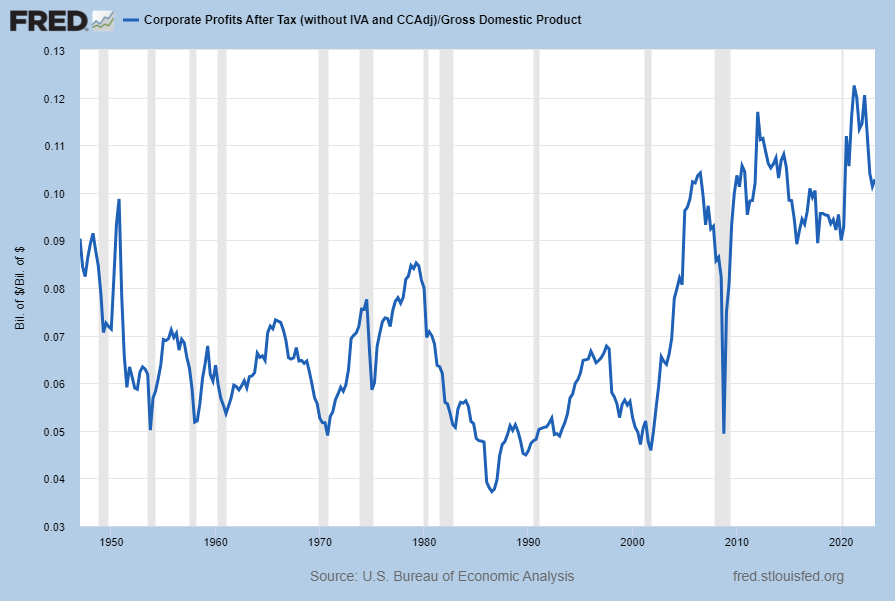
One relative measure is viewing Corporate Profits as a Percentage of GDP. I feel that this metric is important for a variety of reasons. As well, the measure is important to a variety of parties, including investors, businesses, and government policy makers.
As one can see from the long-term chart below (updated through the second quarter), (After Tax) Corporate Profits as a Percentage of GDP is still at levels that can be seen as historically high. While there are many reasons as to why this is so, from a going-forward standpoint I think it is important to recognize both that such a notable condition exists, as well as contemplate and/or plan for such factors and conditions that would come about if (and in my opinion “when”) a more historically “normal” ratio of Corporate Profits as a Percentage of GDP occurs. This topic can be very complex in nature, and depends upon myriad factors. In my opinion it deserves far greater recognition.
(click on chart to enlarge image)
Data Source: FRED, Federal Reserve Economic Data, Federal Reserve Bank of St. Louis; accessed August 30, 2023
_____
The Special Note summarizes my overall thoughts about our economic situation
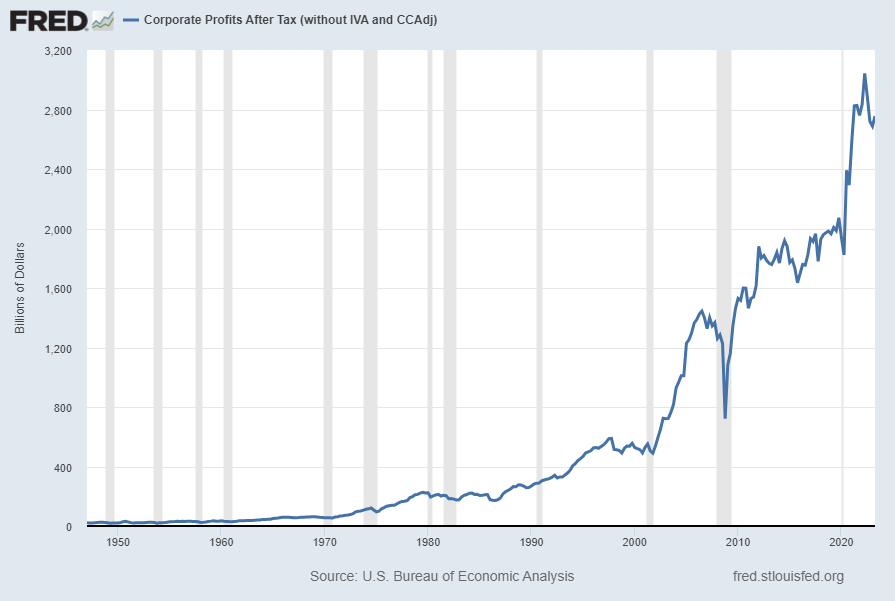
Today’s (August 30, 2023) GDP release (Q2 2023, Second Estimate) was accompanied by the Bureau of Economic Analysis (BEA) Corporate Profits report (Preliminary Estimate) for the 2nd Quarter.
Of course, there are many ways to adjust and depict overall Corporate Profits. For reference purposes, here is a chart from the St. Louis Federal Reserve (FRED) showing the Corporate Profits After Tax (without IVA and CCAdj) (last updated August 30, 2023 with a value of $2755.552 Billion SAAR):
–
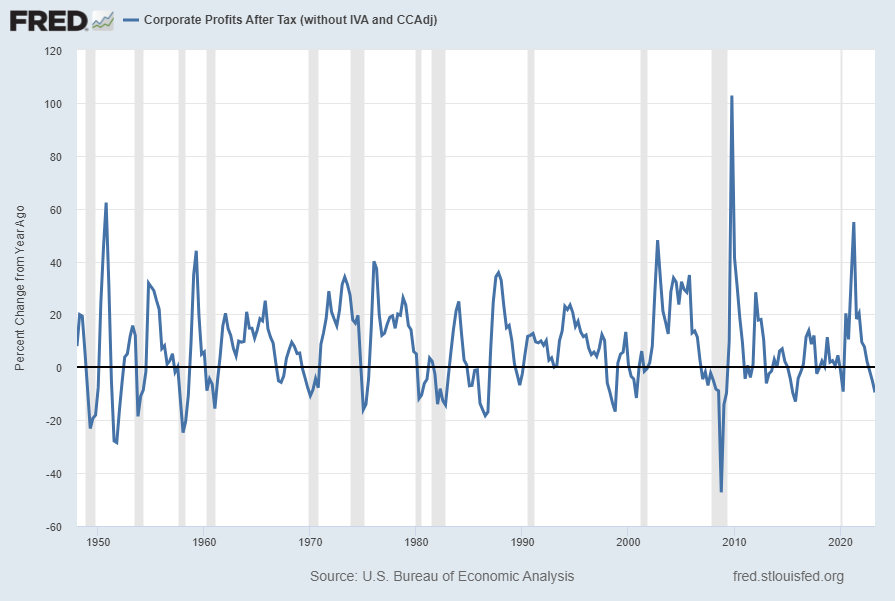
Here is the Corporate Profits After Tax measure shown on a Percentage Change from a Year Ago perspective (value of -9.4%):
Data Source: FRED, Federal Reserve Economic Data, Federal Reserve Bank of St. Louis: Corporate Profits After Tax [CP]; U.S. Department of Commerce: Bureau of Economic Analysis; accessed August 30, 2023; https://research.stlouisfed.org/fred2/series/CP
_________
I post various indicators and indices because I believe they should be carefully monitored. However, as those familiar with this site are aware, I do not necessarily agree with what they depict or imply.
_____
The Special Note summarizes my overall thoughts about our economic situation
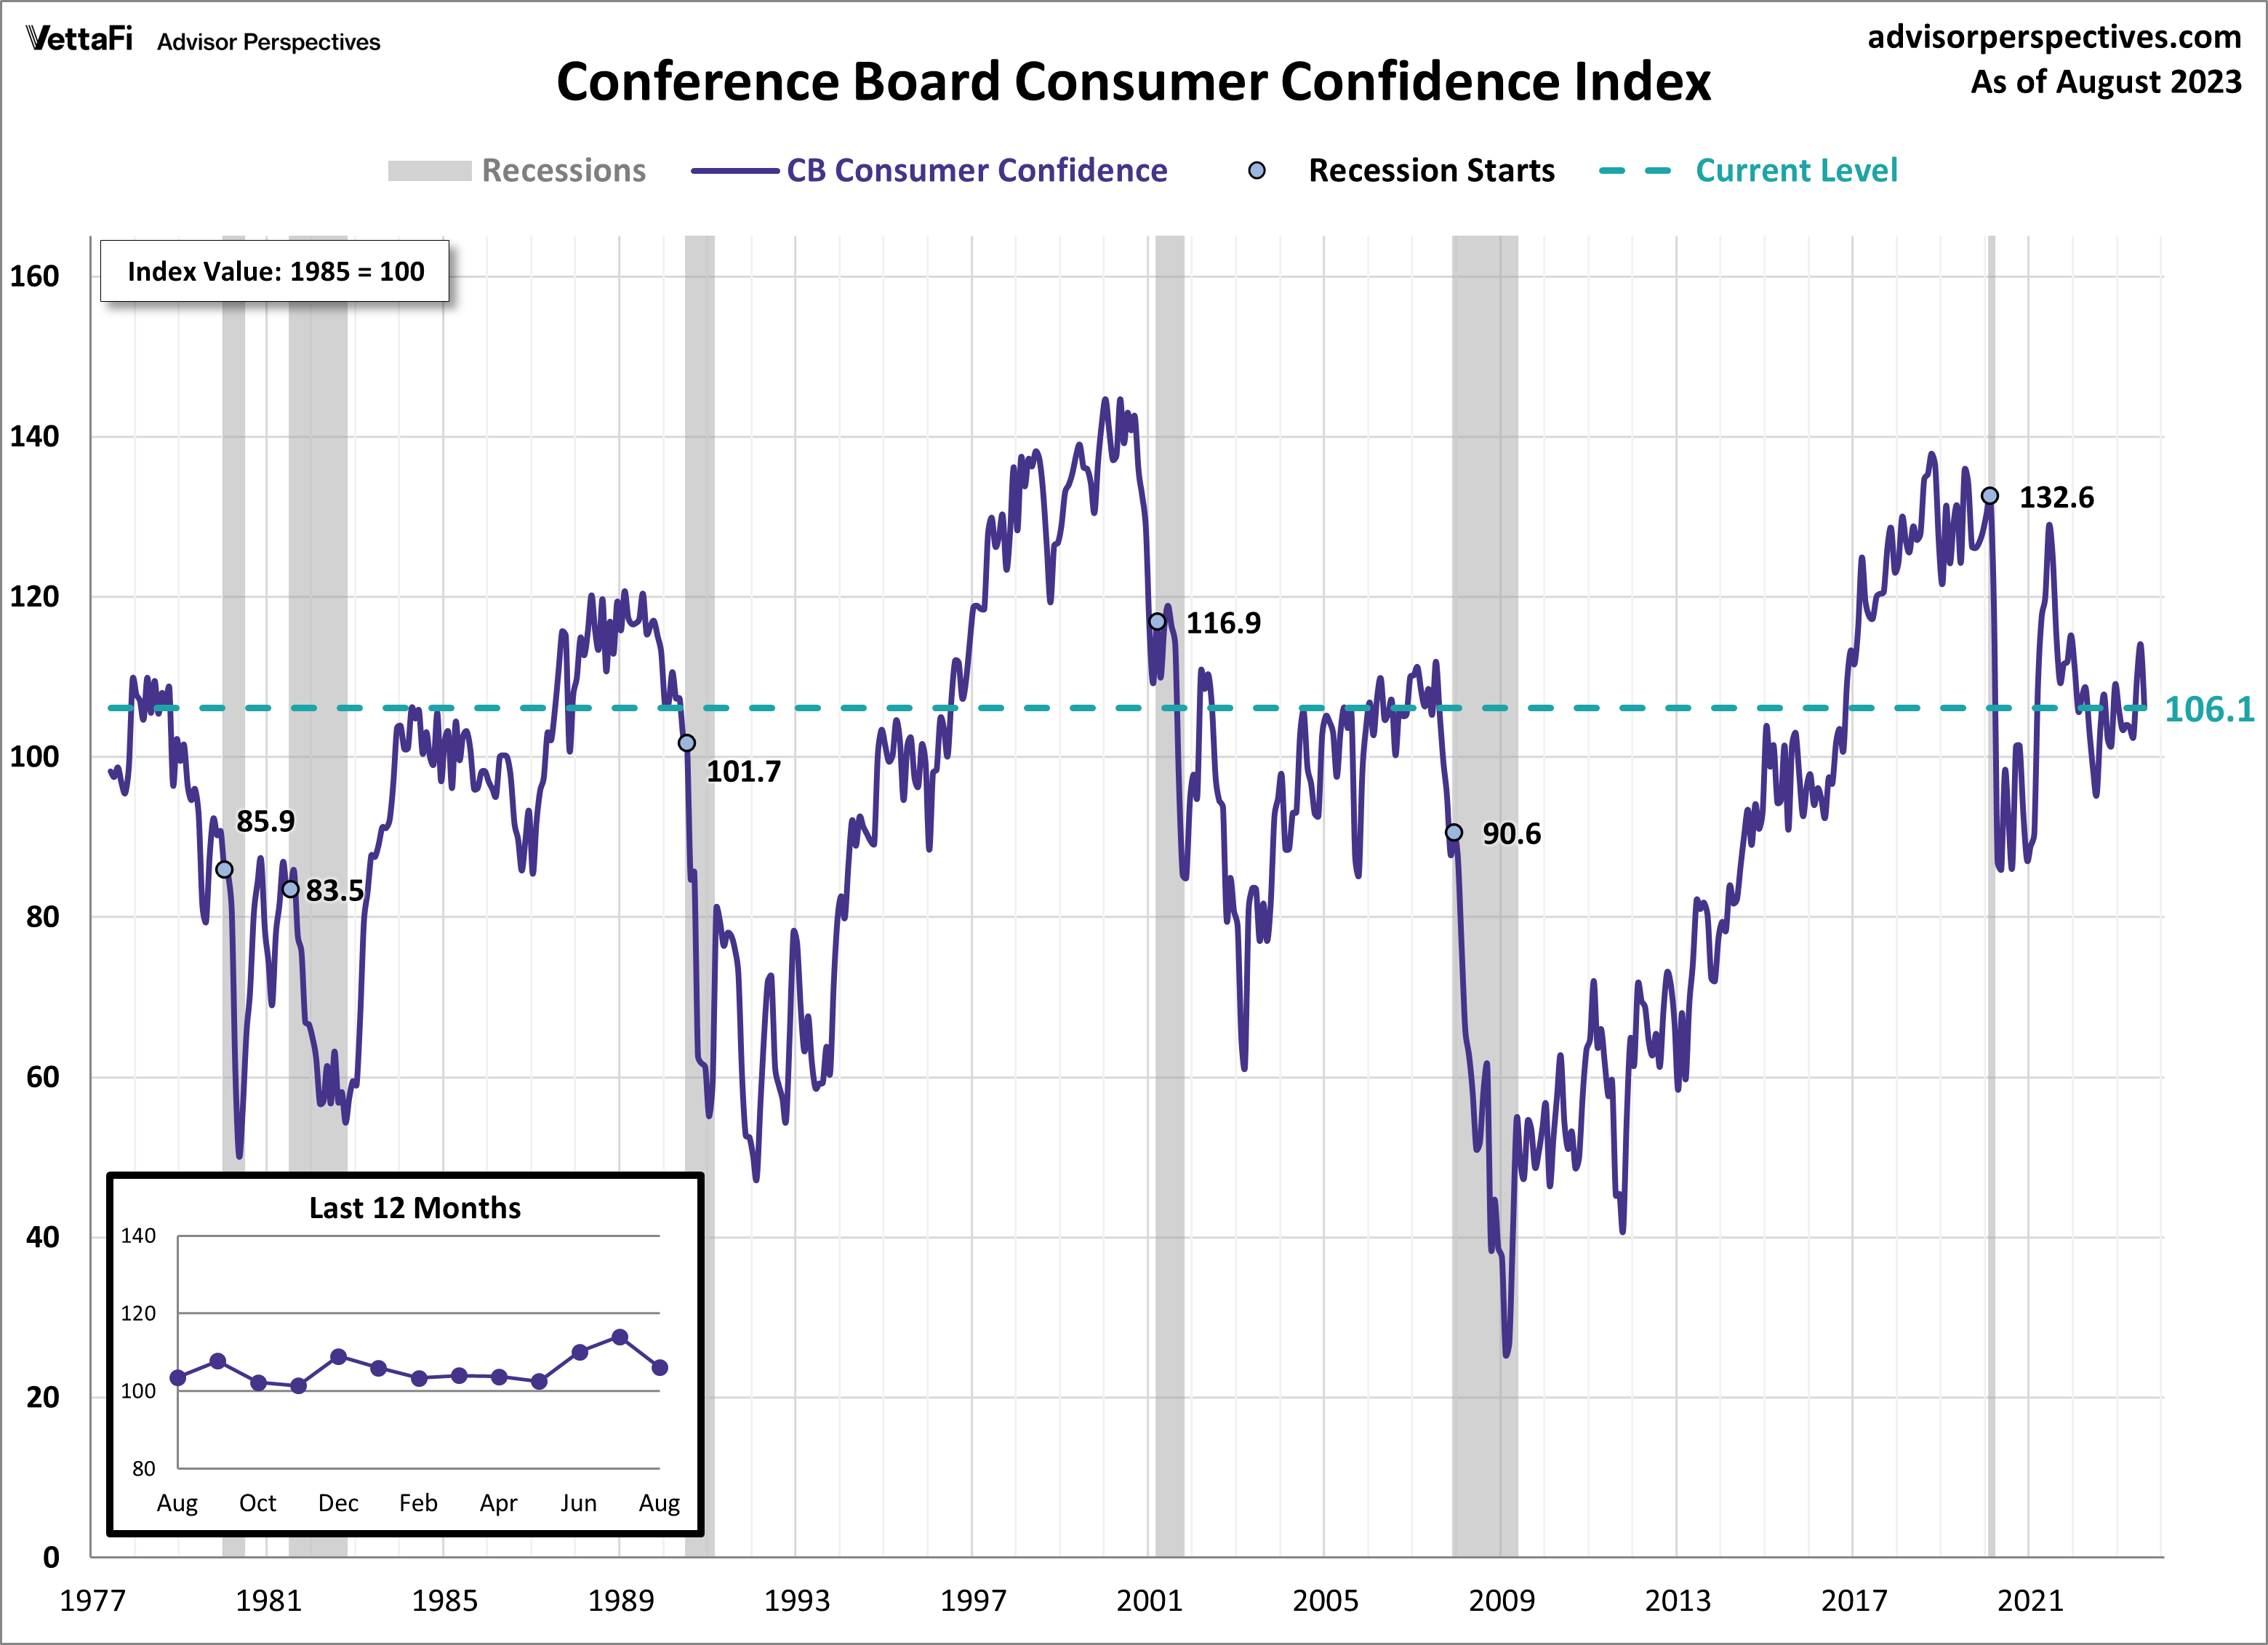
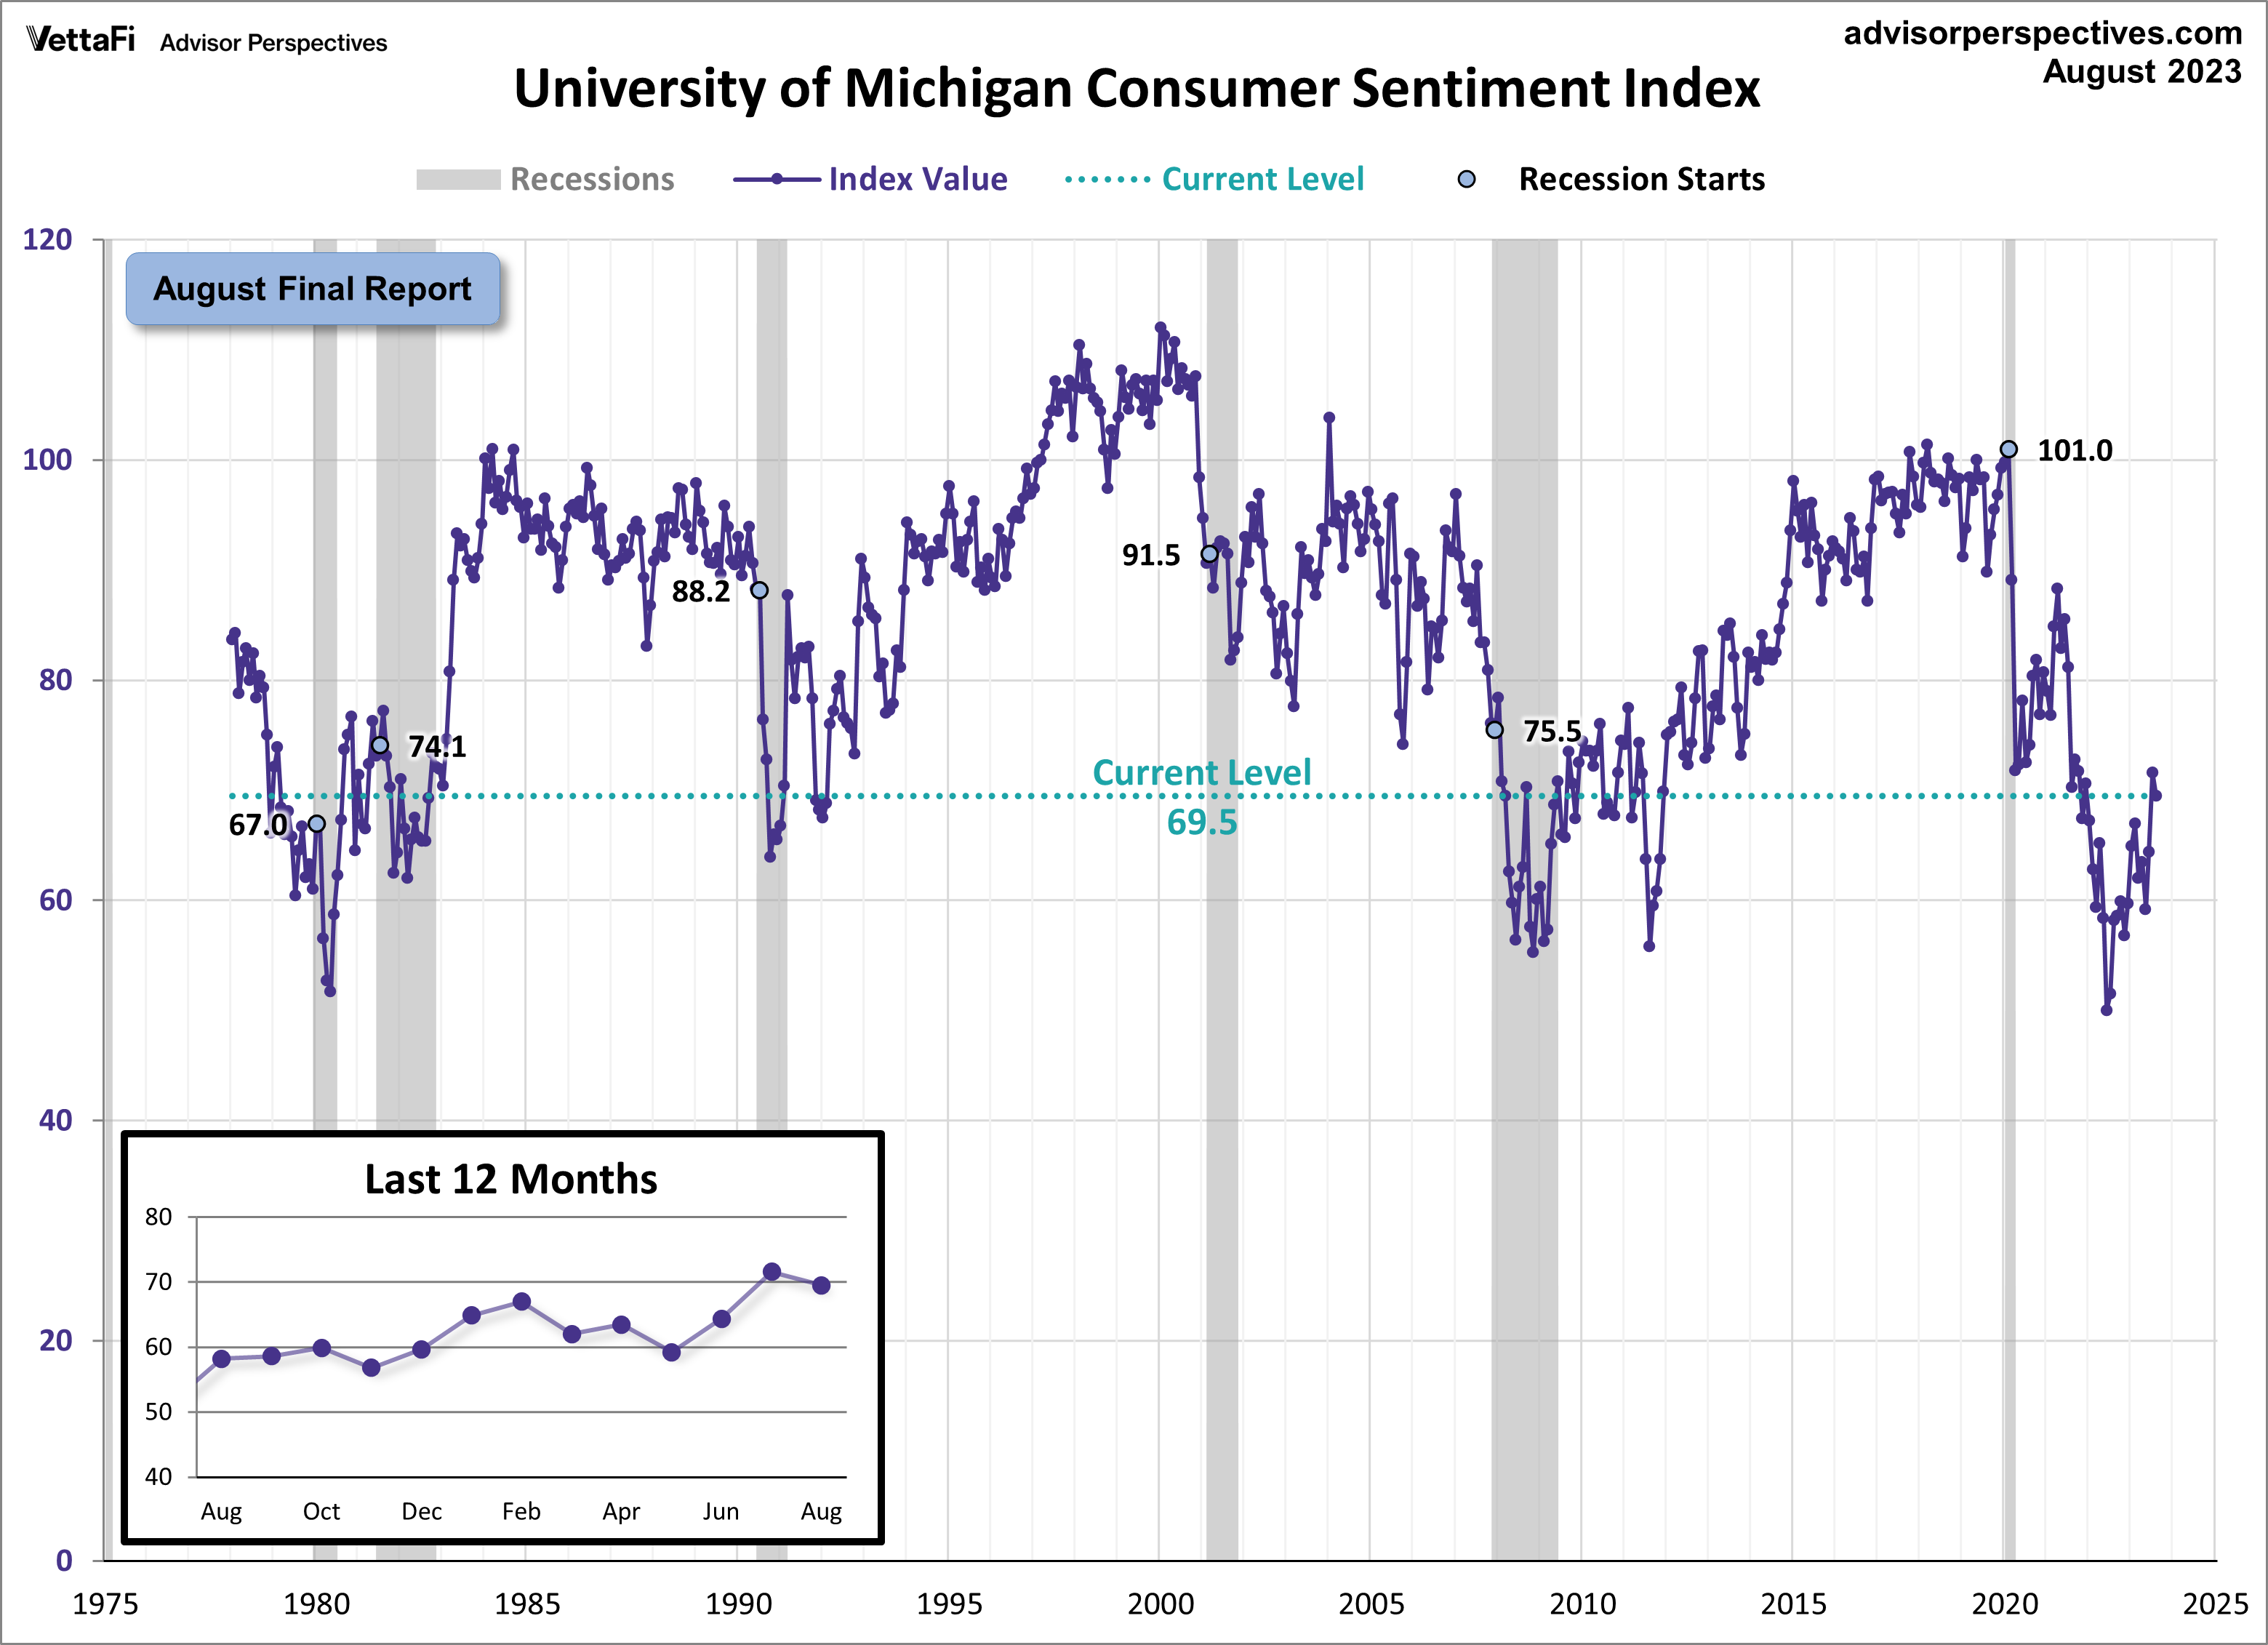
Advisor Perspectives had a post of August 29, 2023 (“Consumer Confidence Pulls Back in August“) that displays the latest Conference Board Consumer Confidence and University of Michigan Consumer Sentiment Index charts. They are presented below:
(click on charts to enlarge images)
–
–
While I don’t believe that confidence surveys should be overemphasized, I find these readings and trends to be notable, especially in light of a variety of other highly disconcerting measures highlighted throughout this site.
_____
The Special Note summarizes my overall thoughts about our economic situation
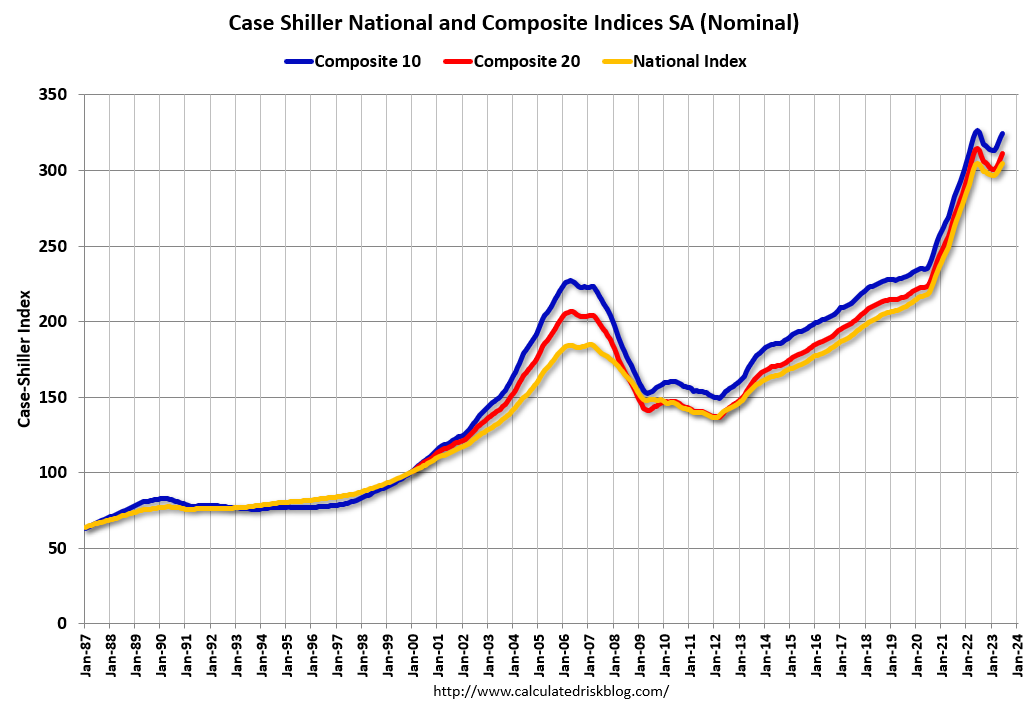
As a reference for long-term house price index trends, below is a chart, updated with the most current data (through June) from the CalculatedRisk blog post of August 29, 2023 titled “Case-Shiller : National House Price Index…“:
_________
I post various indicators and indices because I believe they should be carefully monitored. However, as those familiar with this site are aware, I do not necessarily agree with what they depict or imply.
_____
The Special Note summarizes my overall thoughts about our economic situation
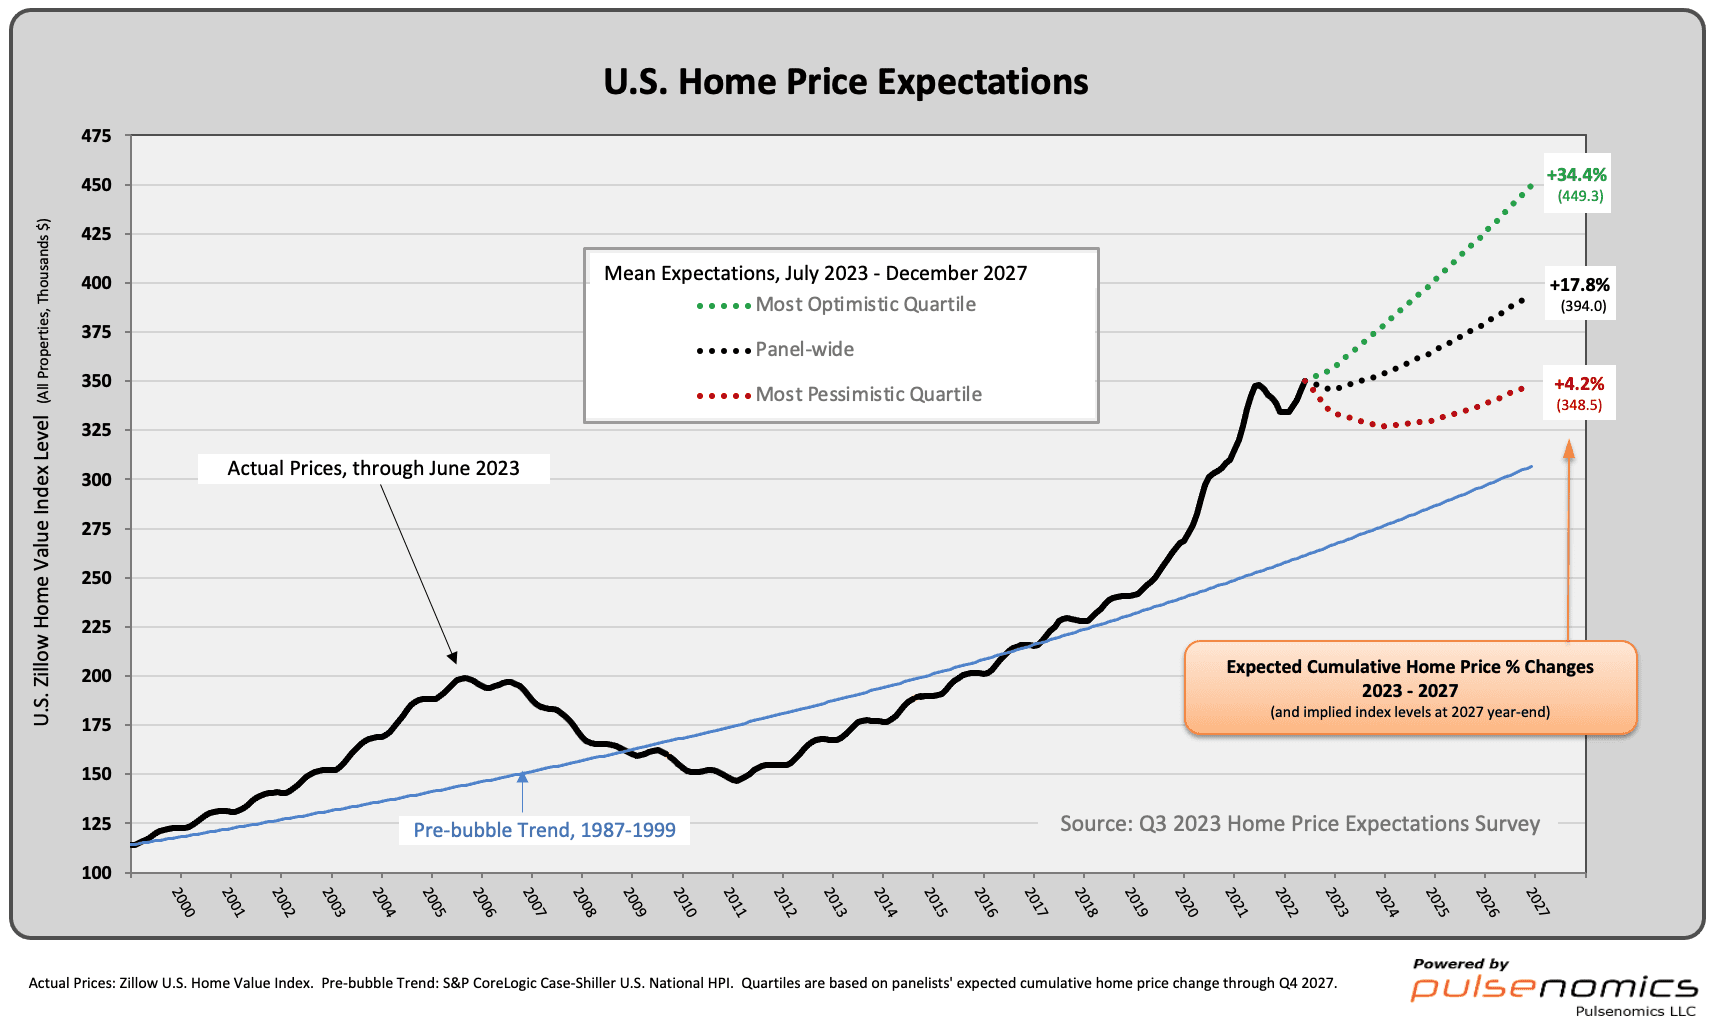
As one can see from the above chart, the average expectation is that the residential real estate market, as depicted by the U.S. Zillow Home Value Index, will (largely) continually climb.
The detail of the Q3 2023 Home Price Expectations Survey is interesting. Of the 107 survey respondents, only 5 (of the displayed responses) forecasts a cumulative price decrease through 2027.
The Median Cumulative Home Price Appreciation for years 2023-2027 is seen as 4.0%, 6.40%, 8.64%, 13.08%, and 17.04%, respectively.
For a variety of reasons, I continue to believe that these forecasts will prove far too optimistic in hindsight.
I have written extensively about the residential real estate situation. For a variety of reasons, it is exceedingly complex. While many people continue to have an optimistic view regarding future residential real estate prices, in my opinion such a view is unsupported on an “all things considered” basis. Residential real estate is an exceedingly large asset bubble. As such, from these price levels there exists potential for a price decline of outsized magnitude.
_____
The Special Note summarizes my overall thoughts about our economic situation
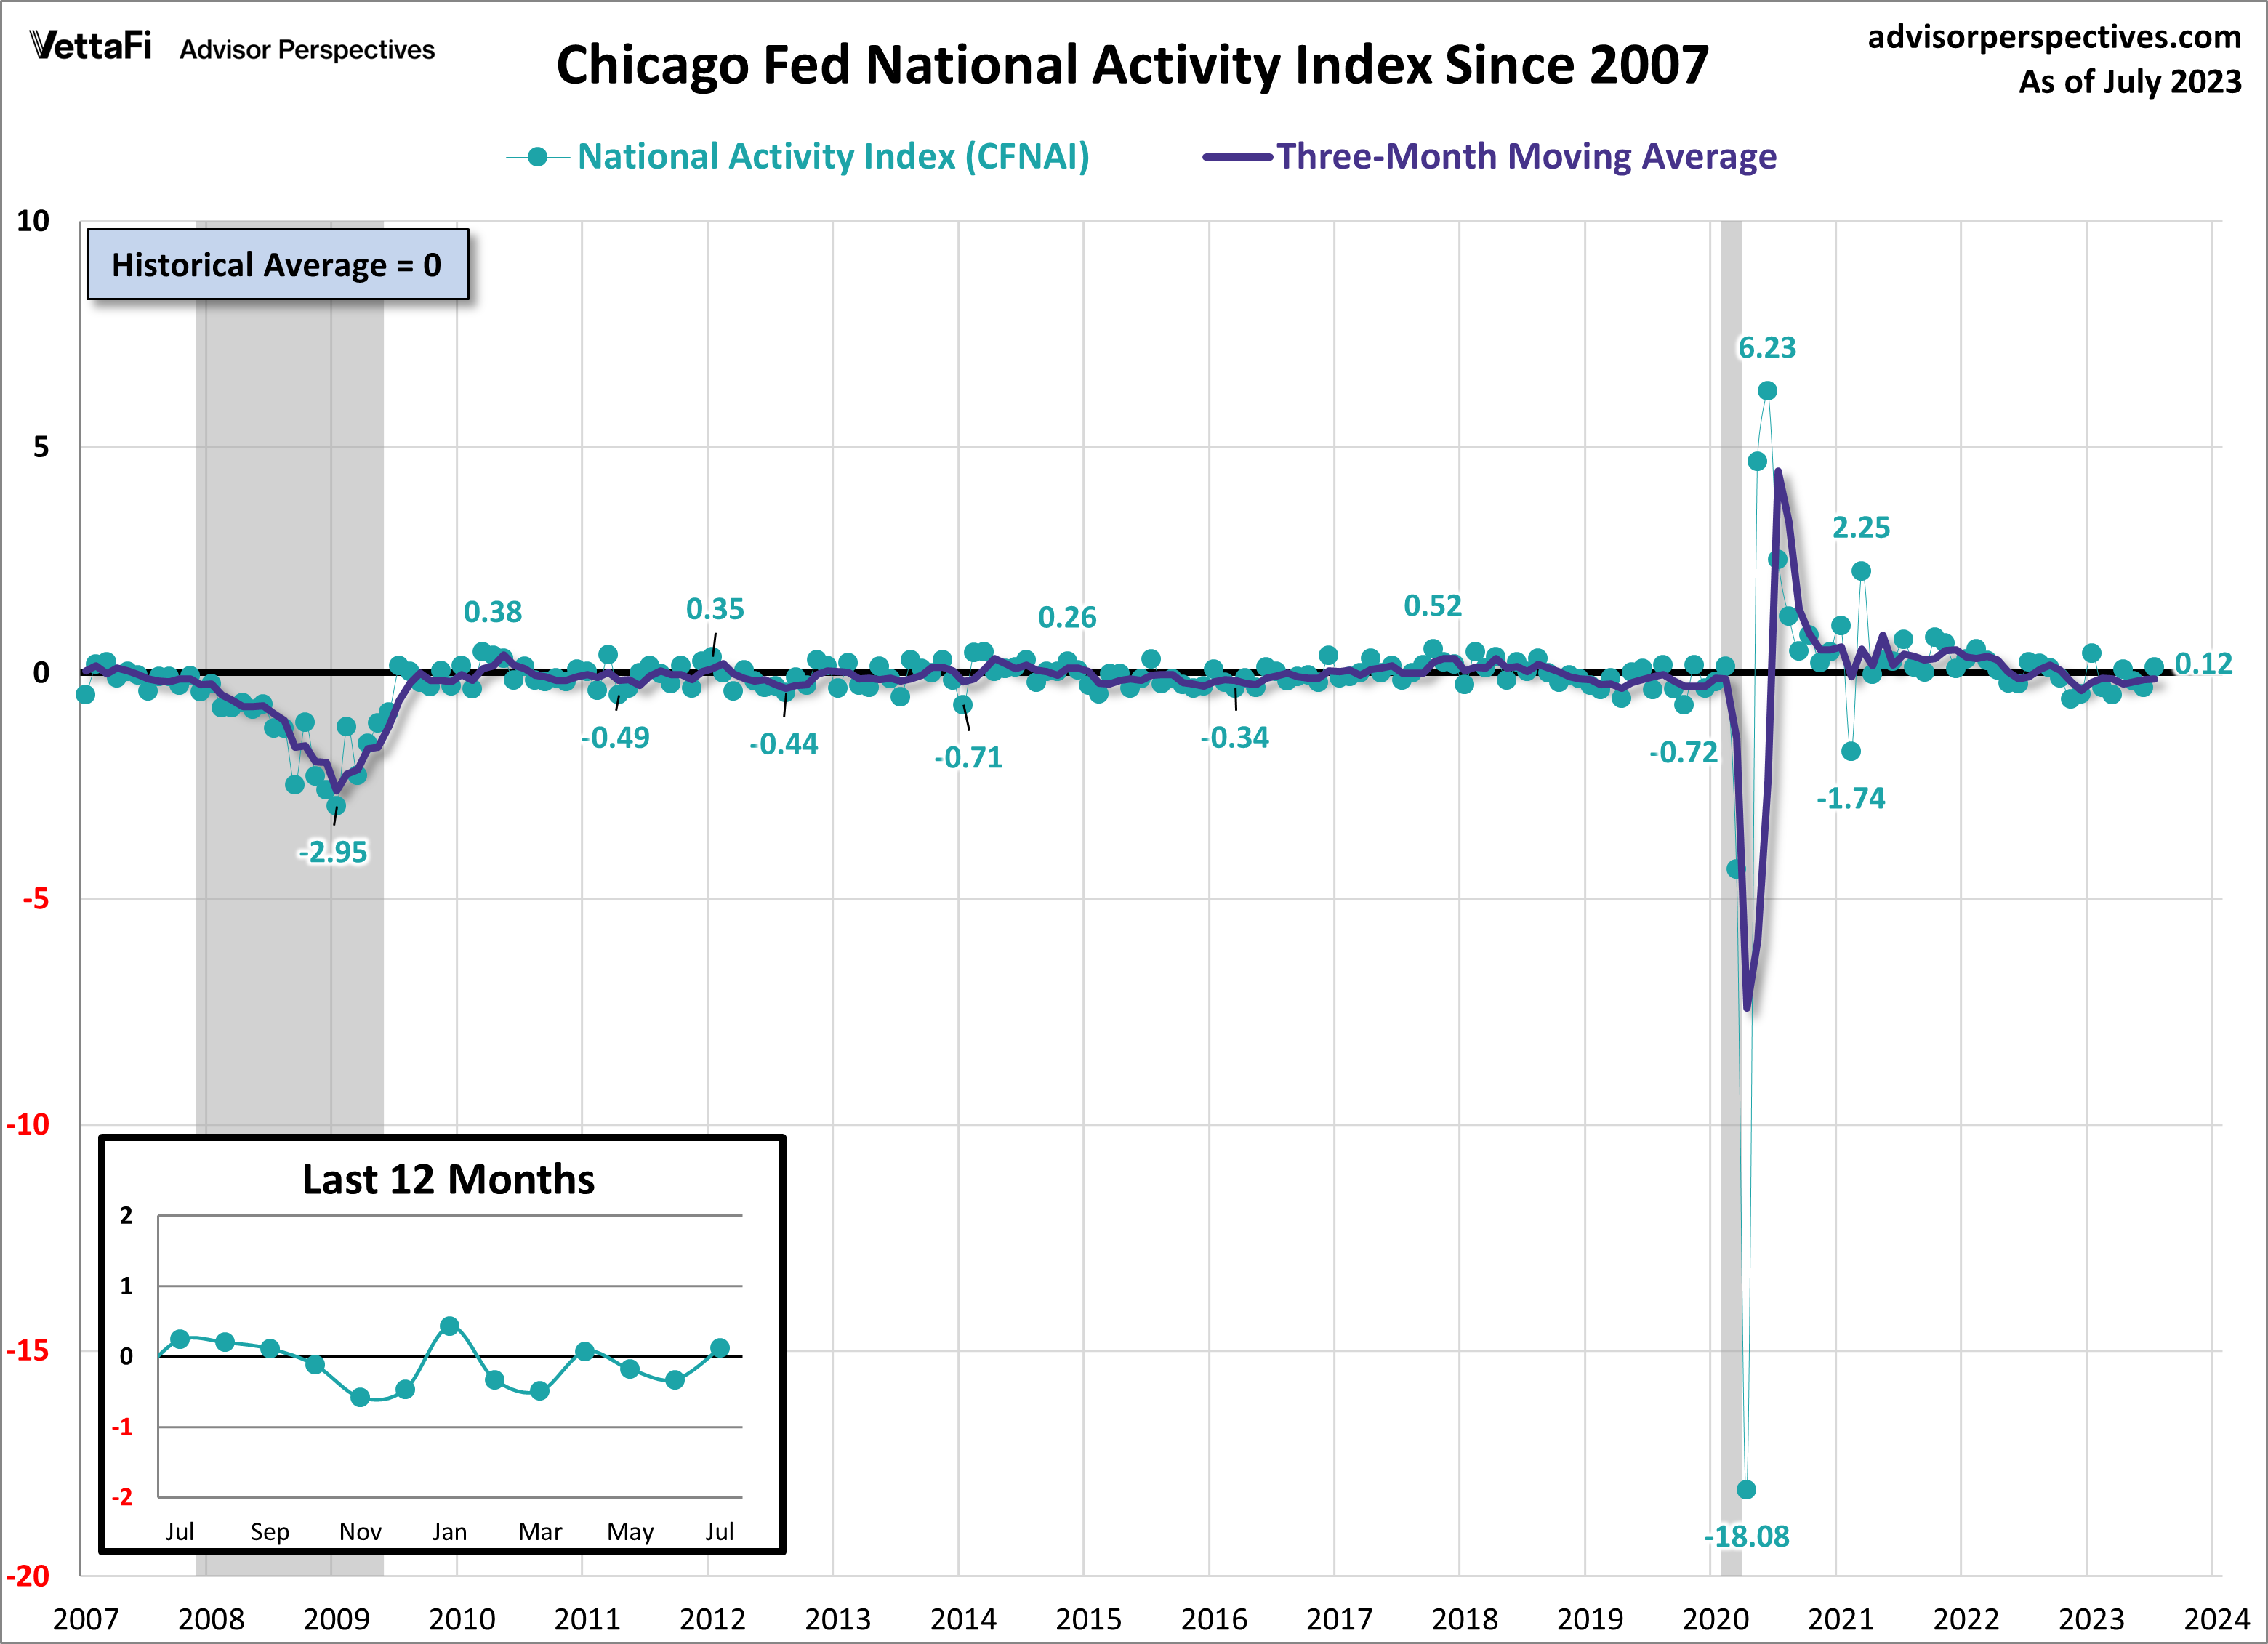
The following is an update of various indicators that are supposed to predict and/or depict economic activity. These indicators have been discussed in previous blog posts:
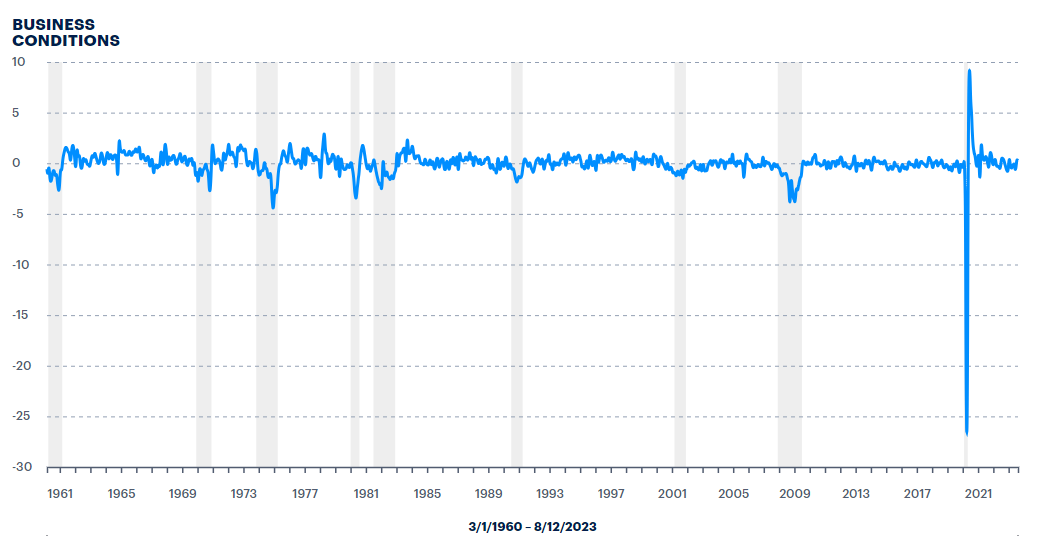
The ADS Index as of August 17, 2023, reflecting data from March 1, 1960 through August 12, 2023, with last value .264792:
–
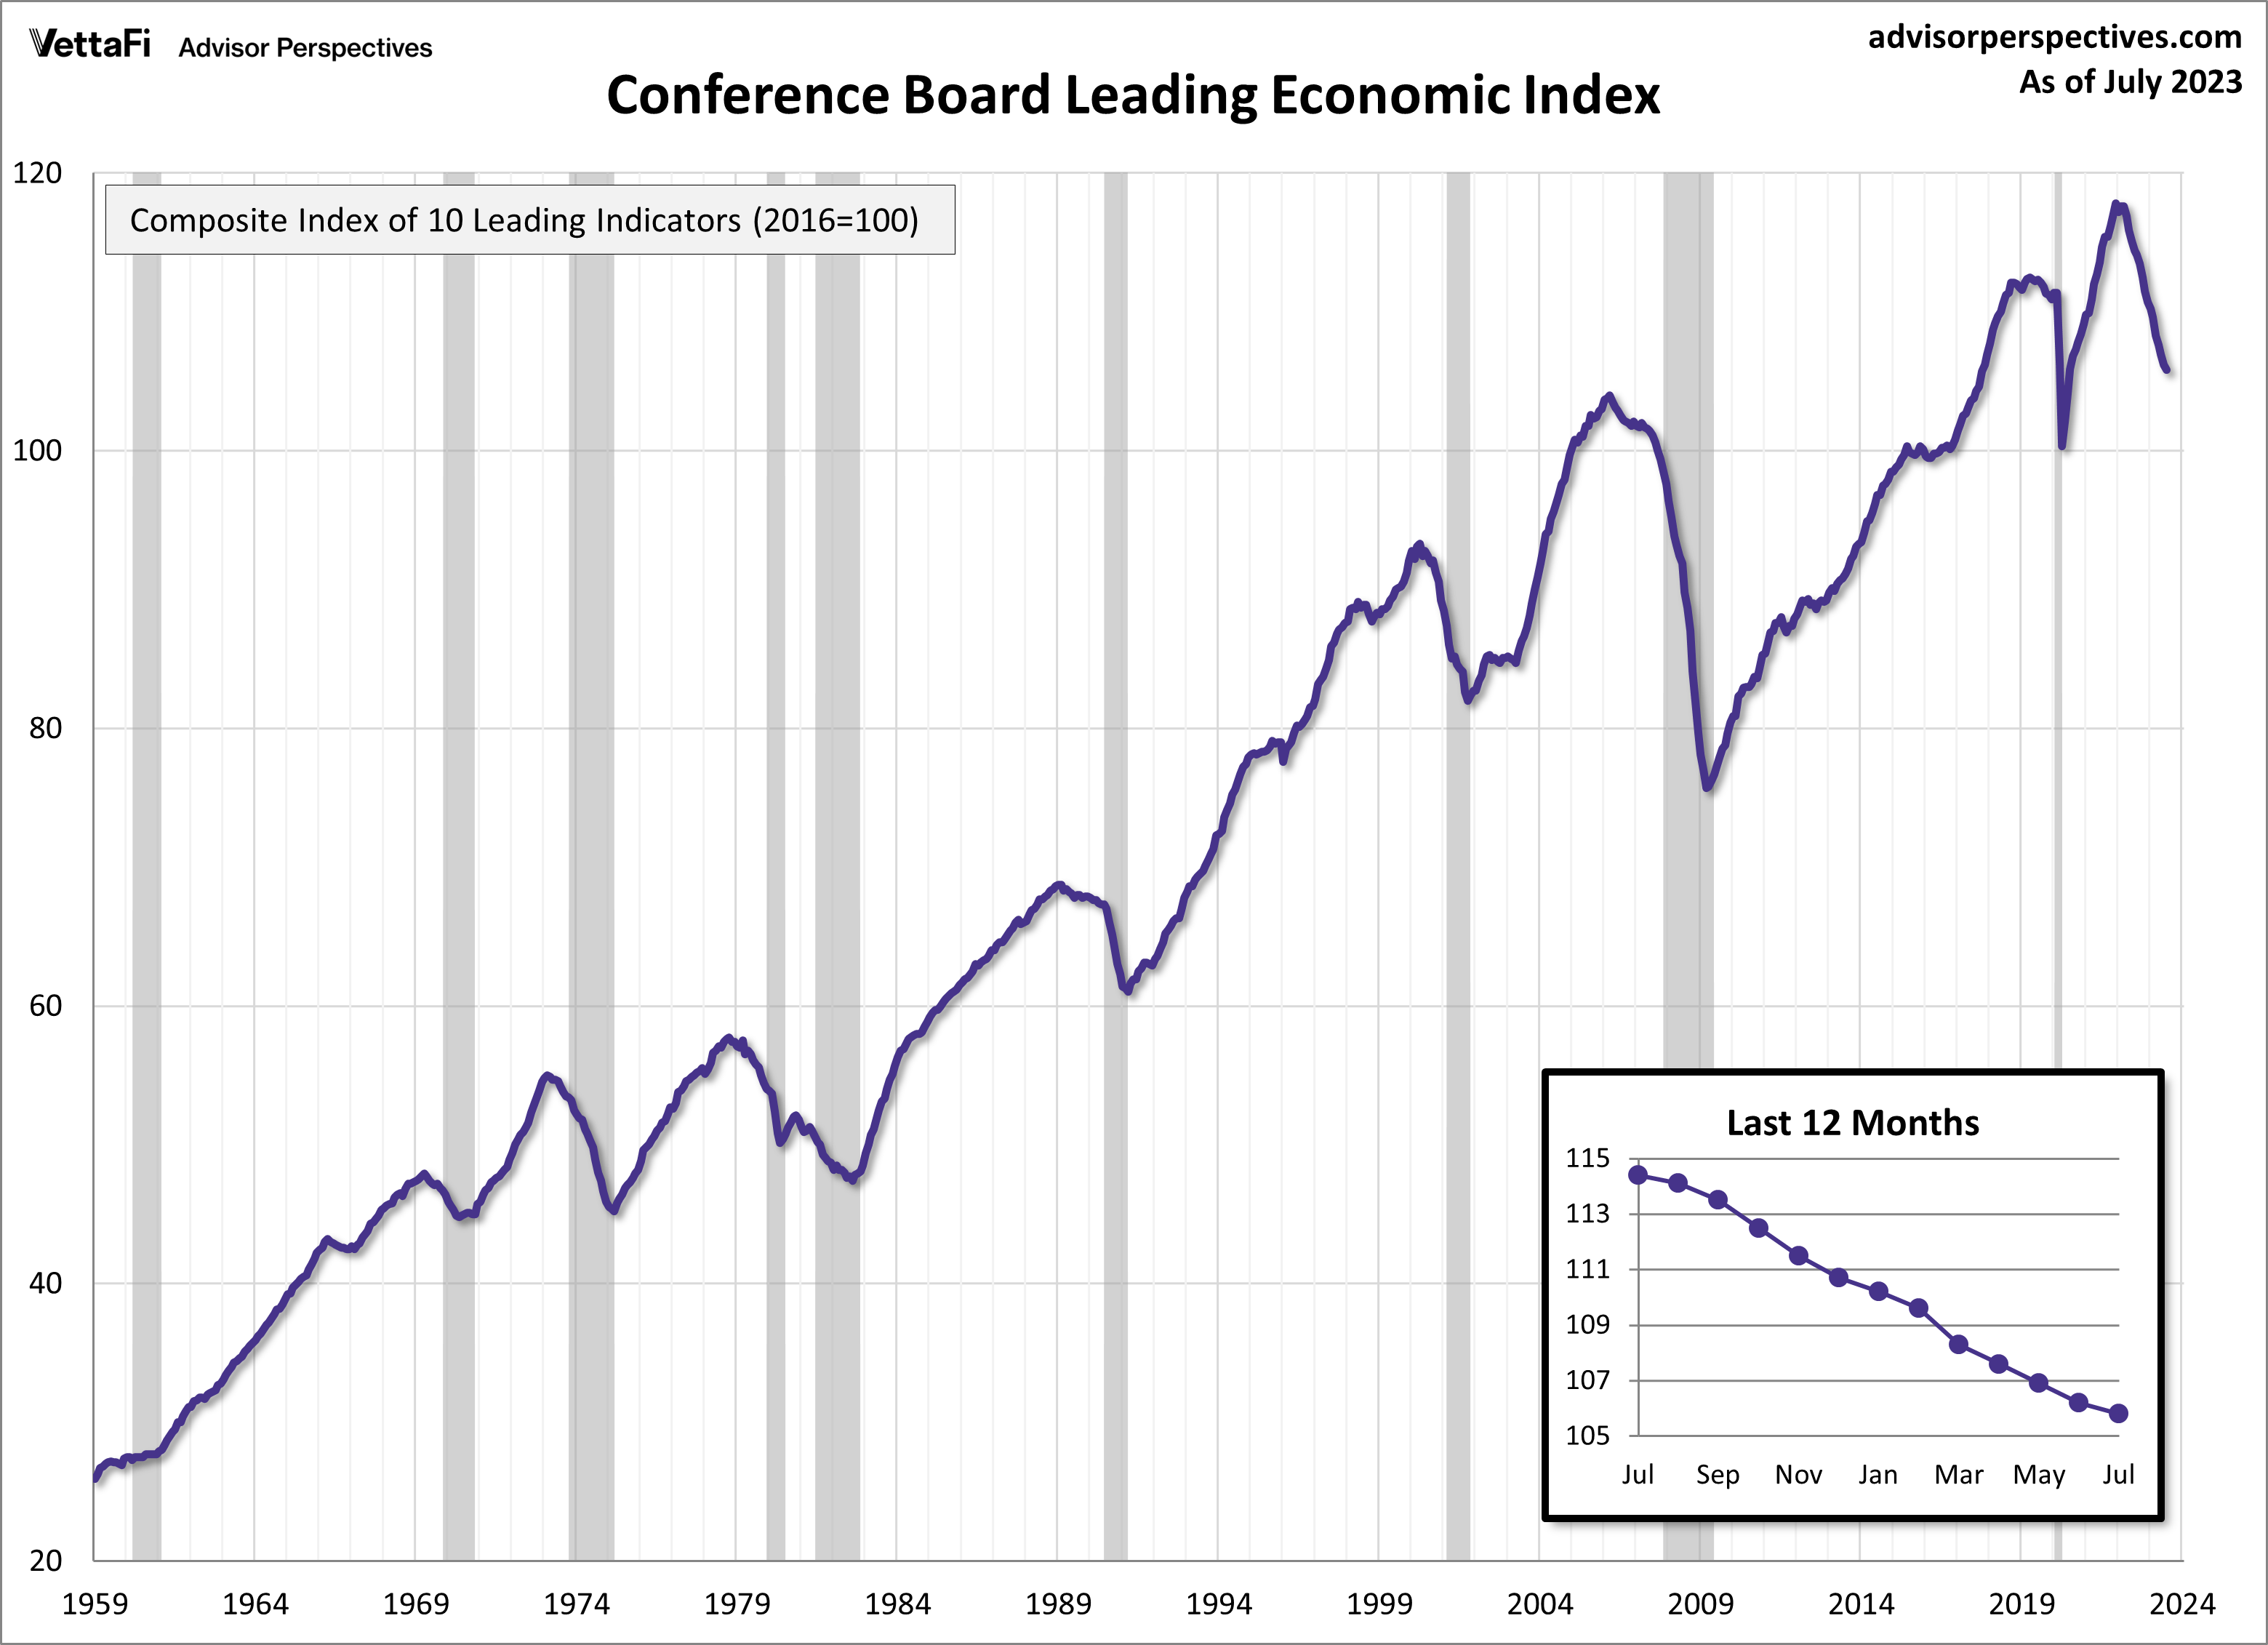
The Conference Board Leading Economic Index (LEI), Coincident Economic Index (CEI), and Lagging Economic Index (LAG):
As per the August 17, 2023 Conference Board press release the LEI was 105.8 in July, the CEI was 110.5 in July, and the LAG was 118.3 in July.
An excerpt from the release:
“The US LEI—which tracks where the economy is heading—fell for the sixteenth consecutive month in July, signaling the outlook remains highly uncertain” said Justyna Zabinska-La Monica, Senior Manager, Business Cycle Indicators, at The Conference Board. “On the other hand, the coincident index (CEI)—which tracks where economic activity stands right now—has continued to grow slowly but inconsistently, with three of the past six months not changing and the rest increasing. As such, the CEI is signaling that we are currently still in a favorable growth environment. However, in July, weak new orders, high interest rates, a dip in consumer perceptions of the outlook for business conditions, and decreasing hours worked in manufacturing fueled the leading indicator’s 0.4 percent decline. The leading index continues to suggest that economic activity is likely to decelerate and descend into mild contraction in the months ahead. The Conference Board now forecasts a short and shallow recession in the Q4 2023 to Q1 2024 timespan.”
I post various indicators and indices because I believe they should be carefully monitored. However, as those familiar with this site are aware, I do not necessarily agree with what they depict or imply.
_____
The Special Note summarizes my overall thoughts about our economic situation
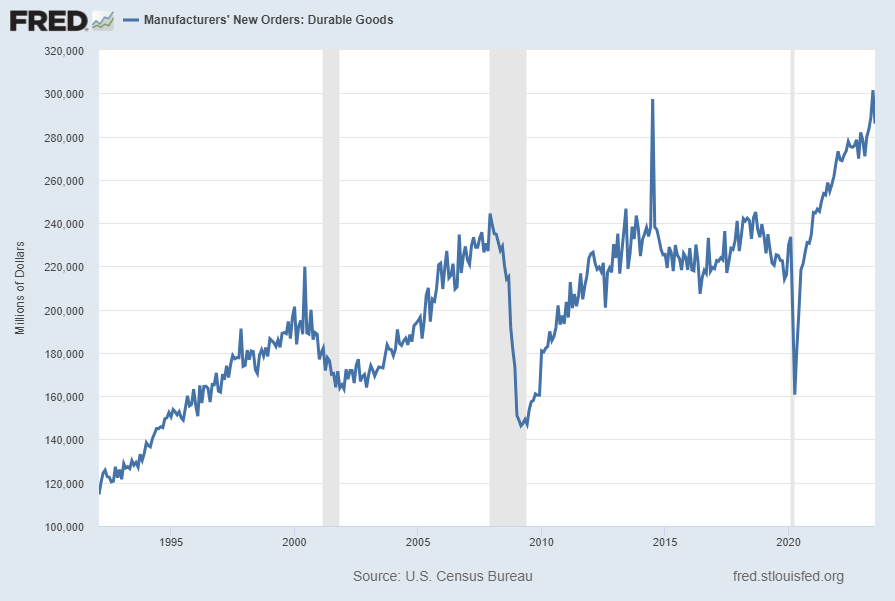
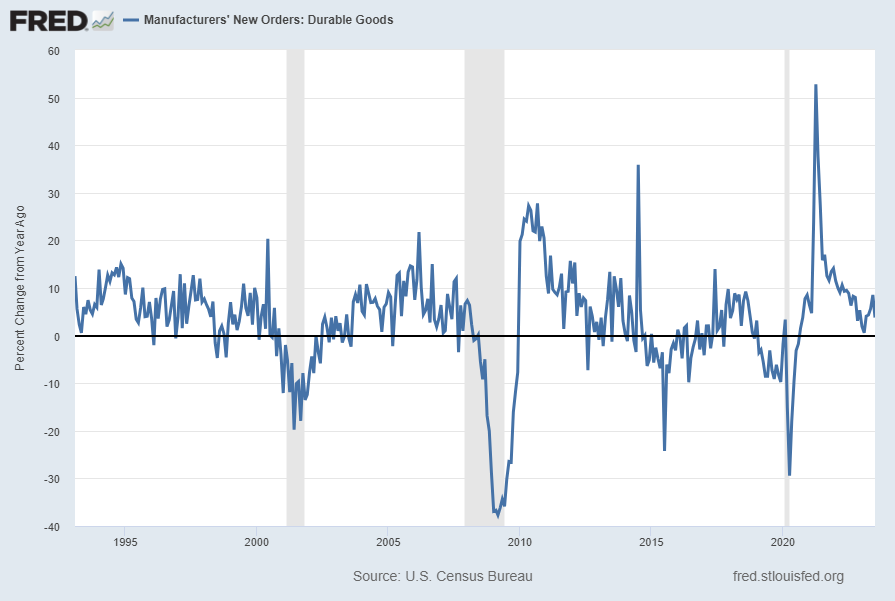
Many people place emphasis on Durable Goods New Orders as a prominent economic indicator and/or leading economic indicator.
For reference, below are two charts depicting this measure.
First, from the St. Louis Fed site (FRED), a chart through July 2023, updated on August 24, 2023. This value is $285,931 ($ Millions):
(click on charts to enlarge images)
–
Second, here is the chart depicting this measure on a “Percent Change from a Year Ago” basis, with a last value of 3.8%:
Data Source: FRED, Federal Reserve Economic Data, Federal Reserve Bank of St. Louis: Manufacturers’ New Orders: Durable Goods [DGORDER]; U.S. Department of Commerce: Census Bureau; accessed August 24, 2023; http://research.stlouisfed.org/fred2/series/DGORDER
_________
I post various indicators and indices because I believe they should be carefully monitored. However, as those familiar with this site are aware, I do not necessarily agree with what they depict or imply.
_____
The Special Note summarizes my overall thoughts about our economic situation
Perhaps the main reason that I write of our economic situation is that I continue to believe, based upon various analyses, that our economic situation is in many ways misunderstood. While no one likes to contemplate a future rife with economic adversity, current and future economic problems must be properly recognized and rectified if high-quality, sustainable long-term economic vitality is to be realized.
There are an array of indications and other “warning signs” – many readily apparent – that current economic activity and financial market performance is accompanied by exceedingly perilous dynamics.
I have written extensively about this peril, including in the following:
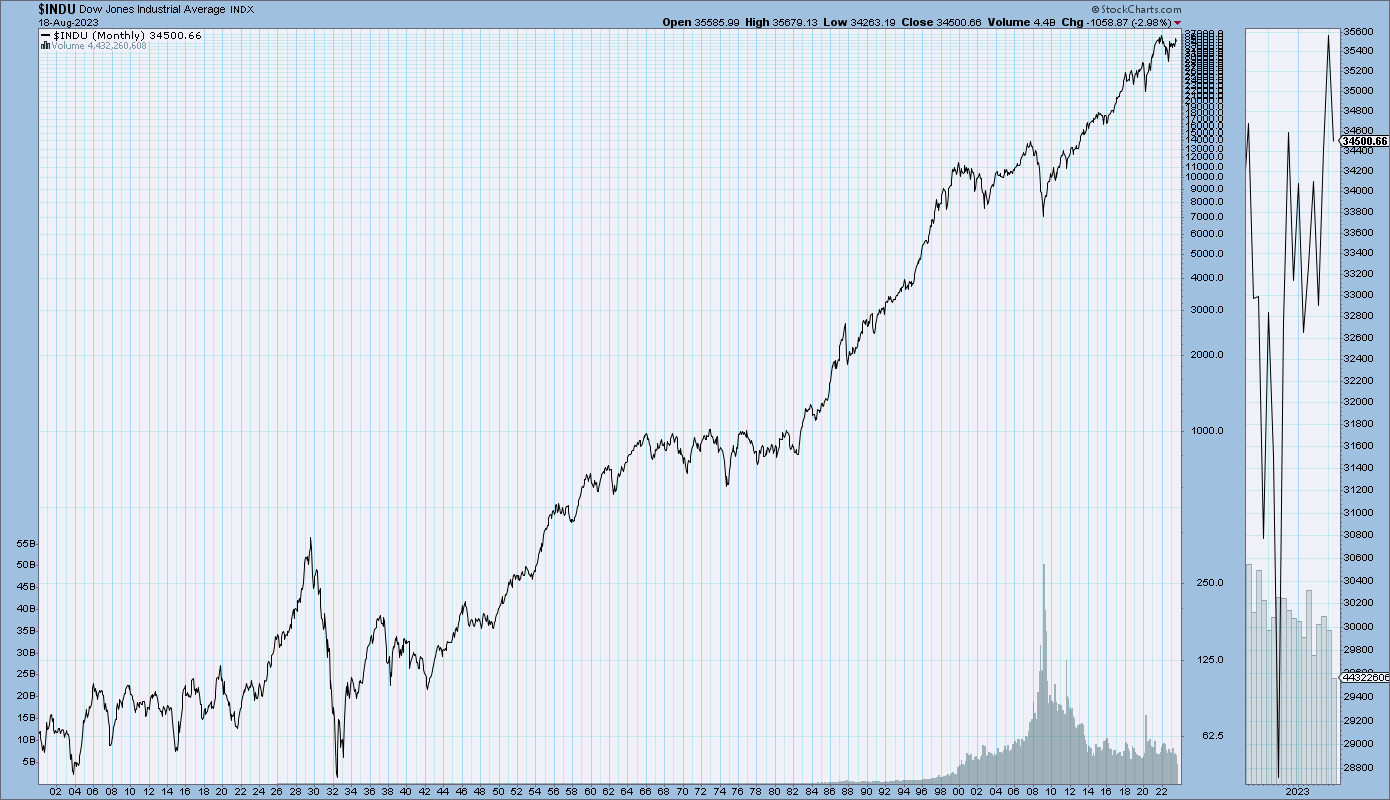
My analyses continues to indicate that the growing level of financial danger will lead to the next stock market crash that will also involve (as seen in 2008) various other markets as well. Key attributes of this next crash is its outsized magnitude (when viewed from an ultra-long term historical perspective) and the resulting economic impact. This next financial crash is of tremendous concern, as my analyses indicate it will lead to a Super Depression – i.e. an economy characterized by deeply embedded, highly complex, and difficult-to-solve problems.
For long-term reference purposes, here is a chart of the Dow Jones Industrial Average since 1900, depicted on a monthly basis using a LOG scale (updated through August 18, with a last value of 34,500.66):
(click on chart to enlarge image)(chart courtesy of StockCharts.com)
_____
The Special Note summarizes my overall thoughts about our economic situation
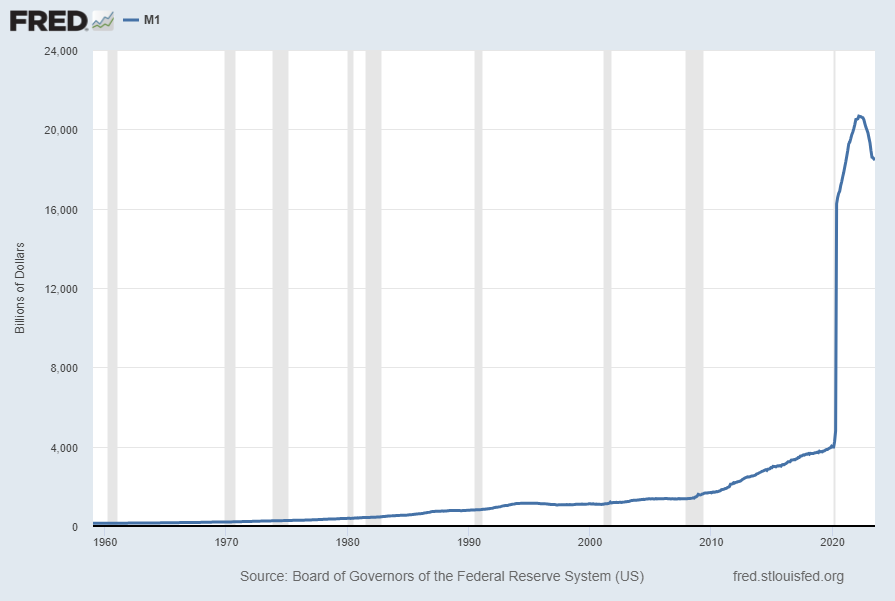
For reference purposes, below are two sets of charts depicting growth in the money supply.
The first shows the M1, defined in FRED as the following:
Before May 2020, M1 consists of (1) currency outside the U.S. Treasury, Federal Reserve Banks, and the vaults of depository institutions; (2) demand deposits at commercial banks (excluding those amounts held by depository institutions, the U.S. government, and foreign banks and official institutions) less cash items in the process of collection and Federal Reserve float; and (3) other checkable deposits (OCDs), consisting of negotiable order of withdrawal, or NOW, and automatic transfer service, or ATS, accounts at depository institutions, share draft accounts at credit unions, and demand deposits at thrift institutions.
Beginning May 2020, M1 consists of (1) currency outside the U.S. Treasury, Federal Reserve Banks, and the vaults of depository institutions; (2) demand deposits at commercial banks (excluding those amounts held by depository institutions, the U.S. government, and foreign banks and official institutions) less cash items in the process of collection and Federal Reserve float; and (3) other liquid deposits, consisting of OCDs and savings deposits (including money market deposit accounts). Seasonally adjusted M1 is constructed by summing currency, demand deposits, and OCDs (before May 2020) or other liquid deposits (beginning May 2020), each seasonally adjusted separately.
Here is the “M1 Money Stock” (seasonally adjusted) chart, updated on August 22, 2023 depicting data through July 2023, with a value of $18,447.1 Billion:
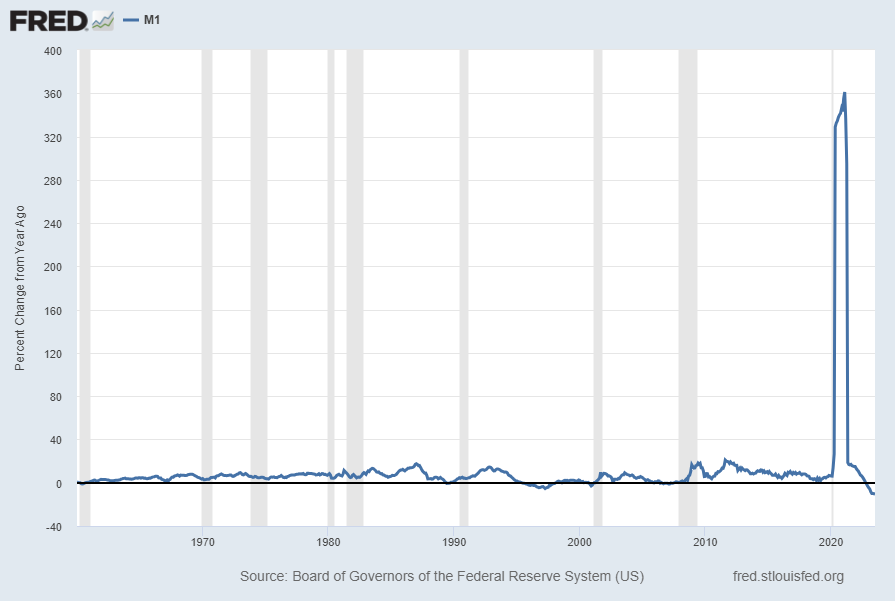
Here is the “M1 Money Stock” chart on a “Percent Change From Year Ago” basis, with a current value of -10.4%:
Data Source: Board of Governors of the Federal Reserve System (US), M1 Money Stock [M1SL], retrieved from FRED, Federal Reserve Bank of St. Louis; accessed August 22, 2023: https://fred.stlouisfed.org/series/M1SL
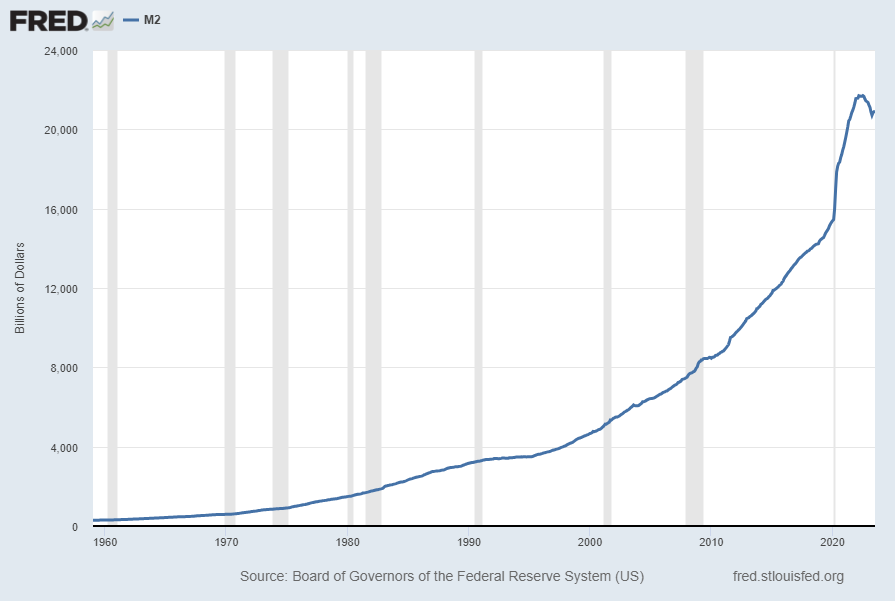
The second set shows M2, defined in FRED as the following:
Before May 2020, M2 consists of M1 plus (1) savings deposits (including money market deposit accounts); (2) small-denomination time deposits (time deposits in amounts of less than $100,000) less individual retirement account (IRA) and Keogh balances at depository institutions; and (3) balances in retail money market funds (MMFs) less IRA and Keogh balances at MMFs.
Beginning May 2020, M2 consists of M1 plus (1) small-denomination time deposits (time deposits in amounts of less than $100,000) less IRA and Keogh balances at depository institutions; and (2) balances in retail MMFs less IRA and Keogh balances at MMFs. Seasonally adjusted M2 is constructed by summing savings deposits (before May 2020), small-denomination time deposits, and retail MMFs, each seasonally adjusted separately, and adding this result to seasonally adjusted M1.
Here is the “M2 Money Stock” (seasonally adjusted) chart, updated on August 22, 2023, depicting data through July 2023, with a value of $20,902.7 Billion:
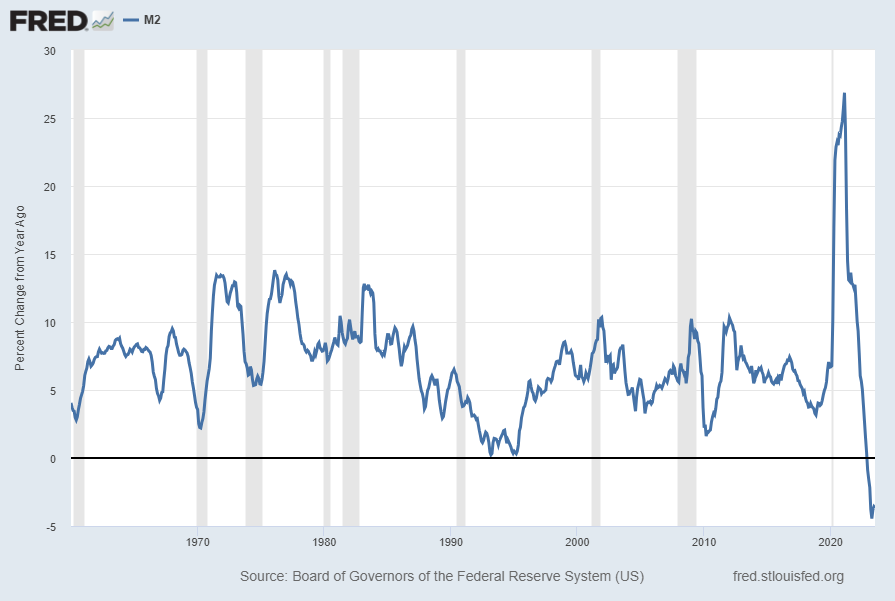
Here is the “M2 Money Stock” chart on a “Percent Change From Year Ago” basis, with a current value of -3.7%:
Data Source: Board of Governors of the Federal Reserve System (US), M2 Money Stock [M2SL], retrieved from FRED, Federal Reserve Bank of St. Louis; accessed August 22, 2023: https://fred.stlouisfed.org/series/M2SL
_____
The Special Note summarizes my overall thoughts about our economic situation