Wednesday, November 27, 2013

Updates Of Economic Indicators November 2013

Here is an update on various indicators that are supposed to predict and/or depict economic activity.  These indicators have been discussed in previous blog posts:
The November 2013 Chicago Fed National Activity Index (CFNAI)(pdf) updated as of November 27, 2013:
cfnai_monthly_MA3 11-27-13
-
As of 11/22/13 (incorporating data through 11/15/13) the WLI was at 132.2 and the WLI, Gr. was at 2.4%.
A chart of the WLI, Gr. since 2000, from Doug Short’s blog of November 22 titled “ECRI Recession Watch:  Weekly Update” :
Dshort 11-22-13 - ECRI-WLI-growth-since-2000 2.4
-
Here is the latest chart, depicting 12-31-07 through 11-23-13:
ads_12-31-07 - 11-23-13
-
As per the November 27 press release, the LEI was at 97.5 and the CEI was at 106.9 in October.
An excerpt from the November 27 release:
“The US LEI has increased for four consecutive months,” said Ken Goldstein, Economist for The Conference Board. “Overall, the data reflect strengthening conditions in the underlying economy. However, headwinds still persist from the labor market, accompanied by business caution and concern about federal budget battles. The biggest challenge to date has been relatively weak consumer demand, which continues to be restrained by weak wage growth and slumping confidence.”
_________
I post various indicators and indices because I believe they should be carefully monitored.  However, as those familiar with this blog are aware, I do not necessarily agree with what they depict or imply.
_____
The Special Note summarizes my overall thoughts about our economic situation
SPX at 1807.23 as this post is written

St. Louis Financial Stress Index – November 27, 2013 Update

On March 28, 2011 I wrote a post (“The STLFSI“) about the St. Louis Fed’s Financial Stress Index (STLFSI) which is supposed to measure stress in the financial system.  For reference purposes, the most recent chart is seen below.  This chart was last updated on November 27, incorporating data from December 31,1993 to November 22, 2013, on a weekly basis.  The November 22, 2013 value is -.846:
(click on chart to enlarge image)
STLFSI_11-27-13 -.846
-
Here is the STLFSI chart from a 1-year perspective:
STLFSI_11-27-13 -.846 1-year
Data Source: FRED, Federal Reserve Economic Data, Federal Reserve Bank of St. Louis; accessed November 27, 2013:
_________
I post various indicators and indices because I believe they should be carefully monitored.  However, as those familiar with this blog are aware, I do not necessarily agree with what they depict or imply.
_____
The Special Note summarizes my overall thoughts about our economic situation
SPX at 1806.07 as this post is written

Durable Goods New Orders – Long-Term Charts Through October 2013

Many people place emphasis on Durable Goods New Orders as a prominent economic indicator and/or leading economic indicator.
For reference, below are charts depicting this measure.
First, from the St. Louis Fed site (FRED), a chart through October, last updated on November 27.  This value is 230,252 ($ Millions) :
(click on charts to enlarge images)
DGORDER_11-27-13 230252
-
Here is the chart depicting this measure on a “Percentage Change from a Year Ago” basis:
DGORDER_11-27-13 230252 Percent Change From Year Ago
Data Source: FRED, Federal Reserve Economic Data, Federal Reserve Bank of St. Louis: Manufacturers’ New Orders:  Durable Goods [DGORDER] ; U.S. Department of Commerce: Census Bureau ; accessed November 27, 2013;
_________
I post various indicators and indices because I believe they should be carefully monitored.  However, as those familiar with this blog are aware, I do not necessarily agree with what they depict or imply.
_____
The Special Note summarizes my overall thoughts about our economic situation
SPX at 1806.17 as this post is written

Consumer Confidence Surveys – As Of November 27, 2013

Doug Short had a blog post of November 26 (“Consumer Confidence Declines Again in November“) in which he presents the latest Conference Board Consumer Confidence and Thomson/Reuters University of Michigan Consumer Sentiment Index charts.  They are presented below:
(click on charts to enlarge images)
Dshort 11-27-13 - Conference-Board-consumer-confidence-index
-
Dshort 11-27-13 - Michigan-consumer-sentiment-index
-
There are a few aspects of the above charts that I find highly noteworthy.  Of course, the continuing subdued absolute levels of these two surveys is disconcerting.
Also, I find the “behavior” of these readings to be quite disparate as compared to the other post-recession periods, as shown in the charts between the gray shaded areas (the gray areas denote recessions as defined by the NBER.)
While I don’t believe that confidence surveys should be overemphasized, I find these readings to be very problematical, especially in light of a variety of other highly disconcerting measures highlighted throughout this blog.
_____
The Special Note summarizes my overall thoughts about our economic situation
SPX at 1802.75 as this post is written

Tuesday, November 26, 2013

Philadelphia Fed – 4th Quarter 2013 Survey Of Professional Forecasters

The Philadelphia Fed Fourth Quarter 2013 Survey of Professional Forecasters was released on November 25.  This survey is somewhat unique in various regards, such as it incorporates a longer time frame for various measures.
The survey shows, among many measures, the following median expectations:
Real GDP: (annual average level)
full-year 2013 : 1.7%
full-year 2014 : 2.6%
full-year 2015:  2.8%
full-year 2016:  2.7%
Unemployment Rate: (annual average level)
for 2013: 7.5%
for 2014: 7.0%
for 2015: 6.4%
for 2015: 6.0%
-
As for “the chance of a contraction in real GDP” in any of the next few quarters, mean estimates are 11.3%, 11.1%, 11.6%, 11.7% and 12.2% for each of the quarters from Q4 2013 through Q4 2014, respectively.
As well, there are also a variety of time frames shown (present quarter through the year 2022) with the median expected inflation of each.  Inflation is measured in Headline and Core CPI and Headline and Core PCE.  Over all time frames expectations are shown to be in the 1.1%-2.3% range.
_____
I post various economic forecasts because I believe they should be carefully monitored.  However, as those familiar with this blog are aware, I do not agree with many of the consensus estimates and much of the commentary in these forecast surveys.
_____
The Special Note summarizes my overall thoughts about our economic situation
SPX at 1802.48 as this post is written

Monday, November 25, 2013

Food Stamps As Of November 25, 2013

This post is an update to previous posts concerning food stamps.  The program is officially called “Supplemental Nutrition Assistance Program,” or SNAP.  As stated on the SNAP website, “As of Oct. 1, 2008, Supplemental Nutrition Assistance Program (SNAP) is the new name for the federal Food Stamp Program.”
The data was last updated November 8, 2013, reflecting August 2013 levels.
Here is a table showing various monthly statistics with regard to national participation and costs going back to FY2010.  As seen in this table, the number of people participating as of August 2013 is 47,665,069, up 1.19% from year-ago (August 2012) levels.  As a reference point, the figure as of June 2009 (the official end of the recession as defined by the NBER) was (originally stated as) 34,882,031.  Longer-term annual data is also available.
As I wrote in the April 12, 2010 post, “Of course, what is particularly disconcerting is not only the extent of participation in these programs, but the fact that this is yet another notable statistic that is getting worse well after the purported end of the recession.”
_____
The Special Note summarizes my overall thoughts about our economic situation
SPX at 1804.90 as this post is written

Current Economic Situation

With regard to our current economic situation,  my thoughts can best be described/summarized by the posts found under the 30 “Building Financial Danger” posts.
My thoughts concerning our ongoing economic situation – with future implications – can be seen on the page titled “A Special Note On Our Economic Situation,” which has been found near the bottom of every blog post since August 15, 2010.
_____
The Special Note summarizes my overall thoughts about our economic situation
SPX at 1804.83 as this post is written

Saturday, November 23, 2013

Long-Term Charts Of The ECRI WLI & ECRI WLI, Gr. – November 22, 2013 Update

As I stated in my July 12, 2010 post (“ECRI WLI Growth History“):
For a variety of reasons, I am not as enamored with ECRI’s WLI and WLI Growth measures as many are.
However, I do think the measures are important and deserve close monitoring and scrutiny.
The movement of the ECRI WLI and WLI, Gr. is particularly notable at this time, as ECRI publicly announced on September 30, 2011 that the U.S. was “tipping into recession,” and ECRI has reiterated the view that the U.S. economy is currently in a recession, seen most recently in these nine sources :
Other past notable year 2012 reaffirmations of the September 30, 2011 recession call by ECRI were seen (in chronological order) on March 15 (“Why Our Recession Call Stands”) as well as various interviews and statements the week of May 6, including:
Also, subsequent to May 2012:
__
Below are three long-term charts, from Doug Short’s blog post of November 22, 2013 titled “ECRI Recession Watch:  Weekly Update.”  These charts are on a weekly basis through the November 22 release, indicating data through November 15, 2013.
Here is the ECRI WLI (defined at ECRI’s glossary):
(click on charts to enlarge images)
Dshort 11-22-13 - ECRI-WLI 132.2
-
This next chart depicts, on a long-term basis, the Year-over-Year change in the 4-week moving average of the WLI:
Dshort 11-22-13 - ECRI-WLI-YoY 4.4 percent
-
This last chart depicts, on a long-term basis, the WLI, Gr.:
Dshort 11-22-13 - ECRI-WLI-growth-since-1965 2.4
_________
I post various economic indicators and indices because I believe they should be carefully monitored.  However, as those familiar with this blog are aware, I do not necessarily agree with what they depict or imply.
_____
The Special Note summarizes my overall thoughts about our economic situation
SPX at 1804.76 as this post is written

Friday, November 22, 2013

Trends Of S&P500 Earnings Forecasts

S&P500 earnings trends and estimates are a notably important topic, for a variety of reasons, at this point in time.
FactSet publishes a report titled “Earnings Insight” that contains a variety of information including the trends and expectations of S&P500 earnings.
For reference purposes, here are two charts as seen in the “Earnings Insight” (pdf) report of November 15, 2013:
from page 18:
(click on charts to enlarge images)
CY Bottom-Up EPS vs. Top-Down Mean EPS (Trailing 26-Weeks) 
FactSet Earnings Insight 11-15-13 CY2013 and CY2014
-
from page 19:
Calendar Year Bottom-Up EPS Actuals & Estimates
FactSet Earnings Insight 11-15-13 CY2000-CY2014
_____
I post various economic forecasts because I believe they should be carefully monitored.  However, as those familiar with this blog are aware, I do not agree with many of the consensus estimates and much of the commentary in these forecast surveys.
_____
The Special Note summarizes my overall thoughts about our economic situation
SPX at 1798.75 as this post is written

S&P500 Earnings Estimates For Years 2013, 2014, And 2015

As many are aware, Thomson Reuters publishes earnings estimates for the S&P500.  (My other posts concerning S&P earnings estimates can be found under the S&P500 Earnings label)
The following estimates are from Exhibit 12 of “The Director’s Report” (pdf) of November 21, 2013, and represent an aggregation of individual S&P500 component “bottom up” analyst forecasts:
Year 2013 estimate:
$109.47/share
Year 2014 estimate:
$121.72/share
Year 2015 estimate:
$134.14/share
_____
I post various economic forecasts because I believe they should be carefully monitored.  However, as those familiar with this blog are aware, I do not agree with many of the consensus estimates and much of the commentary in these forecast surveys.
_____
The Special Note summarizes my overall thoughts about our economic situation
SPX at 1796.82 as this post is written

Thursday, November 21, 2013

Standard & Poor’s S&P500 Earnings Estimates For 2013 & 2014 – As Of November 14, 2013

As many are aware, Standard & Poor’s publishes earnings estimates for the S&P500.  (My posts concerning their estimates can be found under the S&P500 Earnings label)
For reference purposes, the most current estimates are reflected below, and are as of November 14, 2013:
Year 2013 estimates add to the following:
-From a “bottom up” perspective, operating earnings of $107.19/share
-From a “top down” perspective, operating earnings of N/A
-From a “top down” perspective, “as reported” earnings of $97.82/share
Year 2014 estimates add to the following:
-From a “bottom up” perspective, operating earnings of $120.80/share
-From a “top down” perspective, operating earnings of $112.92/share
-From a “top down” perspective, “as reported” earnings of $108.11/share
_____
I post various economic forecasts because I believe they should be carefully monitored.  However, as those familiar with this blog are aware, I do not agree with many of the consensus estimates and much of the commentary in these forecast surveys.
_____
The Special Note summarizes my overall thoughts about our economic situation
SPX at 1795.85 as this post is written

St. Louis Financial Stress Index – November 21, 2013 Update

On March 28, 2011 I wrote a post (“The STLFSI“) about the St. Louis Fed’s Financial Stress Index (STLFSI) which is supposed to measure stress in the financial system.  For reference purposes, the most recent chart is seen below.  This chart was last updated on November 21, incorporating data from December 31,1993 to November 15, 2013, on a weekly basis.  The November 15, 2013 value is -.82:
(click on chart to enlarge image)
STLFSI_11-21-13 -.82
-
Here is the STLFSI chart from a 1-year perspective:
STLFSI_11-21-13 -.82 1-year
Data Source: FRED, Federal Reserve Economic Data, Federal Reserve Bank of St. Louis; accessed November 21, 2013:
_________
I post various indicators and indices because I believe they should be carefully monitored.  However, as those familiar with this blog are aware, I do not necessarily agree with what they depict or imply.
_____
The Special Note summarizes my overall thoughts about our economic situation
SPX at 1792.06 as this post is written

Is The Stock Market Experiencing A Bubble?

Recently there have been a variety of discussions as to whether the stock market is experiencing a bubble.  Among the main drivers of such discussion is the stock market's seemingly near-constant price advancements, frequent record-high closes, and the duration of the advance, all of which are against the backdrop of the (at best) slow-growth economy.  For reference, 
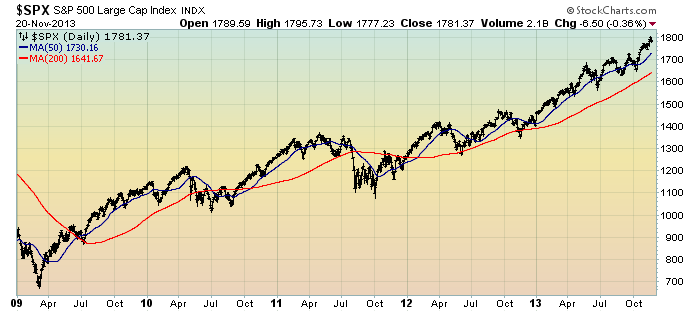
here is a daily chart of the S&P500 from 2009, with the 50dma and 200dma:
(click on chart to enlarge image)(chart courtesy of StockCharts.com; chart creation and annotation by the author)
EconomicGreenfield 11-21-13 SPX daily since 2009
One such article discussing whether the stock market is experiencing a bubble is the Saturday, November 16 Barron's article titled "Bubble Trouble?"  An excerpt:
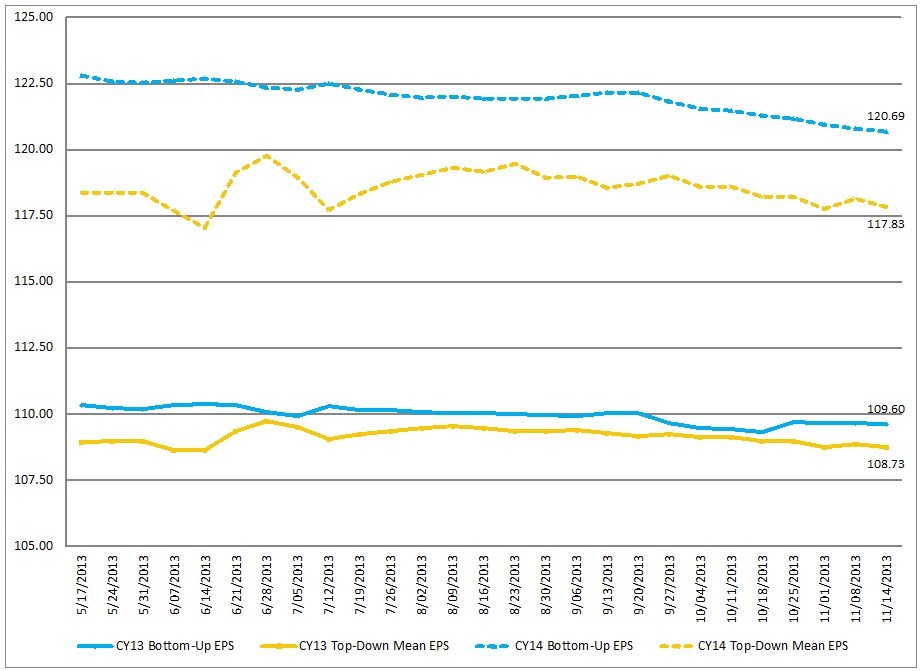
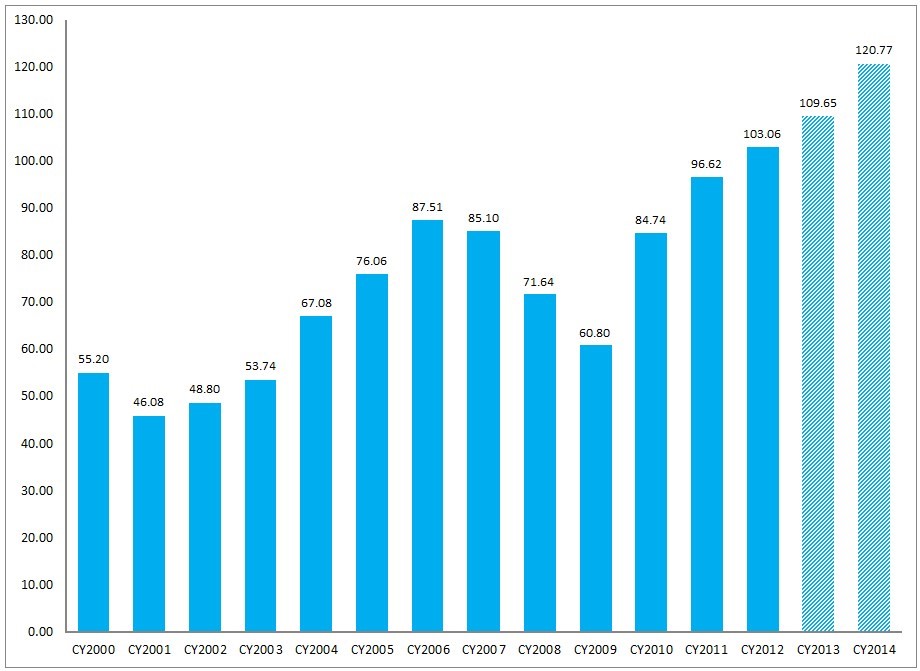
The S&P 500 is valued at 16 times projected 2013 operating profits of $109 and at 15 times estimated 2014 earnings of $120. Those price/earnings ratios are about equal to the long-run average. Even if next year's earnings growth is closer to this year's projected 5% than to the aggressive current estimate of 10%, the S&P 500 forward P/E is 15.6, which doesn't look excessive at a time of near-zero short-term rates, a 2.71% yield on the 10-year Treasury note, and sub-6% average yield on junk bonds. The S&P 500 dividend yield is 2%, but the earnings payout ratio is historically low at about 35%, meaning companies have room to further boost dividends.
As well, Janet Yellen, during her testimony on Thursday, was asked about asset bubbles.  Here is what she said (as seen in the Bloomberg article of November 14 titled “Yellen Signals Continued QE Undeterred by Bubble Risk”) concerning the stock market:
“Stock prices have risen pretty robustly but if you look at traditional measures,” such as price-earnings ratios, “you would not see stock prices in territory that suggests bubble-like conditions,” she said.
My comments:
My posts concerning the existence of the stock market being an asset bubble date back to 2011.  I view the argument as to whether the stock market is experiencing a bubble based upon two general areas:  technical analysis and fundamental analysis.
While I believe there to be many reasons to believe stocks are in a bubble based upon technical measures, in this post I will focus on fundamental measures.
In particular, the common (and seemingly predominant) argument made that stocks are fairly or attractively valued is based upon a (forward) PE basis.  Various year 2014-2015 S&P500 earnings forecasts continue to portray attractive growth in earnings.  While, as indicated by the Barron's article mentioned above, stocks don't appear to be in a bubble based upon (forward) PE-based valuation measures, current levels of earnings are, in many ways, favorably impacted by various factors.
Even if one assumes that EPS is - or should be - the primary stock market valuation metric - these numerous benevolent factors within the current earnings environment seem to lack general recognition.  Whether these factors will persist - and whether they "deserve" to be accorded full valuation - should perhaps be the focal issue.
While a full discussion of these factors would be exceedingly lengthy and, at times, very complex, below are some of the more notable factors:
(Ultra) Low interest rates -  While, due to numerous factors, it is difficult to accurately quantify how much the (ultra) low interest rate environment has directly and indirectly bolstered earnings, the (ultra) low interest rate environment has had a (very) significant impact on earnings.  I discuss this in the ProfitabilityIssues.com posts of September 25, 2013 ("Corporate Interest Cost Savings") and the July 29, 2013 post ("Impact Of Low Interest Rates On Corporate Profitability.")
Lagging Revenue Growth - While S&P500 earnings have no doubt been robust, corporate revenue growth has consistently lagged.  This is problematical in many ways, both from a corporate performance standpoint as well as a general economic standpoint.  From a corporate performance standpoint, it raises many issues, including both the "quality of earnings" as well as to the sustainability of earnings.  From a general economic standpoint, it strongly appears as if employment growth, among other factors, would likely be considerably higher if revenue growth was higher.

Share buybacks - While, from an overall perspective, share buybacks aren't a predominant factor, this is yet another area in which EPS has been significantly bolstered. (note:  this share buyback factor, as well as others, is also discussed in Lance Roberts' post titled "Analyzing Earnings As Of Q3 2013.")
Also of note is that various levels of profitability – including the S&P500′s operating margins, operating profits, and After-Tax Corporate Profits as a Percentage of GDP - are at or near record-high levels.  Cumulatively, these levels raise questions about the sustainability of corporate earnings growth.  As well, they raise the issue of what a decline in corporate earnings may look like.  These "decline" scenarios, although estimates, often look rather precipitous, especially if one starts thinking about such issues as long-term mean reversion as well as a "reversal" of the positive earnings factors mentioned above, such as the ultra-low interest rate environment.
As to the valuation of the stock market, when one uses stock market valuation measures other than PE, one often sees the stock market as either being (very) expensive or in "bubble" territory.  These other valuation measures include the Q-Ratio, market capitalization to GDP, CAPE ("Shiller PE"), etc.  (note:  these factors are discussed in Doug Short's "Market Valuation Overview" updates as well as various of John Hussman's commentaries, including that of November 11, 2013 titled "A Textbook Pre-Crash Bubble.")
Cumulatively, on an "all things considered basis," my analysis continues to indicate that not only is the stock market experiencing a bubble but - although it doesn't necessarily outwardly appear as such - also that this stock market bubble is enormous.  While some choose to use (forward) PE ratios as the main determinant of whether the stock market is a bubble, I believe this is misleading.  
_____
The Special Note summarizes my overall thoughts about our economic situation
SPX at 1781.37 as this post is written

Tuesday, November 19, 2013

Recession Measures – Updated

This post is the latest update to a series of blog posts seen on the CalculatedRisk.com blog.  The original blog post of April 12, 2010, is titled “Recession Measures.” In it, Bill McBride discussed key measures that the NBER uses to determine recoveries, and posted four charts.
Here are those charts, updated in his November 17, 2013 post titled “Update:  Recovery Measures.”  The charts are constructed in a fashion different than most – in a “percent of peak” fashion.  As defined, “The following graphs are all constructed as a percent of the peak in each indicator.  This shows when the indicator has bottomed – and when the indicator has returned to the level of the previous peak.  If the indicator is at a new peak, the value is 100%.”  Periods of recession, as defined by the NBER, are shown as blue bars.
Here are the four charts, updated through the dates shown:
(click on images to enlarge)
Real Gross Domestic Product, above its pre-recession peak:
CR 11-17-13 - RMGDPQ32013
-
Real Personal Income Less Transfer Payments, above its pre-recession peak :
CR 11-17-13 - RMPersonalIncomeLessTransferQ32013
-
Industrial Production, still .8% below the pre-recession peak:
CR 11-17-13 - RMIPNov2013
-
Payroll Employment, still 1.1% below the pre-recession peak:
CR 11-17-13 - RMEmployOct2013

_____
The Special Note summarizes my overall thoughts about our economic situation
SPX at 1791.53 as this post is written

Monday, November 18, 2013

Yellen Testimony Concerning Whether Stocks Are Experiencing A Bubble

I found various of Janet Yellen's comments during her confirmation hearing on Thursday (November 14) to be notable, although I don't agree with many of them.
For reference purposes, here are a few of the comments.  Unfortunately, the official transcript is not yet available.  The following excerpts are from the Wall Street Journal post of November 14, 2013, titled "Yellen on Stocks:  This Isn't a Bubble."
“Stock prices have risen pretty robustly,” she told lawmakers Thursday. But looking at several valuation measures — she specifically cited equity-risk premiums — she said: “you would not see stock prices in territory that suggest…bubble-like conditions.”
also:
“At this stage, I don’t see risks to financial stability” from current policies, she says, while noting limited evidence of “reach for yield” among investors or a buildup of leverage.
She says it’s important for the Fed to “attempt to detect asset bubbles.” For now, however, she doesn’t see any bubbles that need to be popped.
Another source is the Bloomberg article of November 14 titled "Yellen Signals Continued QE Undeterred by Bubble Risk."  Here is an excerpt, slightly different than that seen above:
“Stock prices have risen pretty robustly but if you look at traditional measures,” such as price-earnings ratios, “you would not see stock prices in territory that suggests bubble-like conditions,” she said.
_____
The Special Note summarizes my overall thoughts about our economic situation
SPX at 1798.96 as this post is written