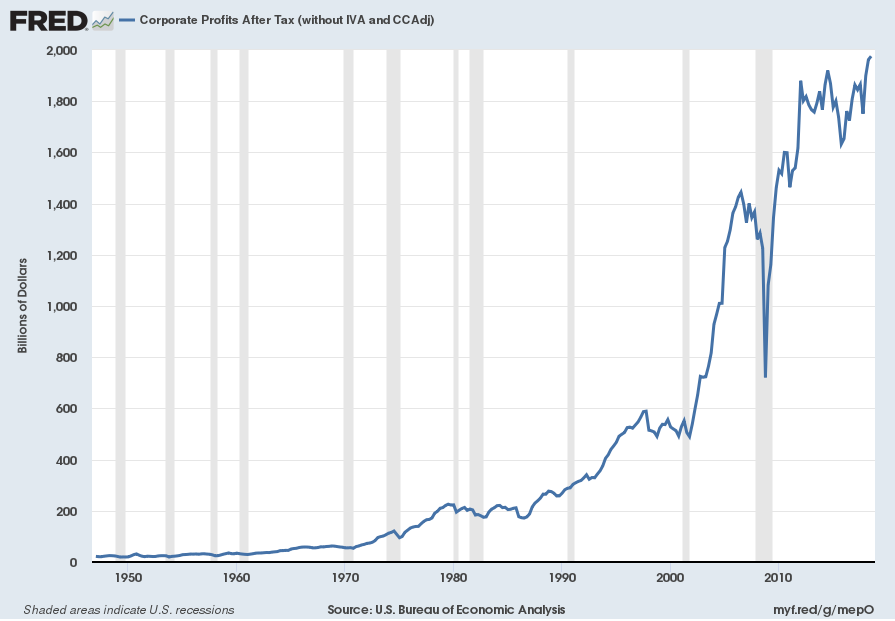
In the last post (“3rd Quarter 2018 Corporate Profits“) I displayed, for reference purposes, a long-term chart depicting Corporate Profits After Tax.
There are many ways to view this measure, both on an absolute as well as relative basis.
One relative measure is viewing Corporate Profits as a Percentage of GDP. I feel that this metric is important for a variety of reasons. As well, the measure is important to a variety of parties, including investors, businesses, and government policy makers.
As one can see from the long-term chart below (updated through the third quarter), (After Tax) Corporate Profits as a Percentage of GDP is at levels that can be seen as historically (very) high. While there are many reasons as to why this is so, from a going-forward standpoint I think it is important to recognize both that such a notable condition exists, as well as contemplate and/or plan for such factors and conditions that would come about if (and in my opinion “when”) a more historically “normal” ratio of Corporate Profits as a Percentage of GDP occurs. This topic can be very complex in nature, and depends upon myriad factors. In my opinion it deserves far greater recognition.
(click on chart to enlarge image)
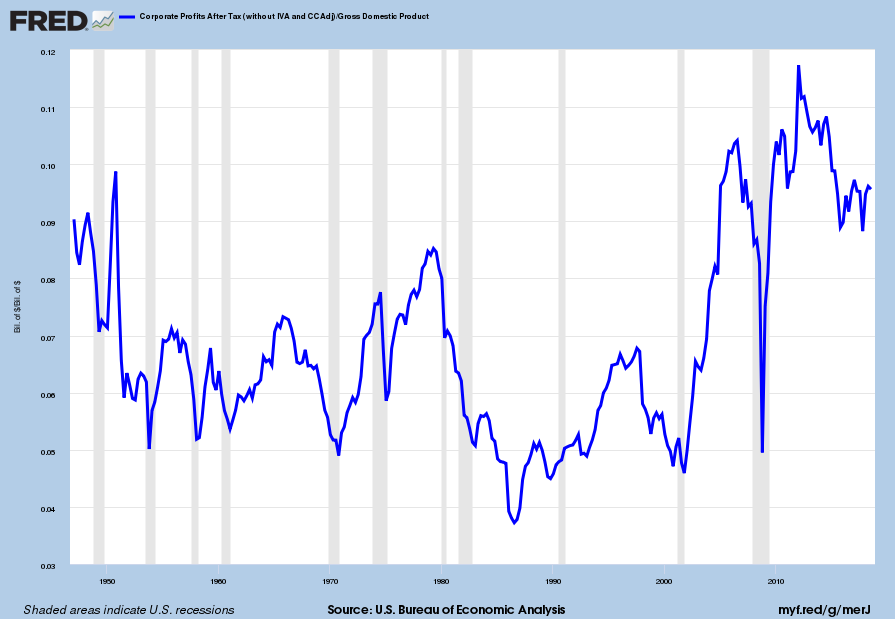
Data Source: FRED, Federal Reserve Economic Data, Federal Reserve Bank of St. Louis; accessed November 28, 2018
_____
The Special Note summarizes my overall thoughts about our economic situation
SPX at 2729.03 as this post is written