On Wednesday, July 29, 2020 FOMC Chairman Jerome Powell gave his scheduled July 2020 FOMC Press Conference. (link of video and related materials)
Below are Jerome Powell’s comments I found most notable – although I don’t necessarily agree with them – in the order they appear in the transcript. These comments are excerpted from the “Transcript of Chairman Powell’s Press Conference“ (preliminary)(pdf) of July 29, 2020, with the accompanying “FOMC Statement.”
From Chairman Powell’s opening comments:
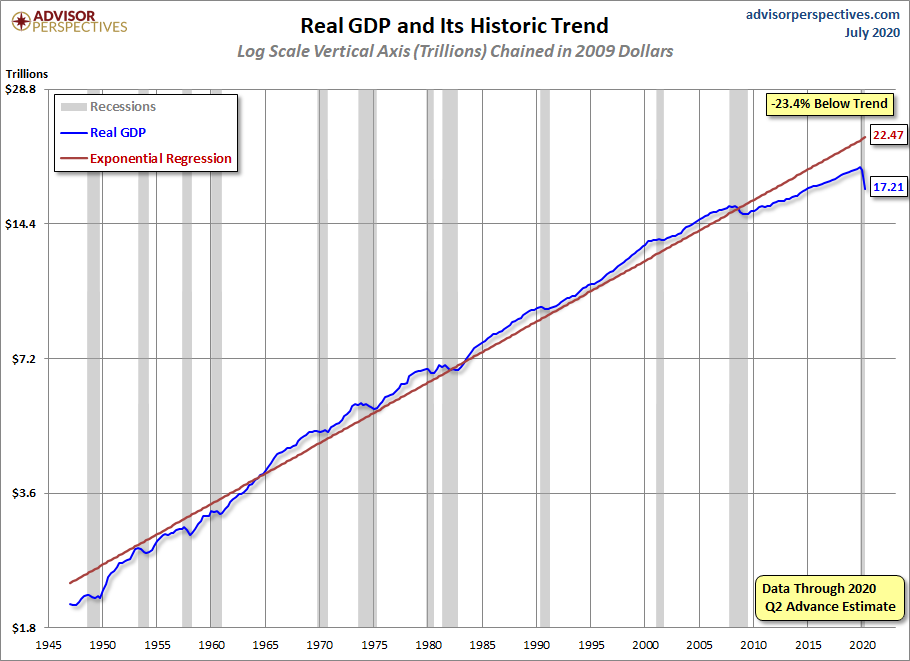
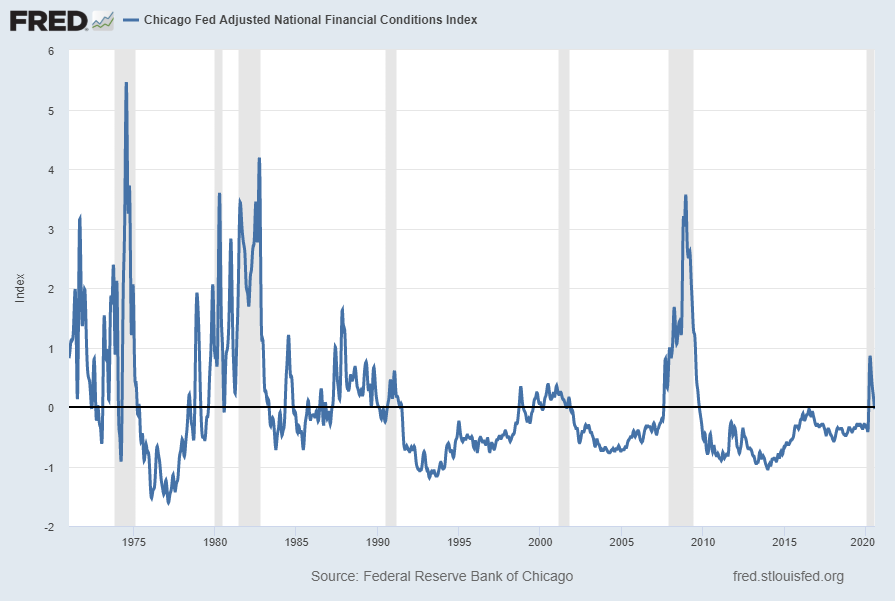
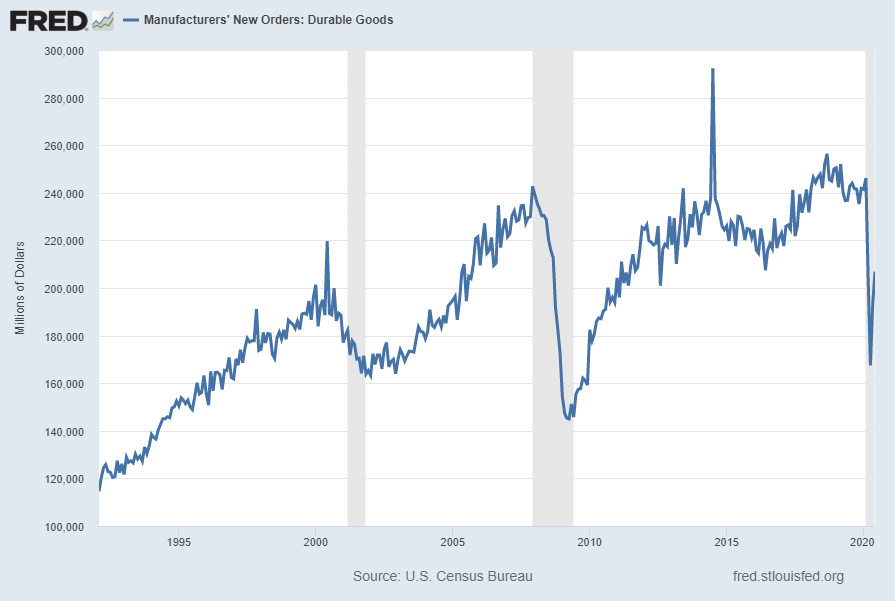
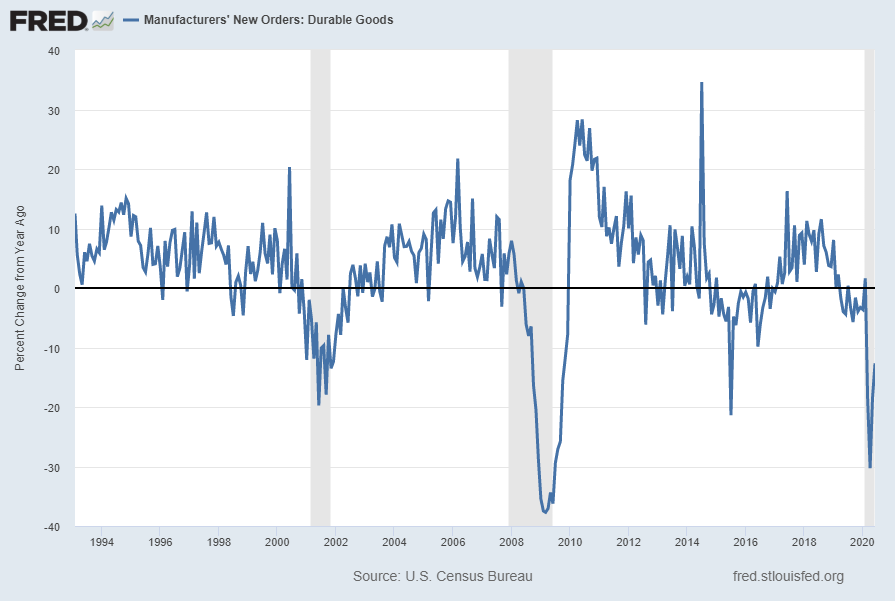
In recent months, economic activity picked up as the economy began to reopen. Many businesses opened their doors, factories restarted production, and more people left their homes to engage in various activities. As a result, household spending looks to have recovered about half of its earlier decline, although spending for services such as air travel and hotels has shown much less of a pick-up. The recovery in household spending also likely owes to federal stimulus payments and expanded unemployment benefits, which provided substantial and timely support to household incomes. In contrast, indicators of business fixed investment have yet to show a recovery. Even with the improved economic news in May and June, overall activity remains well below its level before the pandemic, and the contraction in real GDP in the second quarter will likely be the largest on record.
Jerome Powell’s responses as indicated to the various questions:
JAMES POLITI. Hi there, James Politi with the Financial Times. Chair Powell, the Fed today decided to extend dollar liquidity swap lines with a number of central banks around the world. Why was that important for the Fed? And how concerned are you about dollar shortages persisting for a time through the pandemic?
CHAIR POWELL. So our dollar swap lines, we introduced those back at the beginning of this episode after the pandemic made itself present. And dollar funding markets were in very difficult shape at the time. And the introduction of the swap lines has really restored dollar funding markets around the world to fairly normal levels of activity. And so they kind of served their purpose. But we extended them I guess yesterday morning, really to facilitate planning by other central banks, and just so people will know that those facilities are still there. We want them to remain in place and be available as long as they are needed. And since, you know, the crisis and the economic fallout from the pandemic are far from over, we’re going to leave those in place for the time being. And we’ll leave them in place until we’re confident that they’re no longer needed. There’s nothing that’s going on in the market right now that raises any concerns. It’s just we want them to be there as a backstop for markets.
also:
NICK TIMIRAOS. Yeah. Chair Powell, you have described your asset purchase objective as stabilizing markets. And with markets having stabilized, aren’t the asset purchases now doing more than addressing market function by supporting your macroeconomic objectives? The other question I have is, what is your strategy going to be with respect to using asset purchases to support your macroeconomic objectives going forward? Thanks.
CHAIR POWELL. So you’re right, the asset purchases in their current size really sprang from severe dysfunction in the Treasury and MBS markets at the beginning of the market reaction to the pandemic. And thanks to those purchases, we have substantially restored, not fully but substantially restored functioning markets. This is absolutely critical. That market is really part of the absolute bedrock of the global financial markets, and it’s essential that it work well, and it is doing so now. And we’ve always said though that we understand, accept and are fine with the fact that those purchases are also fostering a more accommodative stance of monetary policy which would tend to support macroeconomic outcomes. So it’s doing both, and you know, we’ve understood that for some time. It’s not — the programs are not structured exactly like the QE programs were in the last financial — in the aftermath of the last financial crisis. Those were more focused on buying longer-run securities. The current purchases are all across the maturity spectrum. Nonetheless, they are supporting accommodative financial conditions. I think it’s clear that that’s the case. In terms of our strategy, you know, that just remains to be seen. As you know, we spent a lot of time in meetings this year looking at the tools that we have to adjust our current stance of policy. We do feel that our current monetary policy stance is the appropriate one. You know, we cut rates close to zero right at the beginning, we ramped up asset purchases and those have really helped. And we gave forward guidance on both of those things which the markets appear to understand, and market pricing is consistent with those. So we think that our policy stance is a good one. We’re of course prepared to adjust that stance as appropriate, and when we deem it as appropriate to better foster achievement of our goals of course.
also:
MICHAEL MCKEE. Mr. Chairman, I’m wondering what it is — you’ve talked a lot about using all of your tools and Governor Brainard talked about moving from support to accommodation. What it is you can actually do — you’ve lowered rates to zero. You’ve set up the lending programs. There hasn’t been much take up. And the tools you talk about are generally in service of keeping interest rates low where they already are. So unless you were to go to negative interest rates, I’m wondering what additional accommodation the Fed can bring. Or is it really up to the fiscal authorities at this point to rescue the economy, to add additional help for it?
CHAIR POWELL. Right, so you’re right. We are committed to using our full range of tools to support the U.S. economy at this difficult time. And we will always remain committed in that sense. We feel like we have ways to further support the economy, certainly through our credit and liquidity facilities which are effectively unlimited. We can adjust those programs. We also can adjust our forward guidance. We can adjust our asset purchases. So there are things that we can do. We feel like we have the ability to do more. But I would not disagree with the importance of fiscal policy — with your statement about the importance of fiscal policy. Fiscal policy can address things that we can’t address if there are particular groups that need help that need direct monetary help, not a loan but an actual grant. As the PPP program showed, you can save a lot of businesses and a lot of jobs with those in a case where lending a company money might not be the right answer. The company might not want to take a loan out in order to pay workers who can’t work because there’s no business. So lending is a particular tool and we’re using it very aggressively. But fiscal policy is essential here, and I would say again, Congress’s action early in the pandemic, historically large by any standard around the world and certainly by U.S. standards. It’s really helping now. It’s really helping. It’s going to stand up very well to scrutiny down the years. This Congress’s very fast and very open-handed response, I think has really helped. And I think — I know that, as I’ve said, very likely more will be needed from all of us, and I see Congress negotiating now over a new package. And I think that’s a good thing.
also:
VICTORIA GUIDA. Hi, Victoria Guida with Politico. Thanks for taking my question. I wanted to ask about the 13(3) facilities. You all have used your emergency authority to buy assets that you can’t directly buy, like corporate bonds, ETFs. So I was just wondering, what is the scope of your authority under 13(3)? What type of assets are you allowed to buy? Could you buy equities through an SPV for example?
CHAIR POWELL. You know, we haven’t looked at that and we have no intention. We haven’t done any work or thought about buying equities. But you know, we’re bound by the provisions of 13(3) which requires that we make, you know, facilities, programs and facilities have broad applicability. Meaning we have to have — it can’t just be focused on one entity. You know, it has to be a broad group of entities. There’s a lot in 13(3) about the solvency of the borrowers. You know, remember, it was rewritten or amended after the financial crisis, and it was written in a way that was meant to make it challenging to bail out large financial institutions. There was a lot in there to make sure that, you know, that they were going to be solvent, things like that. So we have to meet those requirements. You know, we haven’t looked and tried to say what can we buy, and you know, let’s make a complete list. You know, we felt that using these facilities that we could buy corporate bonds and municipal bonds too.
VICTORIA GUIDA. So I just — sorry, just to follow up really quickly. So is it generally supposed to be primarily directed at debt instruments since you talked about borrowers?
CHAIR POWELL. The statute doesn’t say that, but yeah, you could read the statute that way if you want. Honestly, we haven’t tried to push it to, you know, what’s the theoretical limit of it. I mean, I think clearly it’s supposed to replace lending, you know. That’s really what you’re doing. You’re stepping to provide credit at times when the market has stopped functioning. That’s fundamentally what you’re doing with 13(3). And so I think you’ve got to sort of work within that framework.
_____
_____
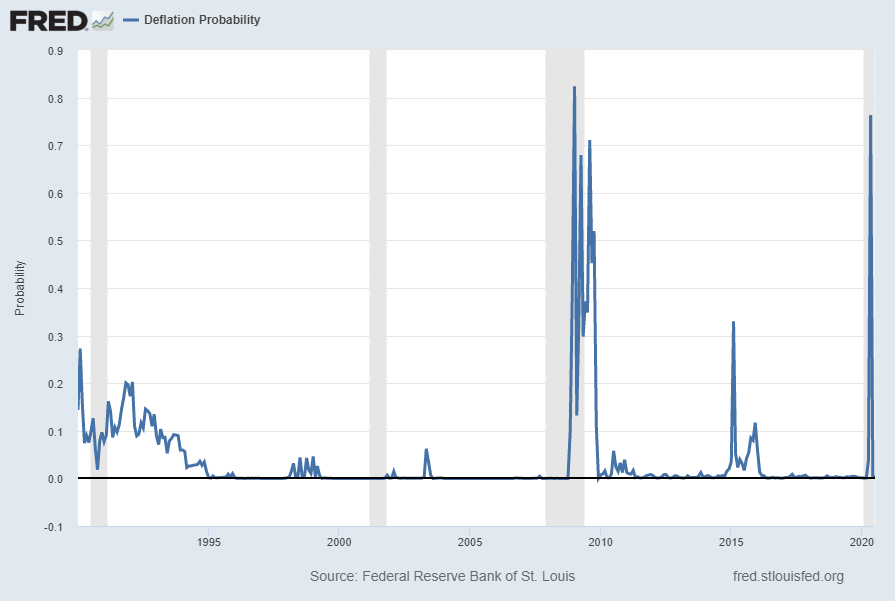
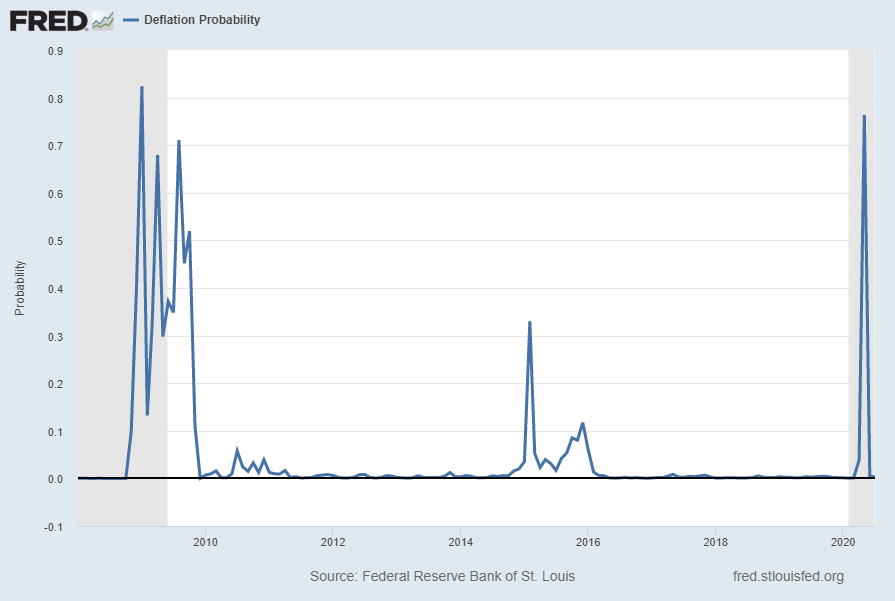
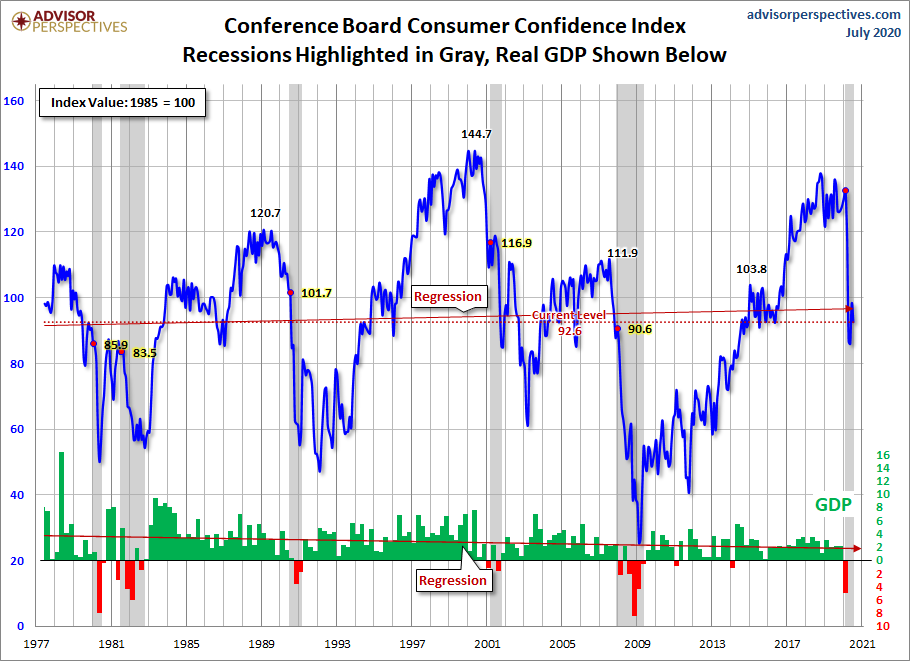
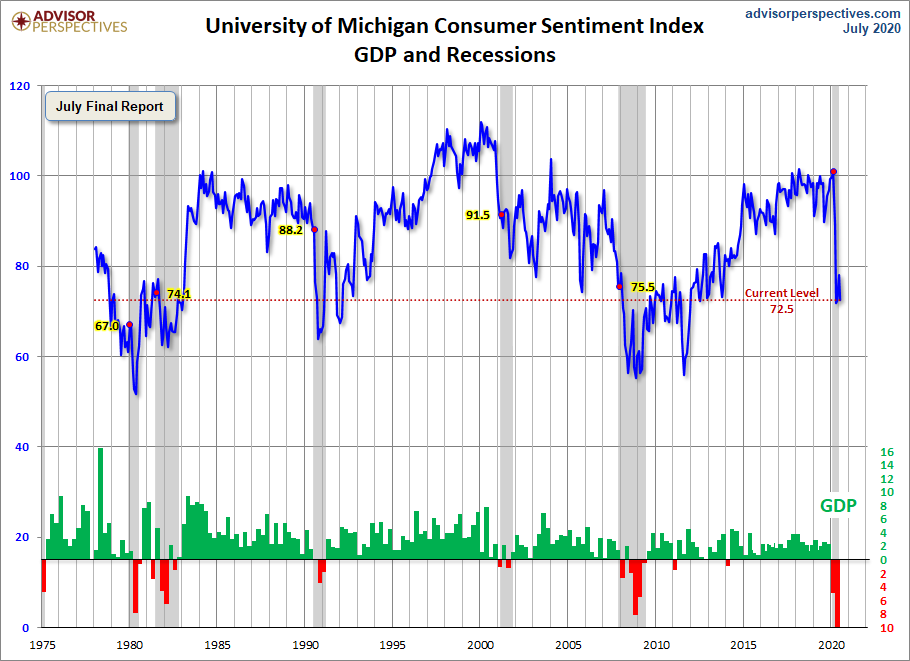
The Special Note summarizes my overall thoughts about our economic situation
SPX at 3245.59 as this post is written