Showing posts with label ECRI WLI. Show all posts

Friday, January 18, 2019

Long-Term Charts Of The ECRI WLI & ECRI WLI, Gr. – January 18, 2019 Update

As I stated in my July 12, 2010 post (“ECRI WLI Growth History“):
For a variety of reasons, I am not as enamored with ECRI’s WLI and WLI Growth measures as many are.
However, I do think the measures are important and deserve close monitoring and scrutiny.
Below are three long-term charts, from the Doug Short site’s ECRI update post of January 18, 2019 titled “ECRI Weekly Leading Index Update:  YoY at 6+ Year Low.”  These charts are on a weekly basis through the January 18, 2019 release, indicating data through January 11, 2019.
Here is the ECRI WLI (defined at ECRI’s glossary):
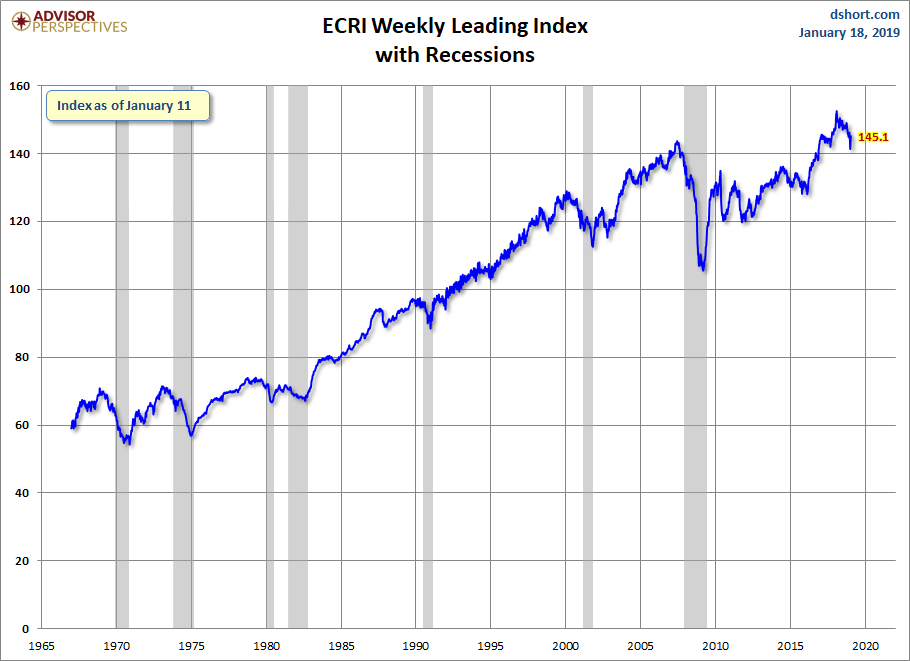
ECRI WLI
–
This next chart depicts, on a long-term basis, the Year-over-Year change in the 4-week moving average of the WLI:
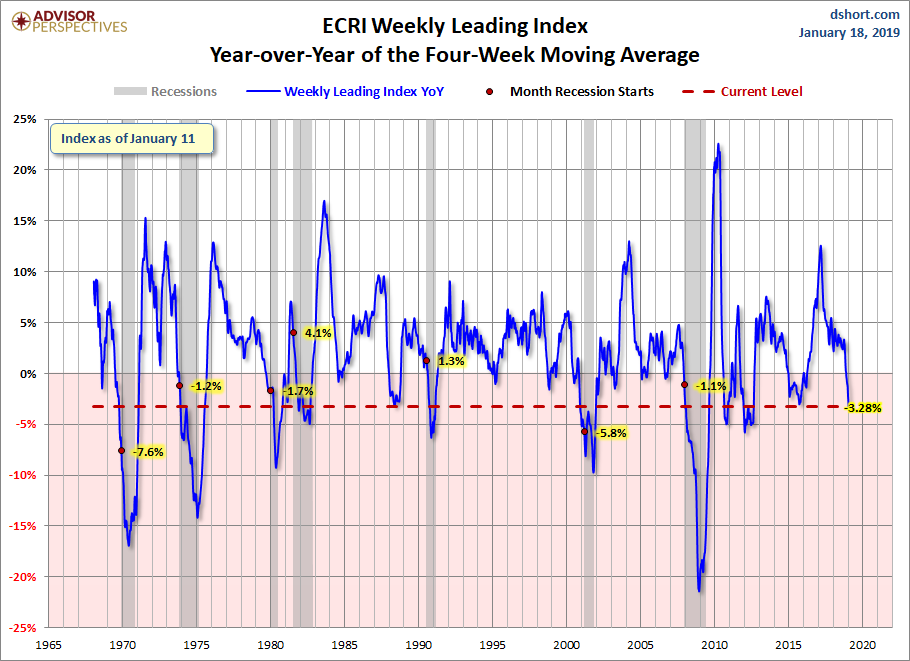
–
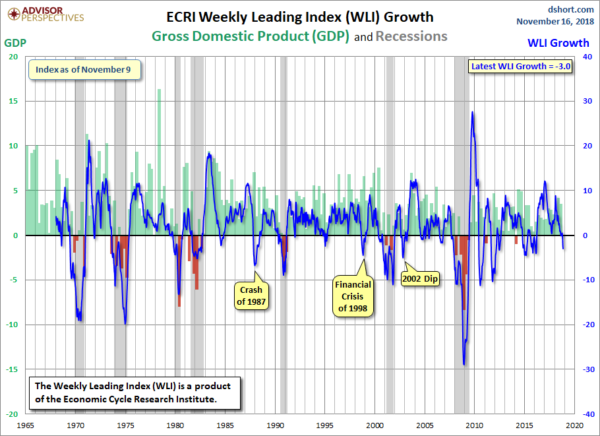
This last chart depicts, on a long-term basis, the WLI, Gr.:
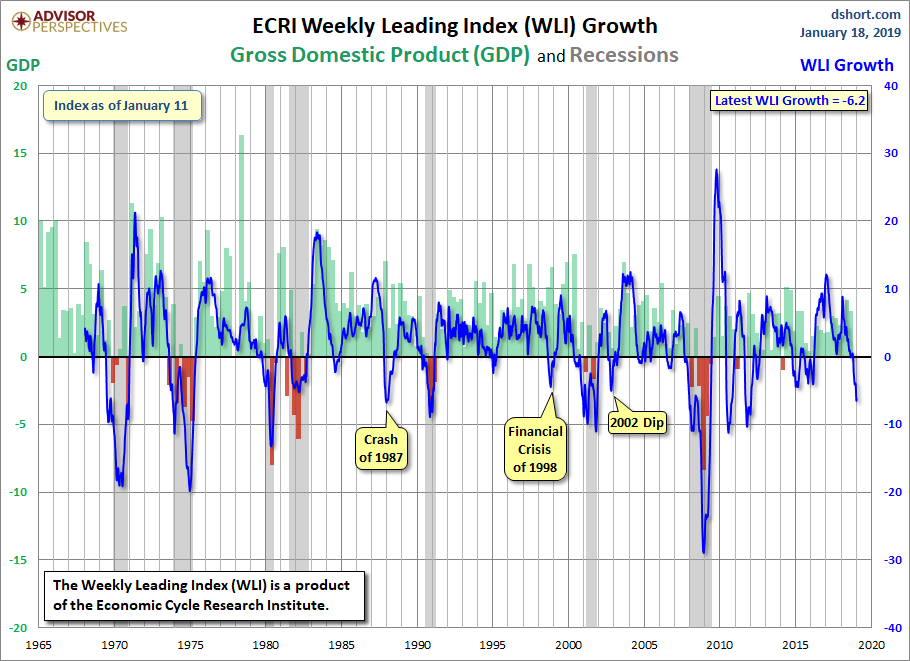
ECRI WLI, Gr.
_________
I post various economic indicators and indices because I believe they should be carefully monitored.  However, as those familiar with this site are aware, I do not necessarily agree with what they depict or imply.
_____
The Special Note summarizes my overall thoughts about our economic situation
SPX at 2669.71 as this post is written

Friday, December 14, 2018

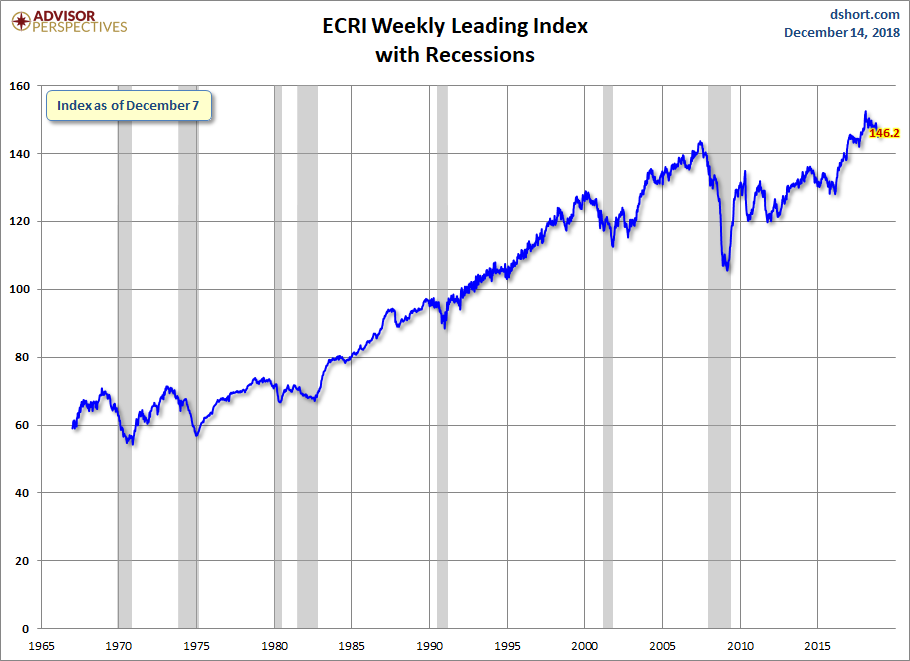
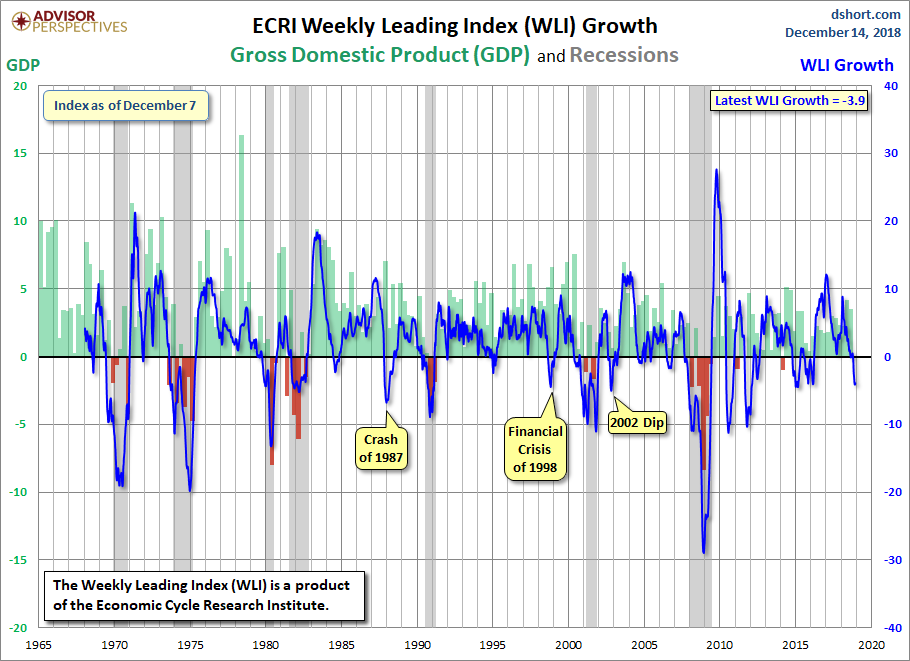
Long-Term Charts Of The ECRI WLI & ECRI WLI, Gr. – December 14, 2018 Update

As I stated in my July 12, 2010 post (“ECRI WLI Growth History“):
For a variety of reasons, I am not as enamored with ECRI’s WLI and WLI Growth measures as many are.
However, I do think the measures are important and deserve close monitoring and scrutiny.
Below are three long-term charts, from the Doug Short site’s ECRI update post of December 14, 2018 titled “ECRI Weekly Leading Index Update:  ‘Inflation Cycles Down as Fed Stays Starstruck’.”  These charts are on a weekly basis through the December 14, 2018 release, indicating data through December 7, 2018.
Here is the ECRI WLI (defined at ECRI’s glossary):
ECRI, WLI
–
This next chart depicts, on a long-term basis, the Year-over-Year change in the 4-week moving average of the WLI:
ECRI WLI YoY of the Four-Week Moving Average
–
This last chart depicts, on a long-term basis, the WLI, Gr.:
ECRI WLI,Gr.
_________
I post various economic indicators and indices because I believe they should be carefully monitored.  However, as those familiar with this site are aware, I do not necessarily agree with what they depict or imply.
_____
The Special Note summarizes my overall thoughts about our economic situation
SPX at 2599.95 as this post is written

Friday, November 16, 2018

Long-Term Charts Of The ECRI WLI & ECRI WLI, Gr. – November 16, 2018 Update

As I stated in my July 12, 2010 post (“ECRI WLI Growth History“):
For a variety of reasons, I am not as enamored with ECRI’s WLI and WLI Growth measures as many are.
However, I do think the measures are important and deserve close monitoring and scrutiny.
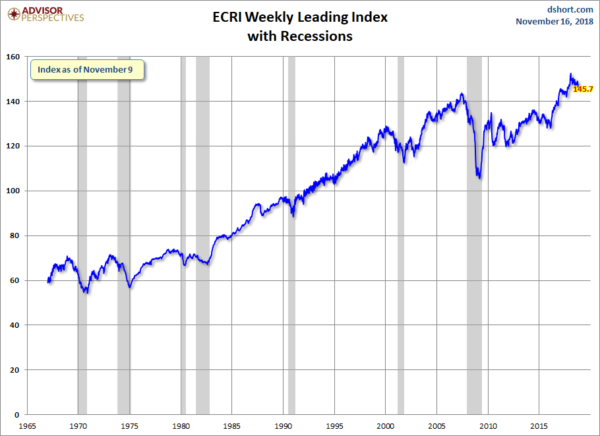
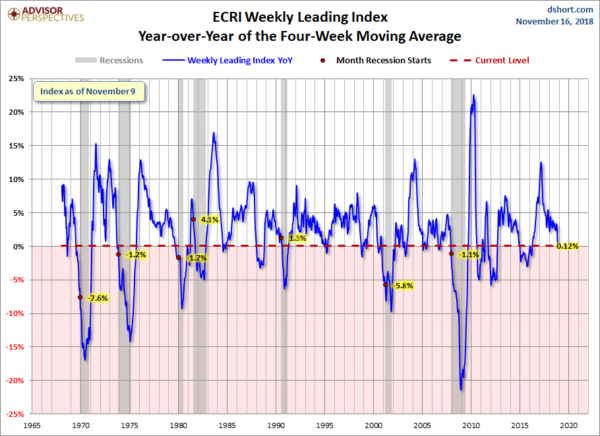
Below are three long-term charts, from the Doug Short site’s ECRI update post of November 16, 2018 titled “ECRI Weekly Leading Index Update:  ‘Construction Crumbling’.”  These charts are on a weekly basis through the November 16, 2018 release, indicating data through November 9, 2018.
Here is the ECRI WLI (defined at ECRI’s glossary):
ECRI WLI
–
This next chart depicts, on a long-term basis, the Year-over-Year change in the 4-week moving average of the WLI:
ECRI WLI YoY of the Four-Week Moving Average
–
This last chart depicts, on a long-term basis, the WLI, Gr.:
ECRI WLI, Gr. -3.0 Percent
_________
I post various economic indicators and indices because I believe they should be carefully monitored.  However, as those familiar with this site are aware, I do not necessarily agree with what they depict or imply.
_____
The Special Note summarizes my overall thoughts about our economic situation
SPX at 2727.82 as this post is written

Friday, October 19, 2018

Long-Term Charts Of The ECRI WLI & ECRI WLI, Gr. – October 19, 2018 Update

As I stated in my July 12, 2010 post (“ECRI WLI Growth History“):
For a variety of reasons, I am not as enamored with ECRI’s WLI and WLI Growth measures as many are.
However, I do think the measures are important and deserve close monitoring and scrutiny.
Below are three long-term charts, from the Doug Short site’s ECRI update post of October 19, 2018 titled “ECRI Weekly Leading Index Update.”  These charts are on a weekly basis through the October 19, 2018 release, indicating data through October 12, 2018.
Here is the ECRI WLI (defined at ECRI’s glossary):
ECRI Weekly Leading Index 147.4
–
This next chart depicts, on a long-term basis, the Year-over-Year change in the 4-week moving average of the WLI:
ECRI WLI YoY of the Four-Week Moving Average
–
This last chart depicts, on a long-term basis, the WLI, Gr.:
ECRI WLI,Gr. .1 Percent
_________
I post various economic indicators and indices because I believe they should be carefully monitored.  However, as those familiar with this site are aware, I do not necessarily agree with what they depict or imply.
_____
The Special Note summarizes my overall thoughts about our economic situation
SPX at 2765.41 as this post is written

Friday, September 28, 2018

Long-Term Charts Of The ECRI WLI & ECRI WLI, Gr. – September 28, 2018 Update

As I stated in my July 12, 2010 post (“ECRI WLI Growth History“):
For a variety of reasons, I am not as enamored with ECRI’s WLI and WLI Growth measures as many are.
However, I do think the measures are important and deserve close monitoring and scrutiny.
Below are three long-term charts, from the Doug Short site’s ECRI update post of September 28, 2018 titled “ECRI Weekly Leading Index Update.”  These charts are on a weekly basis through the September 28, 2018 release, indicating data through September 21, 2018.
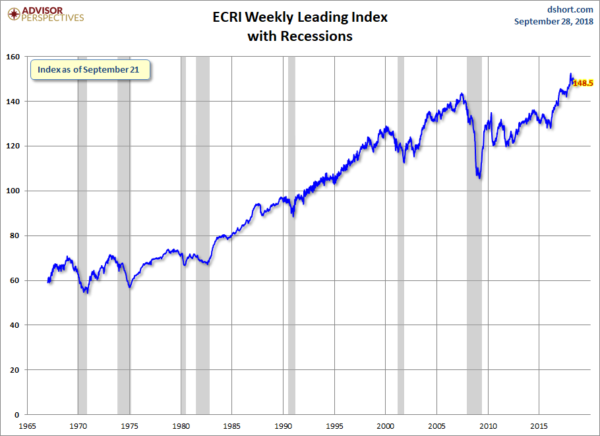
Here is the ECRI WLI (defined at ECRI’s glossary):
ECRI WLI 148.5
–
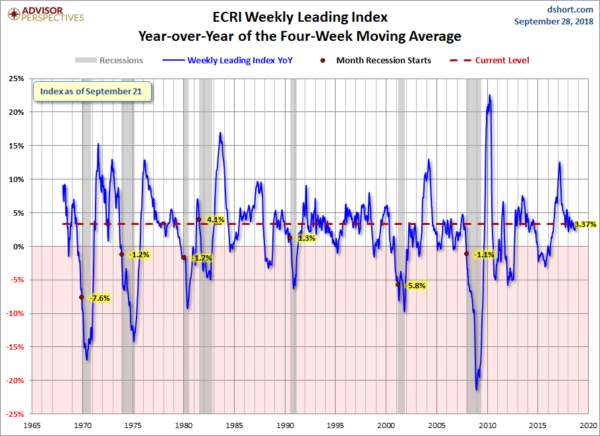
This next chart depicts, on a long-term basis, the Year-over-Year change in the 4-week moving average of the WLI:
ECRI WLI YoY of the Four-Week Moving Average
–
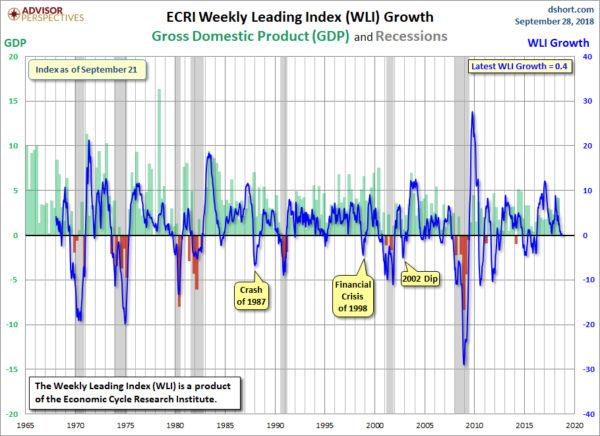
This last chart depicts, on a long-term basis, the WLI, Gr.:
ECRI WLI, Gr. .4
_________
I post various economic indicators and indices because I believe they should be carefully monitored.  However, as those familiar with this site are aware, I do not necessarily agree with what they depict or imply.
_____
The Special Note summarizes my overall thoughts about our economic situation
SPX at 2913.85 as this post is written

Friday, August 17, 2018

Long-Term Charts Of The ECRI WLI & ECRI WLI, Gr. – August 17, 2018 Update

As I stated in my July 12, 2010 post (“ECRI WLI Growth History“):
For a variety of reasons, I am not as enamored with ECRI’s WLI and WLI Growth measures as many are.
However, I do think the measures are important and deserve close monitoring and scrutiny.
Below are three long-term charts, from the Doug Short site’s ECRI update post of August 17, 2018 titled “ECRI Weekly Leading Index Update.”  These charts are on a weekly basis through the August 17, 2018 release, indicating data through August 10, 2018.
Here is the ECRI WLI (defined at ECRI’s glossary):
ECRI WLI 147.4
–
This next chart depicts, on a long-term basis, the Year-over-Year change in the 4-week moving average of the WLI:
ECRI Weekly Leading Index YoY of the Four-Week Moving Average
–
This last chart depicts, on a long-term basis, the WLI, Gr.:
ECRI WLI Gr. .3 Percent
_________
I post various economic indicators and indices because I believe they should be carefully monitored.  However, as those familiar with this site are aware, I do not necessarily agree with what they depict or imply.
_____
The Special Note summarizes my overall thoughts about our economic situation
SPX at 2850.14 as this post is written

Friday, July 27, 2018

Long-Term Charts Of The ECRI WLI & ECRI WLI, Gr. – July 27, 2018 Update

As I stated in my July 12, 2010 post (“ECRI WLI Growth History“):
For a variety of reasons, I am not as enamored with ECRI’s WLI and WLI Growth measures as many are.
However, I do think the measures are important and deserve close monitoring and scrutiny.
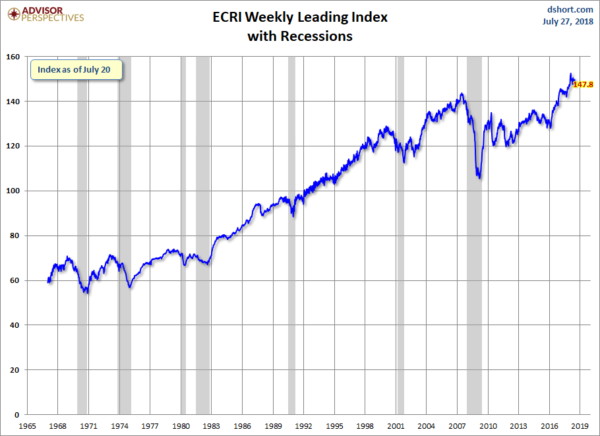
Below are three long-term charts, from the Doug Short site’s ECRI update post of July 27, 2018 titled “ECRI Weekly Leading Index Update.”  These charts are on a weekly basis through the July 27, 2018 release, indicating data through July 20, 2018.
Here is the ECRI WLI (defined at ECRI’s glossary):
ECRI WLI 147.8
–
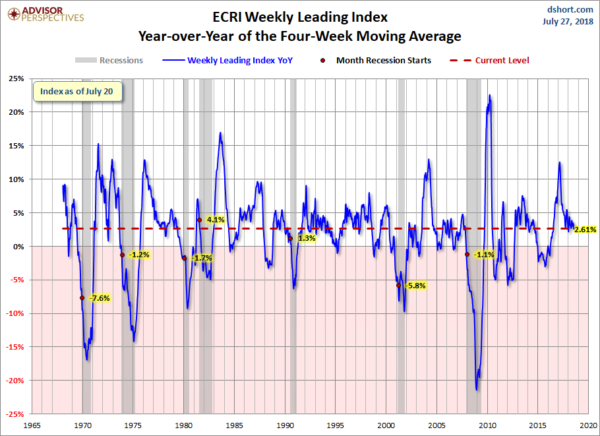
This next chart depicts, on a long-term basis, the Year-over-Year change in the 4-week moving average of the WLI:
ECRI WLI YoY of the Four-Week Moving Average 2.61 Percent
–
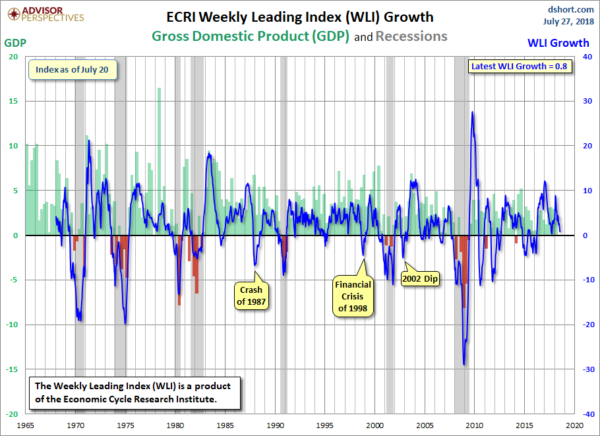
This last chart depicts, on a long-term basis, the WLI, Gr.:
ECRI WLI,Gr. .8 Percent
_________
I post various economic indicators and indices because I believe they should be carefully monitored.  However, as those familiar with this site are aware, I do not necessarily agree with what they depict or imply.
_____
The Special Note summarizes my overall thoughts about our economic situation
SPX at 2827.25 as this post is written
Friday, June 29, 2018

Long-Term Charts Of The ECRI WLI & ECRI WLI, Gr. – June 29, 2018 Update

As I stated in my July 12, 2010 post (“ECRI WLI Growth History“):
For a variety of reasons, I am not as enamored with ECRI’s WLI and WLI Growth measures as many are.
However, I do think the measures are important and deserve close monitoring and scrutiny.
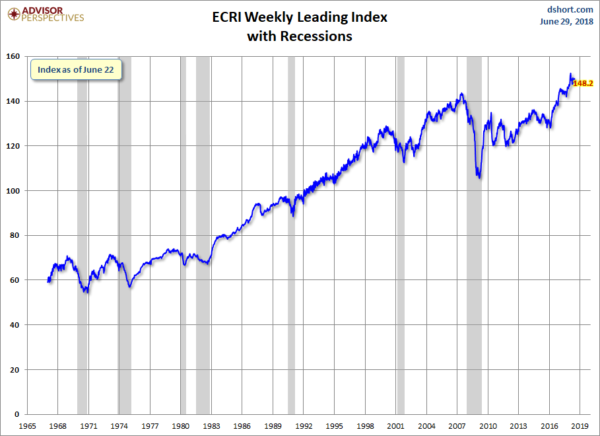
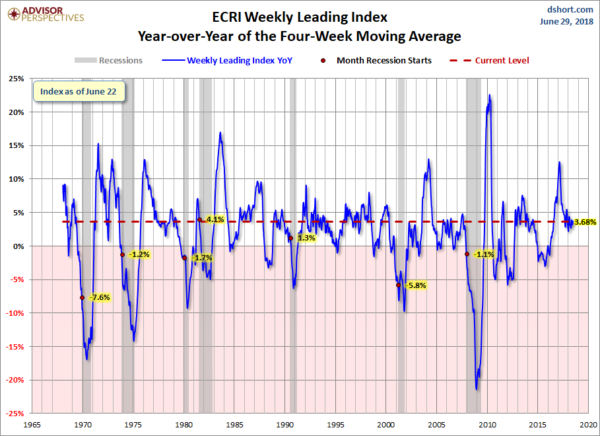
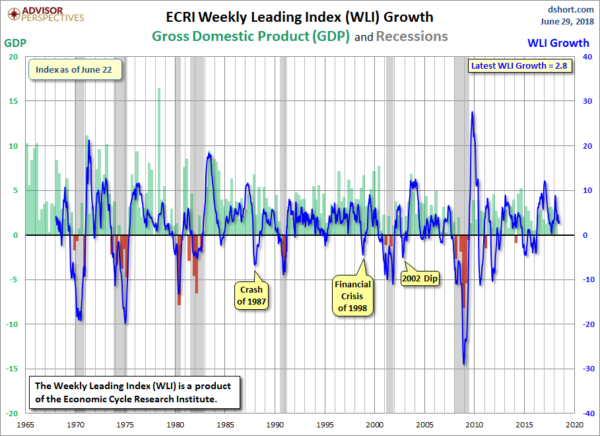
Below are three long-term charts, from the Doug Short site’s ECRI update post of June 29, 2018 titled “ECRI Weekly Leading Index Update.”  These charts are on a weekly basis through the June 29, 2018 release, indicating data through June 22, 2018.
Here is the ECRI WLI (defined at ECRI’s glossary):
ECRI WLI
–
This next chart depicts, on a long-term basis, the Year-over-Year change in the 4-week moving average of the WLI:
ECRI YoY 4-Week Moving Average
–
This last chart depicts, on a long-term basis, the WLI, Gr.:
ECRI WLI,Gr.
_________
I post various economic indicators and indices because I believe they should be carefully monitored.  However, as those familiar with this site are aware, I do not necessarily agree with what they depict or imply.
_____
The Special Note summarizes my overall thoughts about our economic situation
SPX at 2740.09 as this post is written
Friday, June 8, 2018

Long-Term Charts Of The ECRI WLI & ECRI WLI, Gr. – June 8, 2018 Update

As I stated in my July 12, 2010 post (“ECRI WLI Growth History“):
For a variety of reasons, I am not as enamored with ECRI’s WLI and WLI Growth measures as many are.
However, I do think the measures are important and deserve close monitoring and scrutiny.
Below are three long-term charts, from Doug Short’s ECRI update post of June 8, 2018 titled “ECRI Weekly Leading Index.”  These charts are on a weekly basis through the June 8, 2018 release, indicating data through June 1, 2018.
Here is the ECRI WLI (defined at ECRI’s glossary):
ECRI WLI
–
This next chart depicts, on a long-term basis, the Year-over-Year change in the 4-week moving average of the WLI:
ECRI WLI YoY of the Four-Week Moving Average
–
This last chart depicts, on a long-term basis, the WLI, Gr.:
ECRI WLI,Gr. 2.6 Percent
_________
I post various economic indicators and indices because I believe they should be carefully monitored.  However, as those familiar with this site are aware, I do not necessarily agree with what they depict or imply.
_____
The Special Note summarizes my overall thoughts about our economic situation
SPX at 2768.56 as this post is written
Friday, May 18, 2018

Long-Term Charts Of The ECRI WLI & ECRI WLI, Gr. – May 18, 2018 Update

As I stated in my July 12, 2010 post (“ECRI WLI Growth History“):
For a variety of reasons, I am not as enamored with ECRI’s WLI and WLI Growth measures as many are.
However, I do think the measures are important and deserve close monitoring and scrutiny.
Below are three long-term charts, from Doug Short’s ECRI update post of May 18, 2018 titled “ECRI Weekly Leading Index.”  These charts are on a weekly basis through the May 18, 2018 release, indicating data through May 11, 2018.
Here is the ECRI WLI (defined at ECRI’s glossary):
ECRI WLI
–
This next chart depicts, on a long-term basis, the Year-over-Year change in the 4-week moving average of the WLI:
–
This last chart depicts, on a long-term basis, the WLI, Gr.:
ECRI WLI,Gr.
_________
I post various economic indicators and indices because I believe they should be carefully monitored.  However, as those familiar with this site are aware, I do not necessarily agree with what they depict or imply.
_____
The Special Note summarizes my overall thoughts about our economic situation
SPX at 2714.80 as this post is written
Friday, April 13, 2018

Long-Term Charts Of The ECRI WLI & ECRI WLI, Gr. – April 13, 2018 Update

As I stated in my July 12, 2010 post (“ECRI WLI Growth History“):
For a variety of reasons, I am not as enamored with ECRI’s WLI and WLI Growth measures as many are.
However, I do think the measures are important and deserve close monitoring and scrutiny.
Below are three long-term charts, from Doug Short’s ECRI update post of April 13, 2018 titled “ECRI Weekly Leading Index.”  These charts are on a weekly basis through the April 13, 2018 release, indicating data through April 6, 2018.
Here is the ECRI WLI (defined at ECRI’s glossary):
ECRI WLI
–
This next chart depicts, on a long-term basis, the Year-over-Year change in the 4-week moving average of the WLI:
–
This last chart depicts, on a long-term basis, the WLI, Gr.:
ECRI WLI,Gr.
_________
I post various economic indicators and indices because I believe they should be carefully monitored.  However, as those familiar with this site are aware, I do not necessarily agree with what they depict or imply.
_____
The Special Note summarizes my overall thoughts about our economic situation
SPX at 2662.92 as this post is written
Friday, March 16, 2018

Long-Term Charts Of The ECRI WLI & ECRI WLI, Gr. – March 16, 2018 Update

As I stated in my July 12, 2010 post (“ECRI WLI Growth History“):
For a variety of reasons, I am not as enamored with ECRI’s WLI and WLI Growth measures as many are.
However, I do think the measures are important and deserve close monitoring and scrutiny.
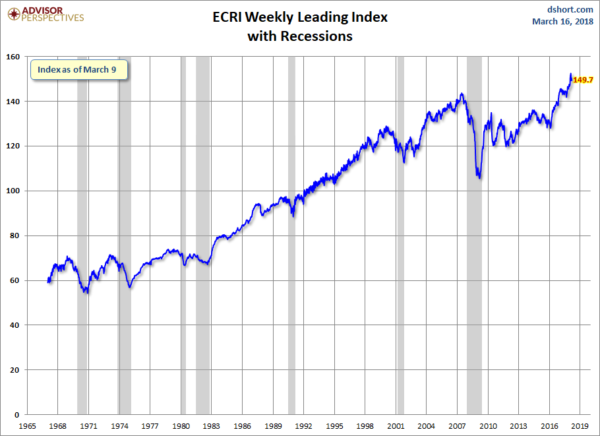
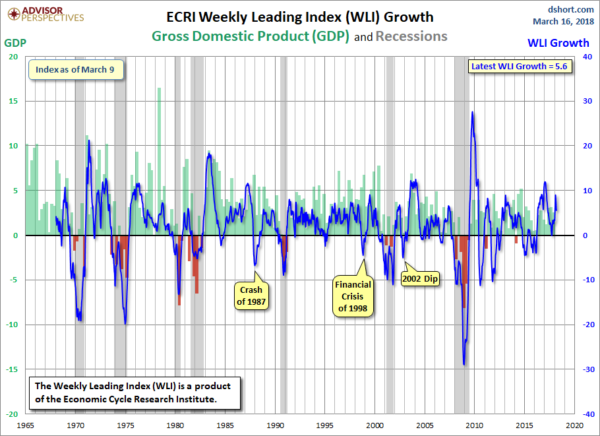
Below are three long-term charts, from Doug Short’s ECRI update post of March 16, 2018 titled “ECRI Weekly Leading Index.”  These charts are on a weekly basis through the March 16, 2018 release, indicating data through March 9, 2018.
Here is the ECRI WLI (defined at ECRI’s glossary):
ECRI WLI
–
This next chart depicts, on a long-term basis, the Year-over-Year change in the 4-week moving average of the WLI:
–
This last chart depicts, on a long-term basis, the WLI, Gr.:
ECRI WLI,Gr.
_________
I post various economic indicators and indices because I believe they should be carefully monitored.  However, as those familiar with this site are aware, I do not necessarily agree with what they depict or imply.
_____
The Special Note summarizes my overall thoughts about our economic situation
SPX at 2753.23 as this post is written
Friday, March 2, 2018

Long-Term Charts Of The ECRI WLI & ECRI WLI, Gr. – March 2, 2018 Update

As I stated in my July 12, 2010 post (“ECRI WLI Growth History“):
For a variety of reasons, I am not as enamored with ECRI’s WLI and WLI Growth measures as many are.
However, I do think the measures are important and deserve close monitoring and scrutiny.
Below are three long-term charts, from Doug Short’s ECRI update post of March 2, 2018 titled “ECRI Weekly Leading Index Update:  WLI Up from Last Week.”  These charts are on a weekly basis through the March 2, 2018 release, indicating data through February 23, 2018.
Here is the ECRI WLI (defined at ECRI’s glossary):
ECRI WLI
–
This next chart depicts, on a long-term basis, the Year-over-Year change in the 4-week moving average of the WLI:
–
This last chart depicts, on a long-term basis, the WLI, Gr.:
ECRI WLI,Gr.
_________
I post various economic indicators and indices because I believe they should be carefully monitored.  However, as those familiar with this site are aware, I do not necessarily agree with what they depict or imply.
_____
The Special Note summarizes my overall thoughts about our economic situation
SPX at 2674.39 as this post is written

Friday, February 9, 2018

Long-Term Charts Of The ECRI WLI & ECRI WLI, Gr. – February 9, 2018 Update

As I stated in my July 12, 2010 post (“ECRI WLI Growth History“):
For a variety of reasons, I am not as enamored with ECRI’s WLI and WLI Growth measures as many are.
However, I do think the measures are important and deserve close monitoring and scrutiny.
Below are three long-term charts, from Doug Short’s ECRI update post of February 9, 2018 titled “ECRI Weekly Leading Index Update:  Yet Another Record High for WLI.”  These charts are on a weekly basis through the February 9, 2018 release, indicating data through February 2, 2018.
Here is the ECRI WLI (defined at ECRI’s glossary):
ECRI WLI
–
This next chart depicts, on a long-term basis, the Year-over-Year change in the 4-week moving average of the WLI:
–
This last chart depicts, on a long-term basis, the WLI, Gr.:
ECRI WLI,Gr.
_________
I post various economic indicators and indices because I believe they should be carefully monitored.  However, as those familiar with this site are aware, I do not necessarily agree with what they depict or imply.
_____
The Special Note summarizes my overall thoughts about our economic situation
SPX at 2546.75 as this post is written