Showing posts with label Gallup. Show all posts

Tuesday, January 28, 2025

January 28, 2025 Gallup Poll Results On Economic Confidence – Notable Excerpts

On January 28, 2025 Gallup released the poll results titled “U.S. Economic Confidence Ticks Down as Partisans’ Views Shift.”

Notable excerpts include:

This month, 26% of U.S. adults say economic conditions are “excellent” or “good,” while 33% call them “only fair” and 40% “poor.” This results in a -14 score on the current conditions component of the index for the third month in a row, which is slightly higher than the 2024 average of -19. The last time the current conditions score was better than now was in March 2024 (-9).

also:

When asked about the economy’s direction, 34% of Americans say conditions are getting better, while 57% say they’re getting worse. Slightly fewer Americans now than in December (38%) say the economy is getting better.

Here is an accompanying chart of the Gallup Economic Confidence Index:

Gallup Economic Confidence Index1996-2025

_____

The Special Note summarizes my overall thoughts about our economic situation

SPX at 6012.28 as this post is written

Friday, June 28, 2024

June 28, 2024 Gallup Poll Results On Economic Confidence – Notable Excerpts

On June 28, 2024 Gallup released the poll results titled “June’s Economic Confidence: Stable And Low.”

Notable excerpts include:

Twenty-five percent of Americans describe current U.S. economic conditions as “excellent” or “good,” up three points from May. However, the percentage rating conditions “poor,” now 48%, also increased slightly, blunting positive movement in the index.

The high proportion of Americans rating the economy as poor continues the dominance of this response in the trend since early 2022.

also:

Americans have also been consistently more negative than positive since May 2021 in their assessments of the economy’s trajectory.

The June 2024 survey finds that about seven in 10 Americans (69%) believe the economy is “getting worse,” while 26% say it is “getting better.” This is essentially unchanged from last month.

Here is an accompanying chart of the Gallup Economic Confidence Index:

Gallup Economic Confidence Index 1996-2024

_____

The Special Note summarizes my overall thoughts about our economic situation

SPX at 5482.87 as this post is written

Friday, March 31, 2023

March 31, 2023 Gallup Poll Results On Economic Confidence – Notable Excerpts

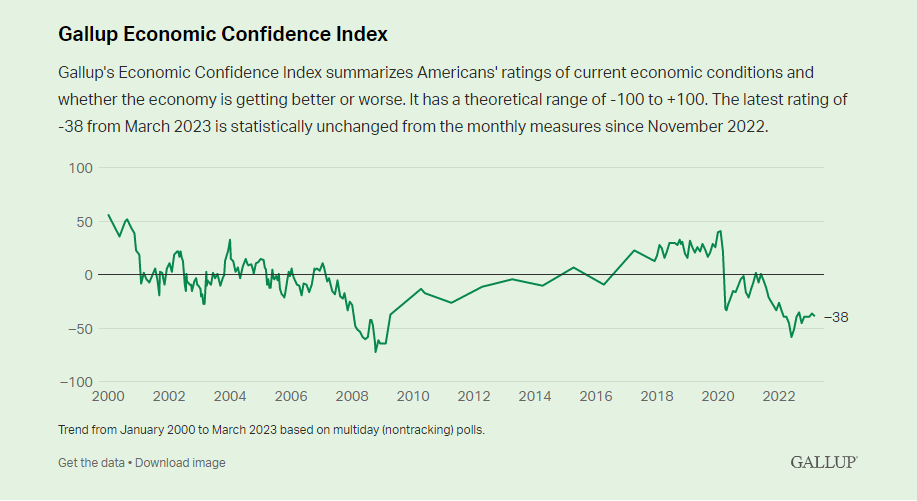
On March 31, 2023 Gallup released the poll results titled “Economic Pessimism Persists, With Inflation Still Key Concern.”

Notable excerpts include:

The American public continues to rate the U.S. economy in mostly negative terms in March, with 83% describing current economic conditions as “only fair” or “poor.” Just 16% consider them “excellent” or “good.” Furthermore, 72% think conditions are getting worse, while 23% say they are improving.

also:

Gallup combines Americans’ rating of current economic conditions with their perception of the economy’s direction to create its Economic Confidence Index. This month’s index score is -38, which is the average of Americans’ net-positive rating of current conditions (the percentage rating the economy as excellent or good minus the percentage rating it poor) and their net-positive outlook score (the percentage saying the economy is getting better minus the percentage saying it is getting worse).

The index has a theoretical range of +100 (if all respondents rate the economy as excellent or good and say it’s improving) to -100 (if all rate it as poor and say it’s getting worse). In practice, the highest the index has been since Gallup began tracking the component questions in 1992 was +56 in January 2000, and the lowest was -72 in October 2008.

Here is an accompanying chart of the Gallup Economic Confidence Index:

Gallup Economic Confidence Index

_____

The Special Note summarizes my overall thoughts about our economic situation

SPX at 4081.05 as this post is written

Wednesday, August 31, 2022

August 31, 2022 Gallup Poll Results On Economic Confidence – Notable Excerpts

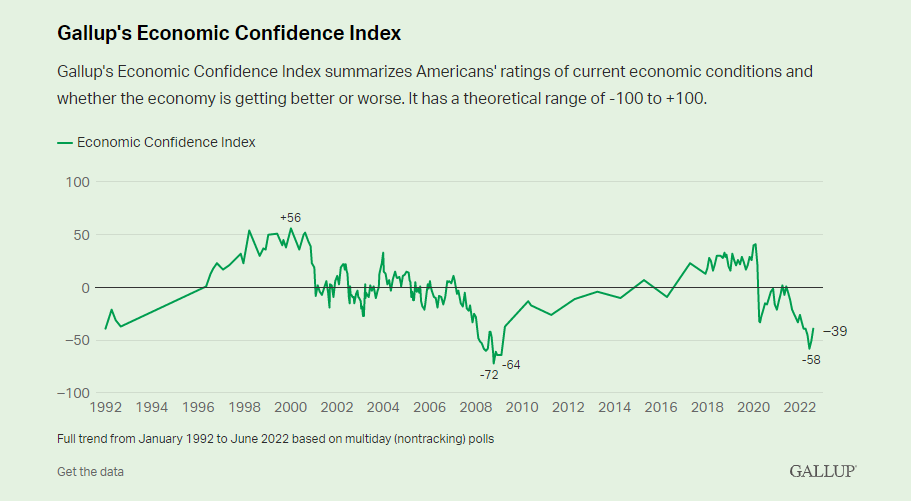
On August 31, 2022 Gallup released the poll results titled “U.S. Economic Confidence Improving but Still Weak.”

Notable excerpts include:

Americans are significantly less negative in their evaluations of the U.S. economy than they were in July, with Gallup’s Economic Confidence Index improving from -51 to -39. The index recently hit a 13-year low of -58 in June, the worst since the Great Recession. Confidence has now returned to the levels it was at in March and April.

also:

Currently, 16% of U.S. adults rate current conditions as excellent or good, while 47% describe them as poor. An additional 36% say they are “only fair.” In July, 14% rated conditions positively and 52% poorly.

Here is an accompanying chart of the Gallup Economic Confidence Index:

Gallup's Economic Confidence Index

_____

The Special Note summarizes my overall thoughts about our economic situation

SPX at 3972.24 as this post is written

Friday, January 29, 2021

January 28, 2021 Gallup Poll Results On Economic Confidence – Notable Excerpts

On January 28, 2021 Gallup released the poll results titled “Americans’ Economic Mood Sinks for Second Straight Month.”

Notable excerpts include:

Americans’ assessments of the U.S. economy worsened in January after an even larger stumble in December, but following seven months when economic perceptions had generally shown modest improvements. The five-point decline in Gallup’s Economic Confidence Index to -21 this month puts the index at a level not seen since June.

also:

In April, the U.S. unemployment rate peaked at a pandemic-fueled 14.8%, and Americans’ impressions of whether it was a good time to find a quality job fell 46 points to 22% as millions of workers lost their jobs. By November, the unemployment rate had improved to 6.7%, and 36% of U.S. adults said it was a good time to find a quality job. But in the latest poll, taken as the unemployment rate has plateaued, Americans’ optimism about jobs has declined to 27%.

Here is an accompanying chart of the Gallup Economic Confidence Index from 1996-2021:

Gallup Economic Confidence Index 1996-2021

_____

The Special Note summarizes my overall thoughts about our economic situation

SPX at 3787.38 as this post is written

Monday, January 27, 2020

January 23, 2020 Gallup Poll Results On Economic Confidence – Notable Excerpts

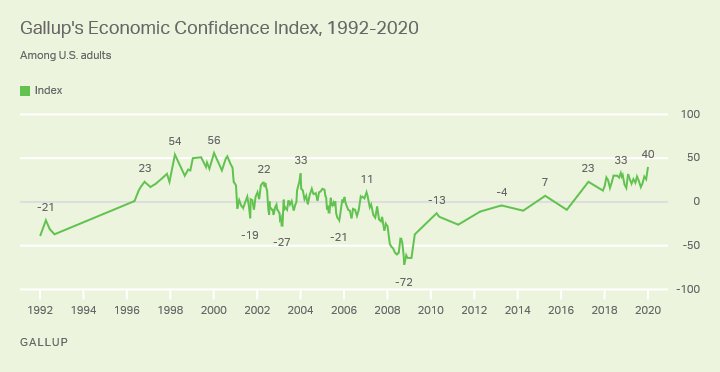
On January 23, 2020 Gallup released the poll results titled “U.S. Economic Confidence at Highest Point Since 2000.”
Notable excerpts include:
Americans’ confidence in the U.S. economy is higher than at any point in about two decades. The latest figure from Gallup’s Economic Confidence Index is +40, the highest reading recorded since +44 in October 2000.
also:
Gallup’s Economic Confidence Index is the average of two components: Americans’ ratings of current economic conditions and their views on whether the economy is getting better or getting worse. The index has a theoretical maximum of +100, achieved if all Americans believe the economy is excellent or good and getting better. The theoretical minimum is -100, if all Americans say the economy is poor and getting worse.
The current conditions component score of +54 is the result of 62% of Americans saying the economy is “excellent” or “good” and 8% describing it as “poor.” Meanwhile, the economic outlook component score of +26 is the result of 59% saying the economy is “getting better” and 33% saying it is “getting worse.”
Also of note is other commentary, including a section titled “Mentions of Economic Issues as Greatest U.S. Problem at a Record Low.”
Here is an accompanying chart of the Gallup Economic Confidence Index from 1992-2020:
Gallup's Economic Confidence Index 1992-2020
_____
The Special Note summarizes my overall thoughts about our economic situation
SPX at 3251.63 as this post is written

Tuesday, October 3, 2017

October 3, 2017 Gallup Poll Results On Economic Confidence – Notable Excerpts

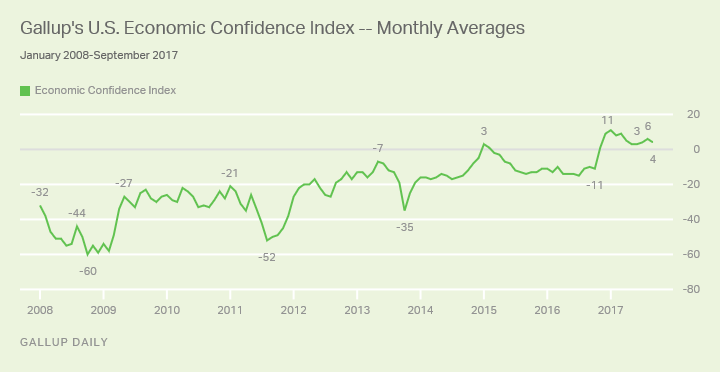
On October 3, 2017 Gallup released the poll results titled “Confidence in U.S. Economy Dips to +4 in September.”
Notable excerpts include:
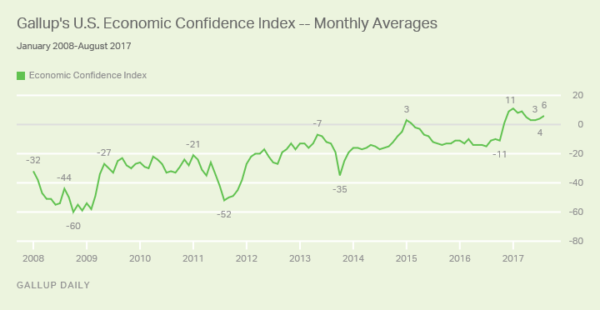
Americans’ confidence in the economy declined slightly in September, with Gallup’s U.S. Economic Confidence Index slipping to +4 from August’s reading of +6.
also:
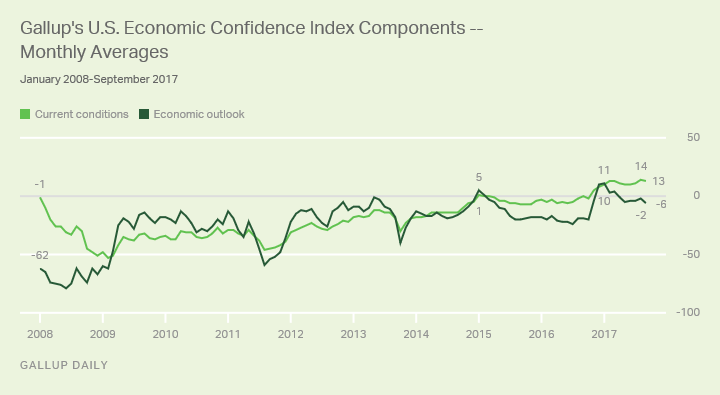
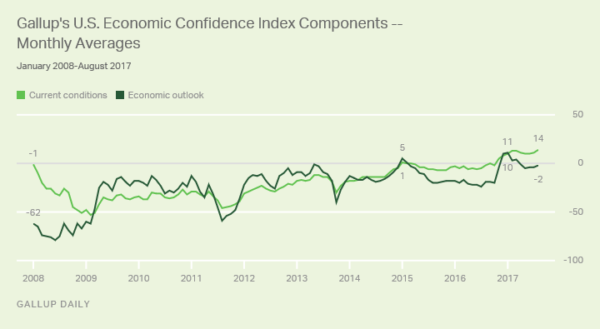
Gallup’s U.S. Economic Confidence Index is the average of two components: how Americans rate current economic conditions and whether they believe the economy is improving or getting worse. The index has a theoretical maximum of +100 if all Americans were to say the economy is doing well and improving and a theoretical minimum of -100 if all were to say the economy is doing poorly and getting worse.
also:
The current conditions component measured +13 in September, the result of 34% describing the economy as “excellent” or “good” minus the 21% describing the economy as “poor.” September’s current conditions score essentially ties the +14 observed in August — the highest monthly reading in the 2008-2017 Gallup Daily tracking trend.
However, economic expectations dimmed slightly in September. Over the course of the month, half of Americans said economic conditions were “getting worse,” while 44% said conditions were “getting better,” resulting in an economic outlook score of -6. This is down four points from August’s -2 outlook score — but, as was the case with the overall metric, was no different from how this component performed in the final half of August. In the first half of August, by contrast, the economic outlook component was neutral, meaning it averaged a score of 0.
Here is an accompanying chart of the two components of the Gallup Economic Confidence Index, discussed above:
Gallup's U.S. Economic Confidence Index Components - Monthly Averages
Here is an accompanying chart of the Gallup Economic Confidence Index:
Gallup's U.S. Economic Confidence Index - Monthly Averages

_____
The Special Note summarizes my overall thoughts about our economic situation
SPX at 2531.87 as this post is written

Tuesday, September 5, 2017

September 5, 2017 Gallup Poll Results On Economic Confidence – Notable Excerpts

On September 5, 2017 Gallup released the poll results titled “U.S. Economic Confidence Surges, Then Declines, in August.”
Notable excerpts include:
Gallup’s U.S. Economic Confidence Index is the average of two components: how Americans rate current economic conditions and whether they believe the economy is improving or getting worse. The index has a theoretical maximum of +100 if all Americans were to say the economy is doing well and improving, and a theoretical minimum of -100 if all were to say the economy is doing poorly and getting worse.
Last month, 35% of Americans described current economic conditions as “excellent” or “good,” while 21% assessed them as “poor.” Overall, the current conditions component of Gallup’s U.S. Economic Confidence Index stood at +14 for the month, slightly better than July’s +11 and the highest monthly average for this component since 2008.
Slightly more Americans, meanwhile, continued to say the economy was “getting worse” (48%) than “getting better” (46%) in August. This leaves the economic outlook component at -2 for the month, essentially no different from its performance in July (-4).
Here is an accompanying chart of the two components of the Gallup Economic Confidence Index, discussed above:
Gallup's U.S. Economic Confidence Index Components - Monthly Averages
Here is an accompanying chart of the Gallup Economic Confidence Index:
Gallup's U.S. Economic Confidence - Monthly Averages

_____
The Special Note summarizes my overall thoughts about our economic situation
SPX at 2457.85 as this post is written

Wednesday, August 2, 2017

August 1, 2017 Gallup Poll Results On Economic Confidence – Notable Excerpts

On August 1, 2017 Gallup released the poll results titled “Americans’ Confidence in Economy Positive but Near 2017 Low.”

Notable excerpts include:
Americans' confidence in the economy was steady last month, with Gallup's U.S. Economic Confidence Index averaging +4 in July. This score is nearly identical to the 2017 low of +3 registered in May and June. Still, July marked the ninth consecutive month that Americans rated the economy more positively than negatively -- the longest such streak since Gallup began tracking economic confidence in 2008.
also:
Gallup's U.S. Economic Confidence Index is the average of two components: how Americans rate current economic conditions and whether they believe the economy is improving or getting worse. The index has a theoretical maximum of +100 if all Americans were to say the economy is doing well and improving, and a theoretical minimum of -100 if all were to say the economy is doing poorly and getting worse.
also:
Last month, Americans continued to see current economic conditions positively, with 33% describing the economy as "excellent" or "good," compared with 22% describing it as "poor." This leaves the current conditions component at +11 for the month -- nearly identical to its performance in June (+10).
In July, the greater share of Americans continued to see the economy as "getting worse" (49%) rather than "getting better" (45%), as has been the case since May. As a result, the economic outlook component equaled -4 last month, on par with May (-5) and June (-4).
Here is an accompanying chart of the two components of the Gallup Economic Confidence Index, discussed above:

Gallup U.S. Economic Confidence Index Components

Here is an accompanying chart of the Gallup Economic Confidence Index:

Gallup U.S. Economic Confidence Monthly Averages

_____

The Special Note summarizes my overall thoughts about our economic situation

SPX at 2476.35 as this post is written

Wednesday, July 5, 2017

July 5, 2017 Gallup Poll Results On Economic Confidence – Notable Excerpts

On July 5, 2017 Gallup released the poll results titled “Americans' Confidence In Economy Remains at Low for the Year.”

Notable excerpts include:
Americans' confidence in the economy remained at a 2017 low in June, with Gallup's U.S. Economic Confidence Index averaging +3 for the second month in a row. Despite confidence lagging below January's monthly record high of +11, June nonetheless marked the eighth consecutive month in which U.S. adults rated the economy positively.
Gallup's U.S. Economic Confidence Index is the average of two components: how Americans rate current economic conditions and whether they believe the economy is improving or getting worse. The index has a theoretical maximum of +100 if all Americans were to say the economy is doing well and improving, and a theoretical minimum of -100 if all were to say the economy is doing poorly and getting worse.
Last week, Americans' confidence in the economy averaged a score of 0, the first time in the 33 full weeks since the presidential election that the index's weekly average was not positive. However, this may be more of a fluke than a harbinger -- lower scores in the middle of the week dragged down the weekly average. They returned to previous levels by the end of the week.
also:
Last month, Americans continued to view current economic conditions positively, with 33% describing the economy as "excellent" or "good" compared with 23% describing it as "poor." This leaves the current conditions component at +10 for June, identical to its performance in May.
For the third month in a row, however, a slightly larger share of Americans (49%) said the economy is "getting worse" than said it is "getting better" (45%). This puts the economic outlook component at -4 in June, in line with its May reading.
Here is an accompanying chart of the two components of the Gallup Economic Confidence Index, discussed above:

Gallup U.S. Economic Confidence Index Components - Monthly Averages

Here is an accompanying chart of the Gallup Economic Confidence Index:

Gallup U.S. Economic Confidence Index - Monthly Averages


_____

The Special Note summarizes my overall thoughts about our economic situation

SPX at 2432.54 as this post is written

Tuesday, June 6, 2017

June 6, 2017 Gallup Poll Results On Economic Confidence – Notable Excerpts

On June 6, 2017 Gallup released the poll results titled “Confidence In Economy in May Lowest Since November 2016.”
Notable excerpts include:
Though still historically high, Americans' confidence in the economy fell to a six-month low in May, largely dragged down by Democrats' worsening economic attitudes. Gallup's U.S. Economic Confidence Index averaged a score of +3 in May, down slightly from April (+5) but eight points below January's record monthly high (+11).
Gallup's U.S. Economic Confidence Index is the average of two components: how Americans rate current economic conditions and whether they believe the economy is improving or getting worse. The index has a theoretical maximum of +100 if all Americans were to say the economy is doing well and improving, and a theoretical minimum of -100 if all were to say the economy is doing poorly and getting worse.
also:
Even as some Americans become more pessimistic about the economy overall, attitudes about the economy's current conditions have been relatively stable. Last month, 32% of Americans assessed the economy as "excellent" or "good," while 22% said the economy was "poor." Overall, the current conditions component averaged +10 in May, similar to +11 in April and three points shy of the nine-year high (+13) the measure hit in February and March.
Meanwhile, perceptions about the economy's outlook have more clearly deteriorated. In May, slightly more Americans (49%) said the economy was "getting worse" than said it was "getting better" (45%). The economic outlook component stood at -4 for the month, representing a slight dip from April when the component averaged -1, and it is down notably from its record high in January of +11.
Here is an accompanying chart of the two components of the Gallup Economic Confidence Index, discussed above:
Gallup U.S. Economic Confidence Index Components
Here is an accompanying chart of the Gallup Economic Confidence Index:
Gallup U.S. Economic Confidence Index - Monthly Averages

_____
The Special Note summarizes my overall thoughts about our economic situation
SPX at 2429.33 as this post is written

Tuesday, May 2, 2017

May 2, 2017 Gallup Poll Results On Economic Confidence – Notable Excerpts

On May 2, 2017 Gallup released the poll results titled “U.S. Economic Confidence Index Falls in April, but Still Positive.”
Notable excerpts include:
Americans' economic confidence weakened slightly in April, but they remain positive about the current state of the U.S. economy. Gallup's U.S. Economic Confidence Index averaged +5 in April, down four points from March's average. Despite the dip, confidence has been in positive territory for six consecutive months -- the longest such streak in the past nine years.
also:
Gallup's U.S. Economic Confidence Index is the average of two components: how Americans rate current economic conditions and whether they feel the economy is improving or getting worse. The index has a theoretical maximum of +100 if all Americans were to say the economy is doing well and improving, and a theoretical minimum of -100 if all were to say the economy is doing poorly and getting worse.
In April, 32% of Americans rated economic conditions in the country as "excellent" or "good," while 21% rated conditions as "poor." This left the current conditions component of the index at +11 for the month, down slightly from March's +13.
Meanwhile, 46% of Americans said the economy was "getting better" in April, while 47% said it was "getting worse." Because of this, the economic outlook component fell to -1 from +4 in March.
Here is an accompanying chart of the two components of the Gallup Economic Confidence Index, discussed above:
Gallup U.S. Economic Confidence Components
Here is an accompanying chart of the Gallup Economic Confidence Index:
U.S. Economic Confidence Index - Monthly Averages

_____
The Special Note summarizes my overall thoughts about our economic situation
SPX at 2388.20 as this post is written

Tuesday, April 4, 2017

April 4, 2017 Gallup Poll Results On Economic Confidence – Notable Excerpts

On April 4, 2017 Gallup released the poll results titled “U.S. Economic Confidence Index Unchanged in March.”
Notable excerpts include:
Still, Americans' economic confidence has remained positive overall for 20 straight weeks -- since the week after the presidential election in November -- making it the longest positive streak since Gallup began tracking the measure.
also:
Gallup's U.S. Economic Confidence Index is the average of two components: how Americans rate current economic conditions and whether they feel the economy is improving or getting worse. The index has a theoretical maximum of +100 if all Americans were to say the economy is doing well and improving, and a theoretical minimum of -100 if all Americans were to say the economy is doing poorly and getting worse.
In March, one-third of U.S. adults (33%) described economic conditions as "excellent" or "good," while 20% rated them as "poor." This resulted in a current conditions score of +13 for the month -- the same as in February.
Meanwhile, 49% of U.S. adults said economic conditions were "getting better," while 45% said they were "getting worse," resulting in an economic outlook score of +4 -- similar to February's +3 for this component.
Here is an accompanying chart of the two components of the Gallup Economic Confidence Index, discussed above:
Gallup U.S. Economic Confidence components
Here is an accompanying chart of the Gallup Economic Confidence Index:
Gallup U.S. Economic Confidence Index

_____
The Special Note summarizes my overall thoughts about our economic situation
SPX at 2351.00 as this post is written

Tuesday, February 7, 2017

February 7, 2017 Gallup Poll Results On Economic Confidence – Notable Excerpts

On February 7, 2017 Gallup released the poll results titled “U.S. Economic Confidence Index Hit New High in January.”
Notable excerpts include:
Americans' confidence in the U.S. economy remained strong in January. Gallup's U.S. Economic Confidence Index averaged +11, the highest monthly average in Gallup's nine-year trend. However, the index has been slightly lower so far in February.
also:
Gallup's U.S. Economic Confidence Index is the average of two components: how Americans rate current economic conditions and whether they feel the economy is improving or getting worse. The index has a theoretical maximum of +100 if all Americans were to say the economy is doing well and improving, and a theoretical minimum of -100 if all Americans were to say the economy is doing poorly and getting worse.
In January, 31% of Americans rated the economy as "excellent" or "good," while 21% said it was "poor," resulting in a current conditions score of +10 -- marking the highest monthly reading for this component since 2008.
The economic outlook component also reached a new high score of +11 in January. This score was the result of 52% of Americans saying economic conditions in the country were "getting better," while 41% said they were "getting worse."
Here is an accompanying chart of the two components of the Gallup Economic Confidence Index, discussed above:
Gallup U.S. Economic Confidence Index Components - Monthly Averages
Here is an accompanying chart of the Gallup Economic Confidence Index:
Gallup U.S. Economic Confidence Index - Monthly Averages

_____
The Special Note summarizes my overall thoughts about our economic situation
SPX at 2292.38 as this post is written