Showing posts with label residential real estate. Show all posts

Monday, February 23, 2026

Fannie Mae Home Price Expectations Survey (HPES) Q1 2026

On February 23, 2026, the Fannie Mae Q1 2026 Home Price Expectations Survey (HPES) results were released.  This survey is done on a quarterly basis.

Various Q1 2026 Fannie Mae Home Price Expectations Survey information is available, including the chart seen below:

As one can see from the above chart, the average expectation is that the residential real estate market, as depicted by the Fannie Mae Home Price Index, will continually climb.

The detail of the survey is interesting.  Of the survey respondents, only four (of the displayed responses) forecasts a cumulative price decrease through 2030.

The Median Cumulative Home Price Appreciation for years 2026-2030 is seen as 2.15%, 4.65%, 7.74%, 11.18%, and 14.80%, respectively.

For a variety of reasons, I continue to believe that these forecasts will prove far too optimistic.

I have written extensively about the residential real estate situation.  For a variety of reasons, it is exceedingly complex.  While many people continue to have an optimistic view regarding future residential real estate prices, in my opinion such a view is unsupported on an “all things considered” basis.  Residential real estate is an exceedingly large asset bubble. As such, from these price levels there exists potential for a price decline of outsized magnitude. 

_____

The Special Note summarizes my overall thoughts about our economic situation

SPX at 6833.34 as this post is written

Thursday, December 11, 2025

Fannie Mae Home Price Expectations Survey (HPES) Q4 2025

On December 11, 2025, the Fannie Mae Q4 2025 Home Price Expectations Survey (HPES) results were released.  This survey is done on a quarterly basis.

Various Q4 2025 Fannie Mae Home Price Expectations Survey information is available, including the chart seen below:

Q4 2025 U.S. Home Price Expectations

As one can see from the above chart, the average expectation is that the residential real estate market, as depicted by the Fannie Mae Home Price Index, will continually climb.

The detail of the survey is interesting.  Of the survey respondents, only three (of the displayed responses) forecasts a cumulative price decrease through 2030.

The Median Cumulative Home Price Appreciation for years 2025-2030 is seen as 2.70%, 4.84%, 7.69%, 11.39%, 15.68%, and 20.22%, respectively.

For a variety of reasons, I continue to believe that these forecasts will prove far too optimistic.

I have written extensively about the residential real estate situation.  For a variety of reasons, it is exceedingly complex.  While many people continue to have an optimistic view regarding future residential real estate prices, in my opinion such a view is unsupported on an “all things considered” basis.  Residential real estate is an exceedingly large asset bubble. As such, from these price levels there exists potential for a price decline of outsized magnitude. 

_____

The Special Note summarizes my overall thoughts about our economic situation

SPX at 6901.00 as this post is written

Tuesday, November 25, 2025

House Prices Reference Chart

As a reference for long-term house price index trends, below is a chart, updated with the most current data (through September 2025) from the CalculatedRisk blog post of November 25, 2025 titled “Case-Shiller : National House Price Index…“:

Case Shiller National and Composite Indices

_________

I post various indicators and indices because I believe they should be carefully monitored.  However, as those familiar with this site are aware, I do not necessarily agree with what they depict or imply.

_____

The Special Note summarizes my overall thoughts about our economic situation

SPX at 6465.94 as this post is written
Tuesday, August 26, 2025

House Prices Reference Chart

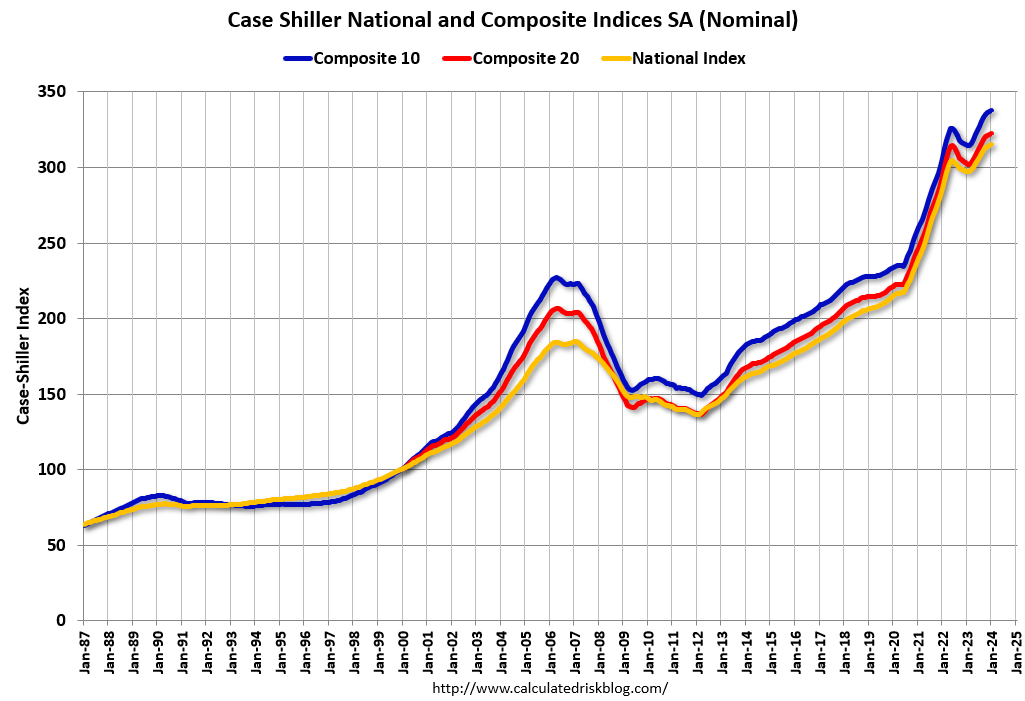
As a reference for long-term house price index trends, below is a chart, updated with the most current data (through June 2025) from the CalculatedRisk blog post of August 26, 2025 titled “Case-Shiller : National House Price Index…“:

house prices indexes

_________

I post various indicators and indices because I believe they should be carefully monitored.  However, as those familiar with this site are aware, I do not necessarily agree with what they depict or imply.

_____

The Special Note summarizes my overall thoughts about our economic situation

SPX at 6465.94 as this post is written
Friday, June 13, 2025

Fannie Mae Home Price Expectations Survey (HPES) Q2 2025

On June 13, 2025, the Fannie Mae Q2 2025 Home Price Expectations Survey (HPES) results were released.  This survey is done on a quarterly basis.

Various Q2 2025 Fannie Mae Home Price Expectations Survey information is available, including the chart seen below:

U.S. Home Price Expectations

As one can see from the above chart, the average expectation is that the residential real estate market, as depicted by the Fannie Mae Home Price Index, will continually climb.

The detail of the survey is interesting.  Of the survey respondents, only two (of the displayed responses) forecasts a cumulative price decrease through 2029.

The Median Cumulative Home Price Appreciation for years 2025-2029 is seen as 3.40%, 6.60%, 10.44%, 14.70%, and 19.11%, respectively.

For a variety of reasons, I continue to believe that these forecasts will prove far too optimistic.

I have written extensively about the residential real estate situation.  For a variety of reasons, it is exceedingly complex.  While many people continue to have an optimistic view regarding future residential real estate prices, in my opinion such a view is unsupported on an “all things considered” basis.  Residential real estate is an exceedingly large asset bubble. As such, from these price levels there exists potential for a price decline of outsized magnitude. 

_____

The Special Note summarizes my overall thoughts about our economic situation

SPX at 5979.93 as this post is written
Tuesday, May 27, 2025

House Prices Reference Chart

As a reference for long-term house price index trends, below is a chart, updated with the most current data (through March 2025) from the CalculatedRisk blog post of May 27, 2025 titled “Case-Shiller : National House Price Index…“:

Case Shiller price indexes

_________

I post various indicators and indices because I believe they should be carefully monitored.  However, as those familiar with this site are aware, I do not necessarily agree with what they depict or imply.

_____

The Special Note summarizes my overall thoughts about our economic situation

SPX at 5899.77 as this post is written

Tuesday, April 15, 2025

Fannie Mae Home Price Expectations Survey (HPES) Q1 2025

On April 15, 2025, the Fannie Mae Q1 2025 Home Price Expectations Survey (HPES) results were released.  This survey is done on a quarterly basis.

Various Q1 2025 Fannie Mae Home Price Expectations Survey information is available, including the chart seen below:

U.S. Home Price Expectations

As one can see from the above chart, the average expectation is that the residential real estate market, as depicted by the Fannie Mae Home Price Index, will continually climb.

The detail of the survey is interesting.  Of the survey respondents, two (of the displayed responses) forecasts a cumulative price decrease through 2029.

The Median Cumulative Home Price Appreciation for years 2025-2029 is seen as 4.00%, 7.51%, 11.39%, 16.06%, and 21.15%, respectively.

For a variety of reasons, I continue to believe that these forecasts will prove far too optimistic.

I have written extensively about the residential real estate situation.  For a variety of reasons, it is exceedingly complex.  While many people continue to have an optimistic view regarding future residential real estate prices, in my opinion such a view is unsupported on an “all things considered” basis.  Residential real estate is an exceedingly large asset bubble. As such, from these price levels there exists potential for a price decline of outsized magnitude. 

_____

The Special Note summarizes my overall thoughts about our economic situation

SPX at 5400.27 as this post is written

Tuesday, March 25, 2025

House Prices Reference Chart

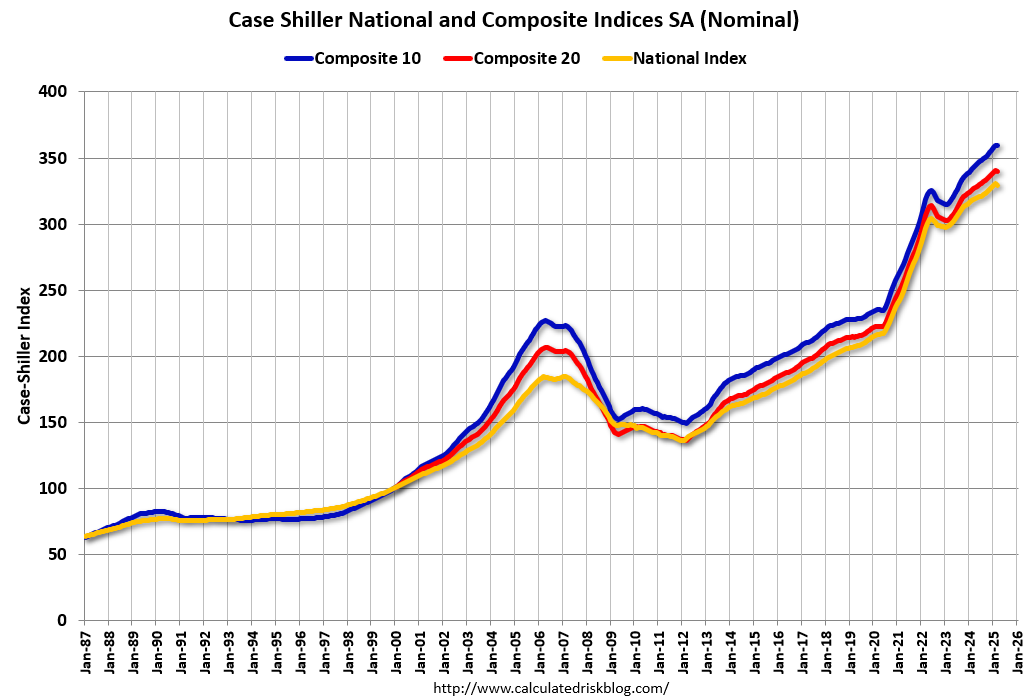
As a reference for long-term house price index trends, below is a chart, updated with the most current data (through January 2025) from the CalculatedRisk blog post of March 25, 2025 titled “Case-Shiller : National House Price Index…“:

house price indexes

_________

I post various indicators and indices because I believe they should be carefully monitored.  However, as those familiar with this site are aware, I do not necessarily agree with what they depict or imply.

_____

The Special Note summarizes my overall thoughts about our economic situation

SPX at 5764.06 as this post is written

Thursday, December 5, 2024

Fannie Mae Home Price Expectations Survey (HPES) Q4 2024

On December 5, 2024, the Fannie Mae Q4 2024 Home Price Expectations Survey (HPES) results were released.  This survey is done on a quarterly basis.

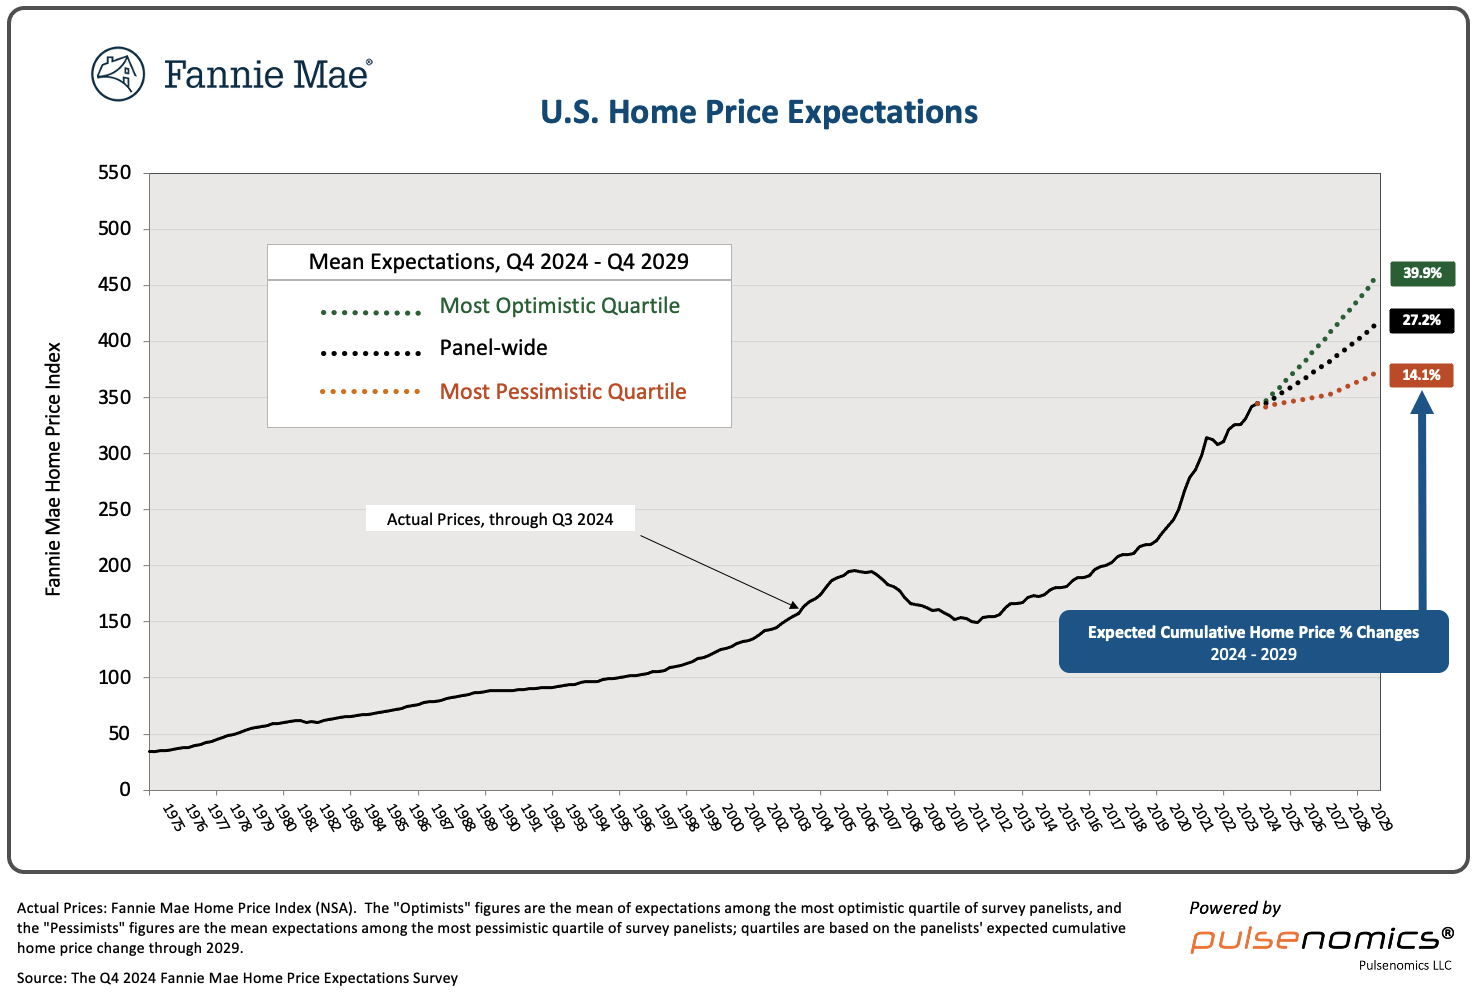
Various Q4 2024 Fannie Mae Home Price Expectations Survey information is available, including the chart seen below:

U.S. Home Price Expectations

As one can see from the above chart, the average expectation is that the residential real estate market, as depicted by the Fannie Mae Home Price Index, will continually climb.

The detail of the survey is interesting.  Of the survey respondents, none (of the displayed responses) forecasts a cumulative price decrease through 2029.

The Median Cumulative Home Price Appreciation for years 2024-2029 is seen as 5.50%, 9.72%, 14.10%, 18.39%, 22.79% and 27.75%, respectively.

For a variety of reasons, I continue to believe that these forecasts will prove far too optimistic.

I have written extensively about the residential real estate situation.  For a variety of reasons, it is exceedingly complex.  While many people continue to have an optimistic view regarding future residential real estate prices, in my opinion such a view is unsupported on an “all things considered” basis.  Residential real estate is an exceedingly large asset bubble. As such, from these price levels there exists potential for a price decline of outsized magnitude. 

_____

The Special Note summarizes my overall thoughts about our economic situation

SPX at 6079.35 as this post is written

Tuesday, November 26, 2024

House Prices Reference Chart

As a reference for long-term house price index trends, below is a chart, updated with the most current data (through September 2024) from the CalculatedRisk blog post of November 26, 2024 titled “Case-Shiller : National House Price Index…“:

Case-Shiller National and Composite Indices

_________

I post various indicators and indices because I believe they should be carefully monitored.  However, as those familiar with this site are aware, I do not necessarily agree with what they depict or imply.

_____

The Special Note summarizes my overall thoughts about our economic situation

SPX at 6009.41 as this post is written

Thursday, September 5, 2024

Fannie Mae Home Price Expectations Survey (HPES) Q3 2024

On September 5, 2024, the Fannie Mae Q3 2024 Home Price Expectations Survey (HPES) results were released.  This survey is done on a quarterly basis.

Various Q3 2024 Fannie Mae Home Price Expectations Survey information is available, including the chart seen below:

As one can see from the above chart, the average expectation is that the residential real estate market, as depicted by the Fannie Mae Home Price Index, will continually climb.

The detail of the survey is interesting.  Of the survey respondents, only four (of the displayed responses) forecasts a cumulative price decrease through 2028.

The Median Cumulative Home Price Appreciation for years 2024-2028 is seen as 5.00%, 8.81%, 12.49%, 16.98%, and 21.65%, respectively.

For a variety of reasons, I continue to believe that these forecasts will prove far too optimistic.

I have written extensively about the residential real estate situation.  For a variety of reasons, it is exceedingly complex.  While many people continue to have an optimistic view regarding future residential real estate prices, in my opinion such a view is unsupported on an “all things considered” basis.  Residential real estate is an exceedingly large asset bubble. As such, from these price levels there exists potential for a price decline of outsized magnitude. 

_____

The Special Note summarizes my overall thoughts about our economic situation

SPX at 5513.44 as this post is written

Thursday, June 6, 2024

Fannie Mae Home Price Expectations Survey (HPES) Q2 2024

On June 6, 2024, the Fannie Mae Q2 2024 Home Price Expectations Survey (HPES) results were released.  This survey is done on a quarterly basis.

Various Q2 2024 Fannie Mae Home Price Expectations Survey information is available, including the chart seen below:

U.S. Home Price Expectations

As one can see from the above chart, the average expectation is that the residential real estate market, as depicted by the Fannie Mae Home Price Index, will continually climb.

The detail of the survey is interesting.  Of the survey respondents, only two (of the displayed responses) forecasts a cumulative price decrease through 2028.

The Median Cumulative Home Price Appreciation for years 2024-2028 is seen as 3.75%, 6.85%, 10.30%, 14.17%, and 18.18%, respectively.

For a variety of reasons, I continue to believe that these forecasts will prove far too optimistic.

I have written extensively about the residential real estate situation.  For a variety of reasons, it is exceedingly complex.  While many people continue to have an optimistic view regarding future residential real estate prices, in my opinion such a view is unsupported on an “all things considered” basis.  Residential real estate is an exceedingly large asset bubble. As such, from these price levels there exists potential for a price decline of outsized magnitude. 

_____

The Special Note summarizes my overall thoughts about our economic situation

SPX at 5343.71 as this post is written

Tuesday, May 28, 2024

House Prices Reference Chart

As a reference for long-term house price index trends, below is a chart, updated with the most current data (through March 2024) from the CalculatedRisk blog post of May 28, 2024 titled “Case-Shiller : National House Price Index…“:

Case Shiller chart

_________

I post various indicators and indices because I believe they should be carefully monitored.  However, as those familiar with this site are aware, I do not necessarily agree with what they depict or imply.

_____

The Special Note summarizes my overall thoughts about our economic situation

SPX at 5302.13 as this post is written

Tuesday, March 26, 2024

House Prices Reference Chart

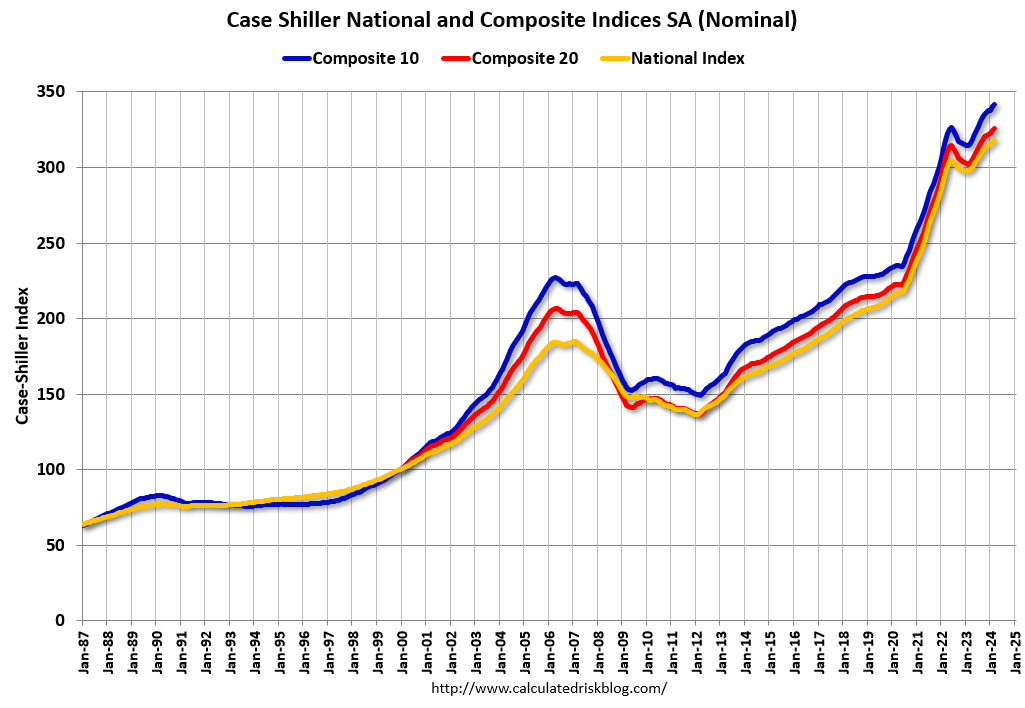
As a reference for long-term house price index trends, below is a chart, updated with the most current data (through January 2024) from the CalculatedRisk blog post of March 26, 2024 titled “Case-Shiller : National House Price Index…“:

Case Shiller National and Composite Indexes

_________

I post various indicators and indices because I believe they should be carefully monitored.  However, as those familiar with this site are aware, I do not necessarily agree with what they depict or imply.

_____

The Special Note summarizes my overall thoughts about our economic situation

SPX at 5231.80 as this post is written

Thursday, February 29, 2024

Fannie Mae Home Price Expectations Survey (HPES) Q1 2024

On February 29, 2024, the Fannie Mae Q1 2024 Home Price Expectations Survey (HPES) results were released.  This survey is done on a quarterly basis.

Various Q1 2024 Fannie Mae Home Price Expectations Survey information is available, including the chart seen below:

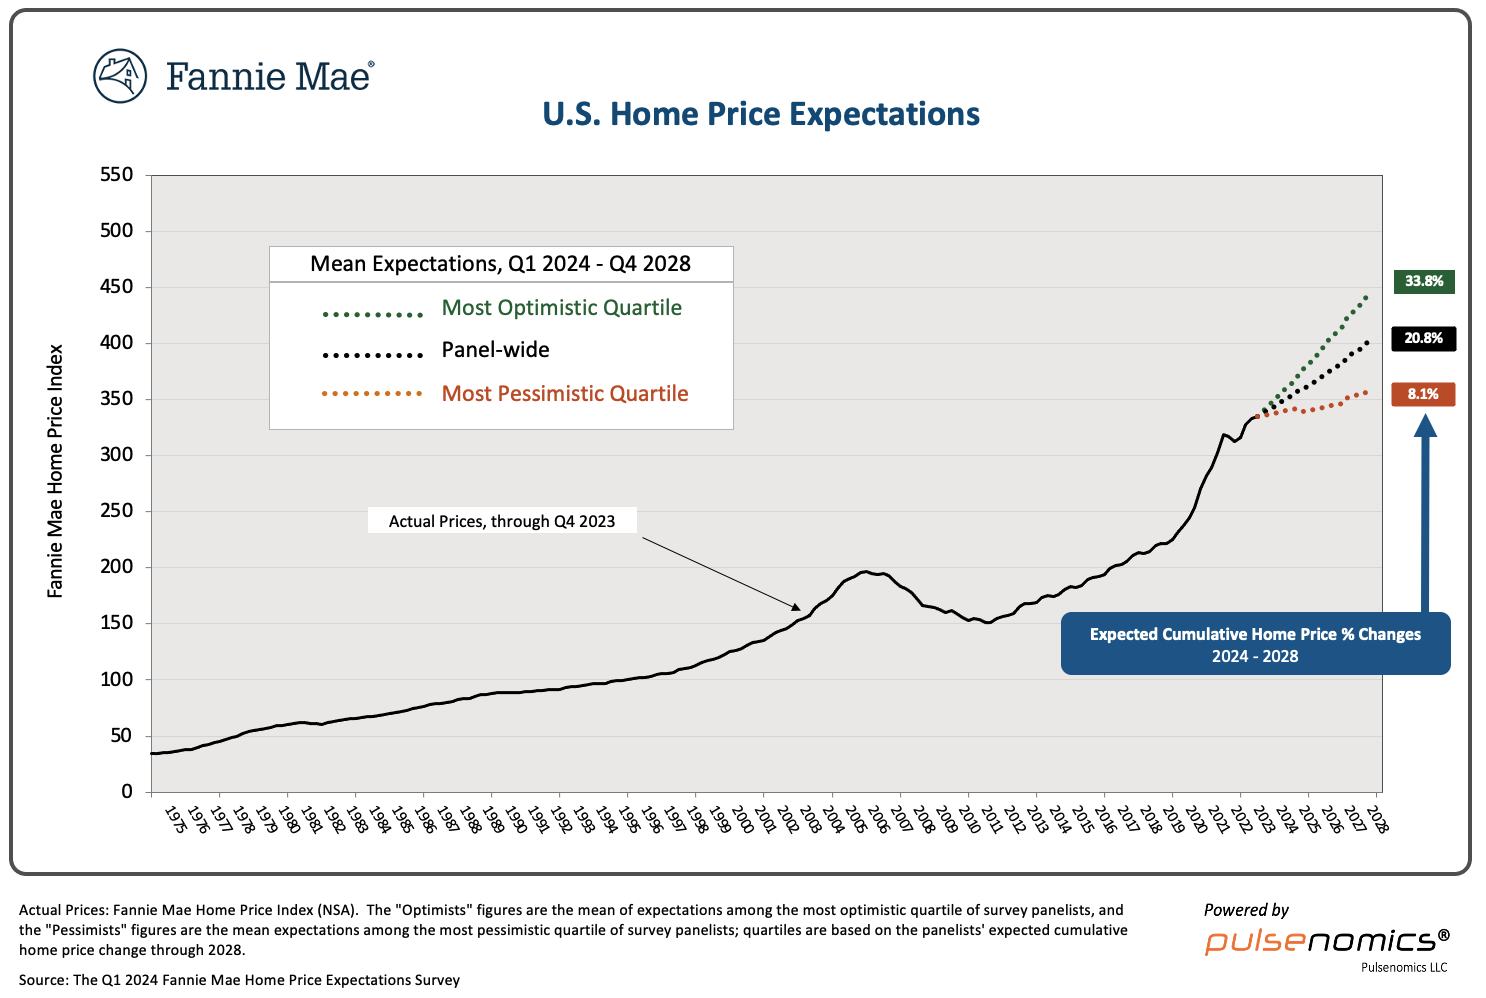
U.S. Home Price Expectations

As one can see from the above chart, the average expectation is that the residential real estate market, as depicted by the Fannie Mae Home Price Index, will continually climb.

The detail of the survey is interesting.  Of the survey respondents, only four (of the displayed responses) forecasts a cumulative price decrease through 2028.

The Median Cumulative Home Price Appreciation for years 2024-2028 is seen as 4.0%, 7.74%, 12.16%, 16.08%, and 20.84%, respectively.

For a variety of reasons, I continue to believe that these forecasts will prove far too optimistic.

I have written extensively about the residential real estate situation.  For a variety of reasons, it is exceedingly complex.  While many people continue to have an optimistic view regarding future residential real estate prices, in my opinion such a view is unsupported on an “all things considered” basis.  Residential real estate is an exceedingly large asset bubble. As such, from these price levels there exists potential for a price decline of outsized magnitude. 

_____

The Special Note summarizes my overall thoughts about our economic situation

SPX at 5081.24 as this post is written

Monday, December 11, 2023

Fannie Mae Home Price Expectations Survey (HPES) Q4 2023

On December 11, 2023, the Fannie Mae Q4 2023 Home Price Expectations Survey (HPES) results were released.  This survey is done on a quarterly basis.

Various Q4 2023 Fannie Mae Home Price Expectations Survey information is available, including the chart seen below:

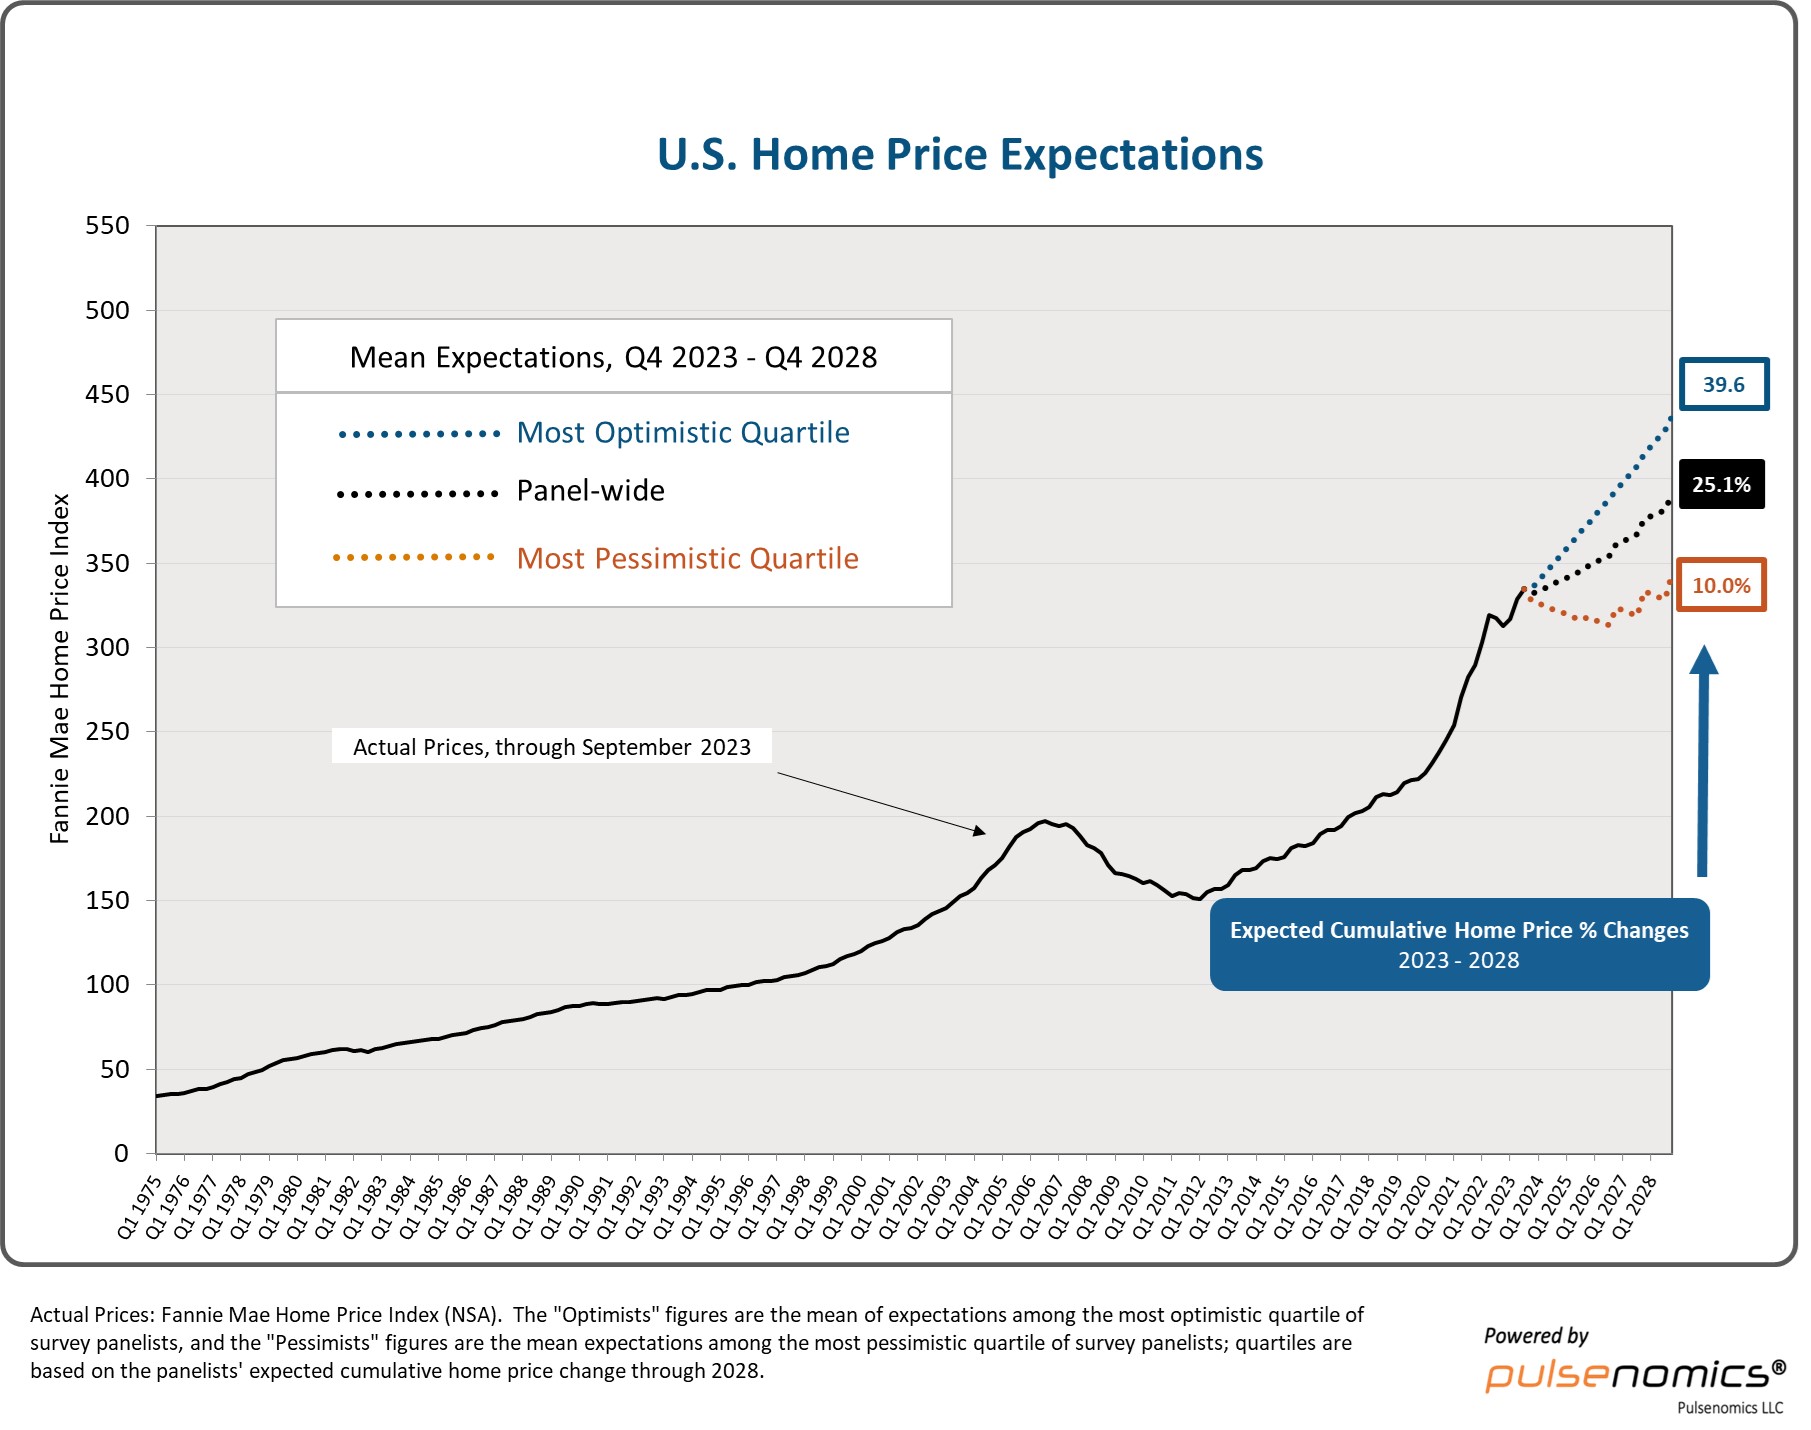
U.S. Home Price Expectations

As one can see from the above chart, the average expectation is that the residential real estate market, as depicted by the Fannie Mae Home Price Index, will continually climb.

The detail of the survey is interesting.  Of the survey respondents, only two (of the displayed responses) forecasts a cumulative price decrease through 2028.

The Median Cumulative Home Price Appreciation for years 2023-2028 is seen as 6.0%, 9.18%, 12.21%, 16.60%, 20.98%, and 25.37%, respectively.

For a variety of reasons, I continue to believe that these forecasts will prove far too optimistic.

I have written extensively about the residential real estate situation.  For a variety of reasons, it is exceedingly complex.  While many people continue to have an optimistic view regarding future residential real estate prices, in my opinion such a view is unsupported on an “all things considered” basis.  Residential real estate is an exceedingly large asset bubble. As such, from these price levels there exists potential for a price decline of outsized magnitude. 

_____

The Special Note summarizes my overall thoughts about our economic situation

SPX at 4617.55 as this post is written