Throughout this site there are many discussions of economic indicators. At this time, the readings of various indicators are especially notable.
While many U.S. economic indicators – including GDP – are indicating economic growth, others depict (or imply) various degrees of weak growth or economic contraction.
Below are a small sampling of charts that depict greater degrees of weakness and/or other worrisome trends, and a brief comment for each:
Overall Economic Activity
While the Gross Domestic Product Q3 2017 Advance Estimate (pdf) of October 27, 2017 was 3.0%, and as seen in the November 2017 Wall Street Journal Economic Forecast Survey the consensus among various economists is for 2.5% GDP growth in 2017 & 2018, there are other broad-based economic indicators that seem to imply a weaker growth rate. As well, it should be remembered that GDP figures can be (substantially) revised.
Among the broad-based economic indicators that have been implying weaker growth or mild contraction is the Chicago Fed National Activity Index (CFNAI).
The Chicago Fed National Activity Index (CFNAI) updated as of October 23, 2017:
The CFNAI, with the October 23, 2017 reading of .17:
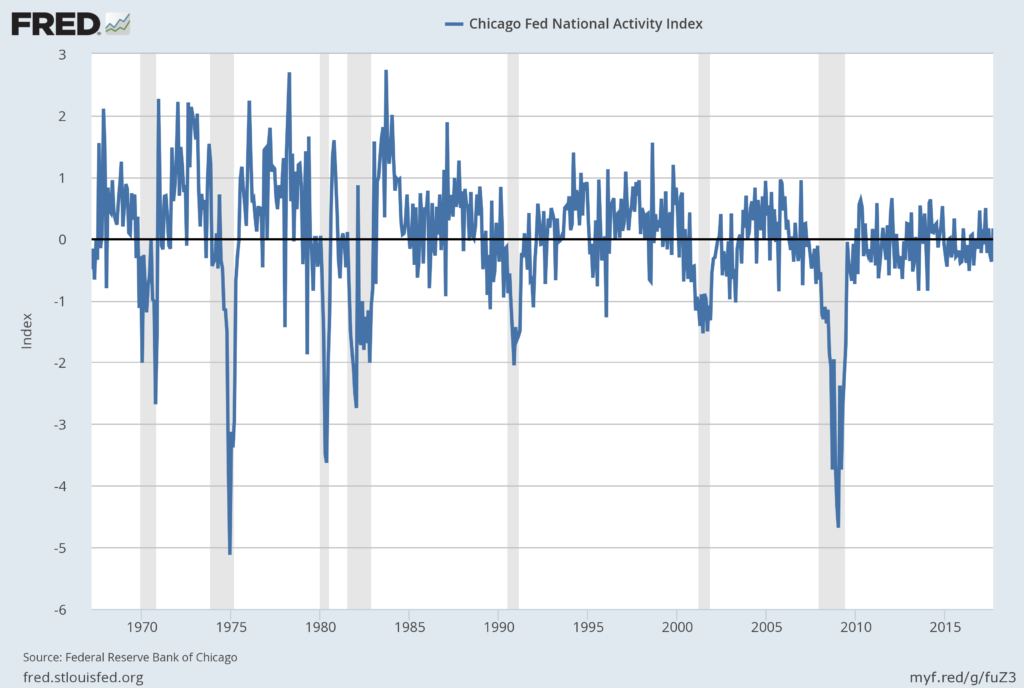
source: Federal Reserve Bank of Chicago, Chicago Fed National Activity Index [CFNAI], retrieved from FRED, Federal Reserve Bank of St. Louis, November 16, 2017;
An ancillary measure of the Chicago Fed National Activity Index (CFNAI) – the Chicago Fed National Activity Diffusion Index (CFNAIDIFF) – updated as of October 23, 2017:
The CFNAIDIFF, with current reading of -.19:
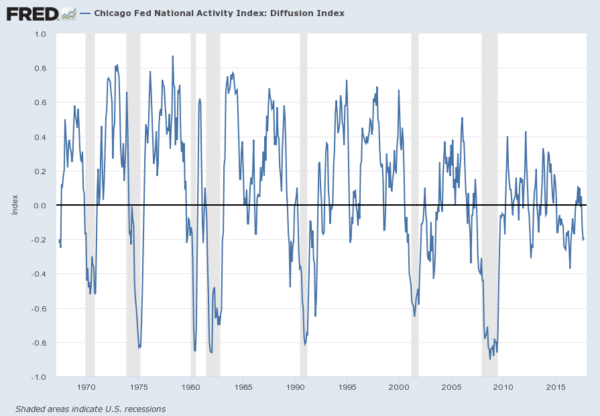
source: Federal Reserve Bank of Chicago, Chicago Fed National Activity Index: Diffusion Index [CFNAIDIFF], retrieved from FRED, Federal Reserve Bank of St. Louis, November 16, 2017;
–
Rail Freight Carloads
Another notable measure is that of “Rail Freight Carloads,” as depicted below, through September with last value of 1,086,482, last updated November 16, 2017:
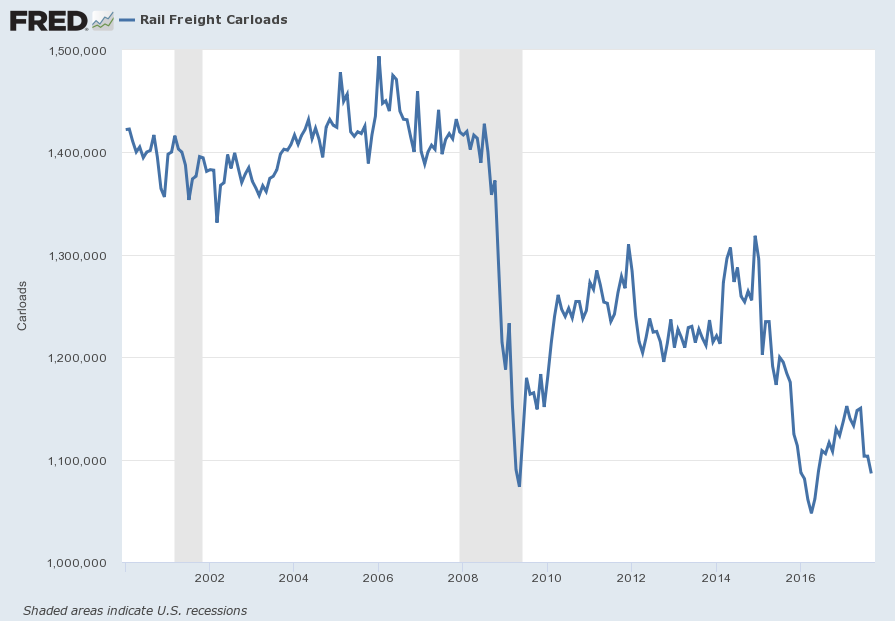
source: U.S. Bureau of Transportation Statistics, Rail Freight Carloads [RAILFRTCARLOADSD11], retrieved from FRED, Federal Reserve Bank of St. Louis; November 16, 2017:
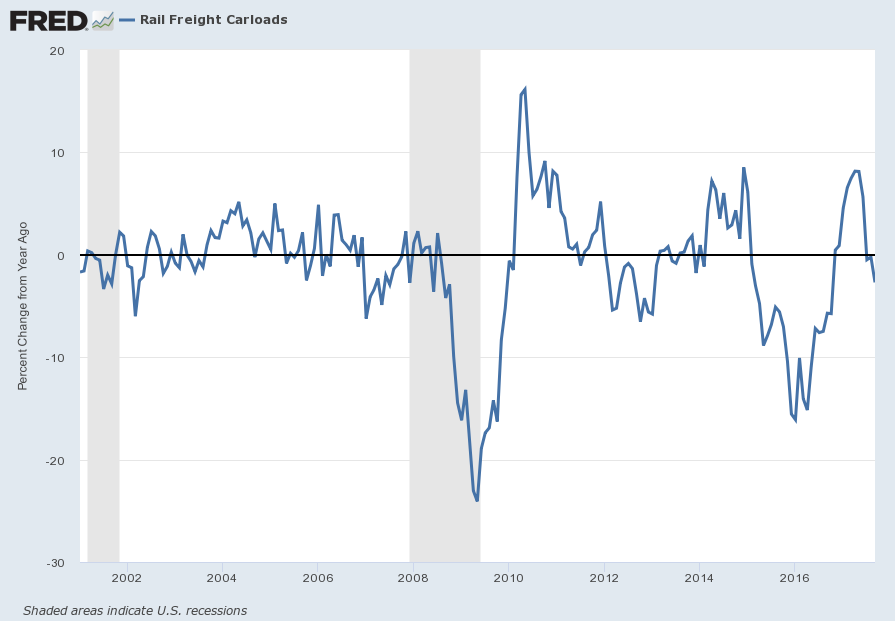
Here is the same measure on a “Percent Change From Year Ago” basis:
–
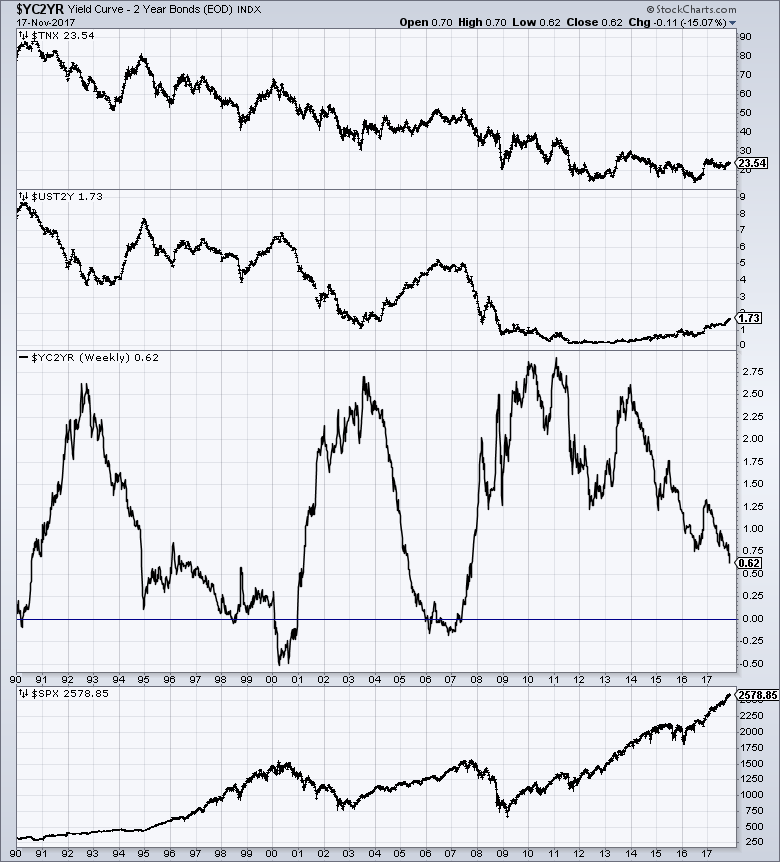
The Yield Curve
Many people believe that the Yield Curve is a leading economic indicator for the United States economy.
On March 1, 2010, I wrote a post on the issue, titled “The Yield Curve As A Leading Economic Indicator.”
While I continue to have the above-stated reservations regarding the “yield curve” as an indicator, I do believe that it should be monitored.
As an indication of the yield curve (i.e. a yield curve proxy), below is a weekly chart from January 1, 1990 through November 17, 2017. The top two plots show the 10-Year Treasury and 2-Year Treasury yields. The third plot shows the (yield) spread between the 10-Year Treasury and 2-Year Treasury, with the November 17, 2017 closing value of .62%. The bottom plot shows the S&P500:
(click on chart to enlarge image)(chart courtesy of StockCharts.com; chart creation and annotation by the author)
–
Domestic Auto Production
Another notable measure is that of “Domestic Auto Production,” defined in FRED as:
Domestic auto production is defined as all autos assembled in the U.S.
Here is “Domestic Auto Production,” depicted below on a “Percent Change From Year Ago” basis, through September with last value of -34.2 Percent, last updated October 30, 2017:
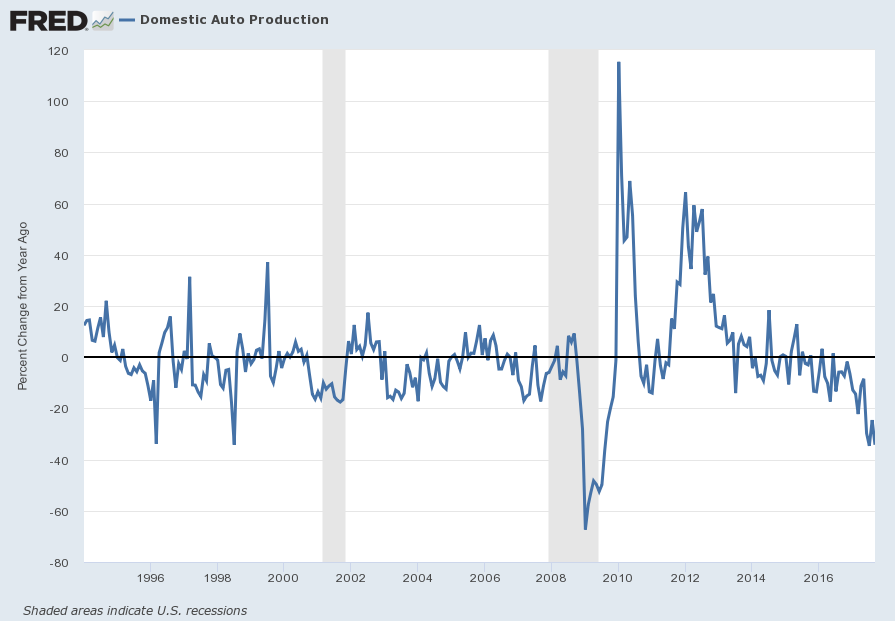
source: U.S. Bureau of Economic Analysis, Domestic Auto Production [DAUPSA], retrieved from FRED, Federal Reserve Bank of St. Louis; accessed November 15, 2017:
–
Inflation/Deflation Trends
Current inflation levels and the possibility of deflation is a vastly complex topic, and as such isn’t suitably discussed in a brief manner. I have discussed the issue of deflation extensively as I continue to believe that prolonged and deep U.S. deflationary conditions are on the horizon, and that such deflationary conditions will cause, as well as accompany, inordinate economic hardship. [note: to clarify, for purposes of this discussion, when I mention “deflation” I am referring to the CPI going below zero. Also, I have been using the term “deflationary pressures” as a term to describe deflationary manifestations within an environment that is still overall inflationary but heading towards deflation.]
My latest commentary regarding deflationary pressures and future deflation can be found in the October 2 post titled “Charts Indicating Economic Weakness – October 2017.”
–
Other Indicators
As mentioned previously, many other indicators discussed on this site indicate economic weakness or economic contraction, if not outright (gravely) problematical economic conditions.
_____
The Special Note summarizes my overall thoughts about our economic situation
SPX at 2578.85 as this post is written
No comments:
Post a Comment