U.S. Economic Indicators
Throughout this site there are many discussions of economic indicators. At this time, the readings of various indicators are especially notable. This post is the latest in a series of posts indicating U.S. economic weakness or a notably low growth rate.
While many U.S. economic indicators – including GDP – are indicating economic growth, others depict (or imply) various degrees of weak growth or economic contraction. As seen in the January 2019 Wall Street Journal Economic Forecast Survey the consensus (average estimate) among various economists is for 3.1% GDP growth in 2018 and 2.2% GDP growth in 2019. However, there are other broad-based economic indicators that seem to imply a weaker growth rate.
As well, it should be remembered that GDP figures can be (substantially) revised.
Charts Indicating U.S. Economic Weakness
Below are a small sampling of charts that depict weak growth or contraction, and a brief comment for each:
Regional Manufacturing Surveys
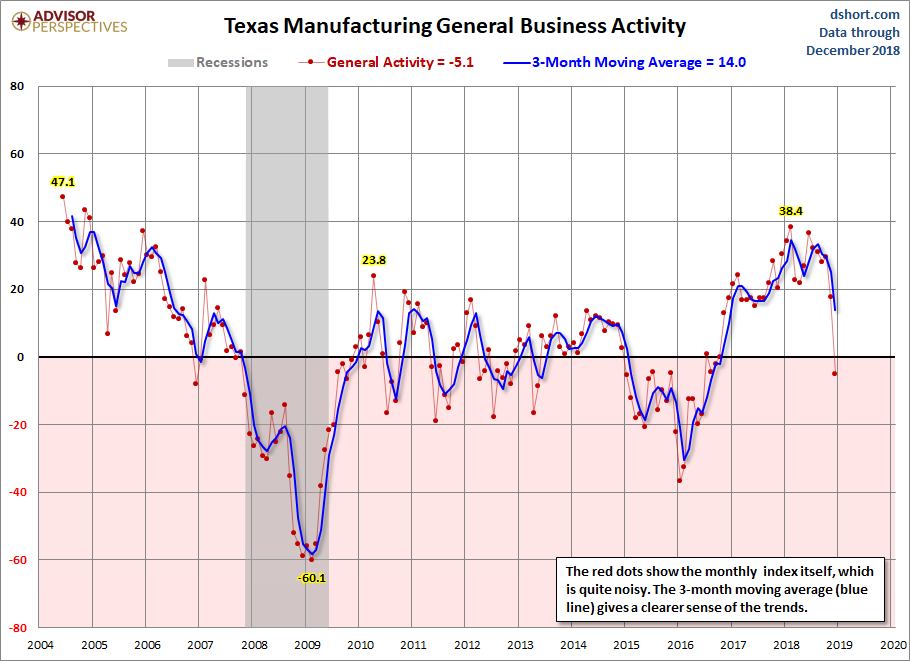
Various Federal Reserve regional manufacturing surveys are indicating either a significant weakening in growth or a decline in various aspects of activity.
Below is a chart of the Dallas Fed General Business Activity chart, from Doug Short’s site post of December 31, 2018 titled “December Dallas Fed Manufacturing Outlook at 2.5 Year Low“:
__
Philadelphia Federal Reserve’s Nonmanufacturing Business Outlook Survey
Another indicator that is flagging is the Current General Activity diffusion index from the Philadelphia Federal Reserve’s Nonmanufacturing Business Outlook Survey. Below is a chart through December, with a value of 4.3:
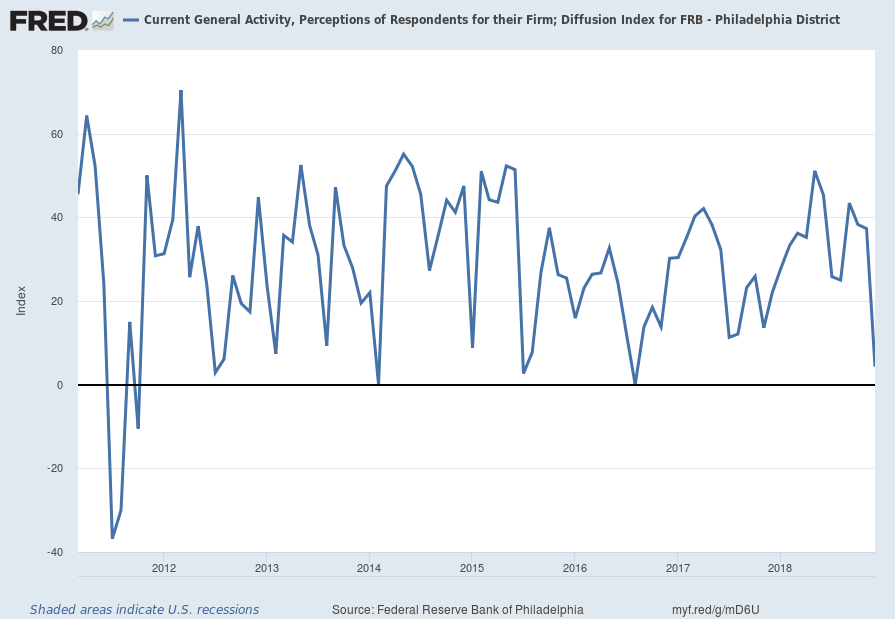
source: Federal Reserve Bank of Philadelphia, Current General Activity, Perceptions of Respondents for their Firm; Diffusion Index for FRB – Philadelphia District [GABNDIF066MNFRBPHI], retrieved from FRED, Federal Reserve Bank of St. Louis: accessed January 11, 2019: https://fred.stlouisfed.org/series/GABNDIF066MNFRBPHI
__
Unemployment
I have written extensively concerning unemployment, as the current and future unemployment issue is of tremendous importance, but is widely misunderstood.
The consensus belief is that employment is robust, with the often-cited total nonfarm payroll growth and the current unemployment rate of 3.9%. However, my analyses continue to indicate that the conclusion that employment is strong is (in many ways) incorrect. While the unemployment rate indicates that unemployment is (very) low, closer examination indicates that this metric is, for a number of reasons, highly misleading.
My analyses indicate that the underlying dynamics of the unemployment situation remain exceedingly worrisome, especially with regard to the future. These dynamics are numerous and complex, and greatly lack recognition and understanding, especially as how from an “all-things-considered” standpoint they will evolve in an economic and societal manner. I have written of the current and future U.S. employment situation on the “U.S. Employment Trends” page.
While there are many charts that can be shown, one that depicts a worrisome trend is the Civilian Labor Force Participation Rate for those with a Bachelor’s Degree and Higher, 25 years and over. Among disconcerting aspects of this measure is the long-term (most notably the post-2009) trend, especially given this demographic segment’s characteristics.
The current value as of the January 4, 2019 update (reflecting data through the December employment report) is 73.6%:
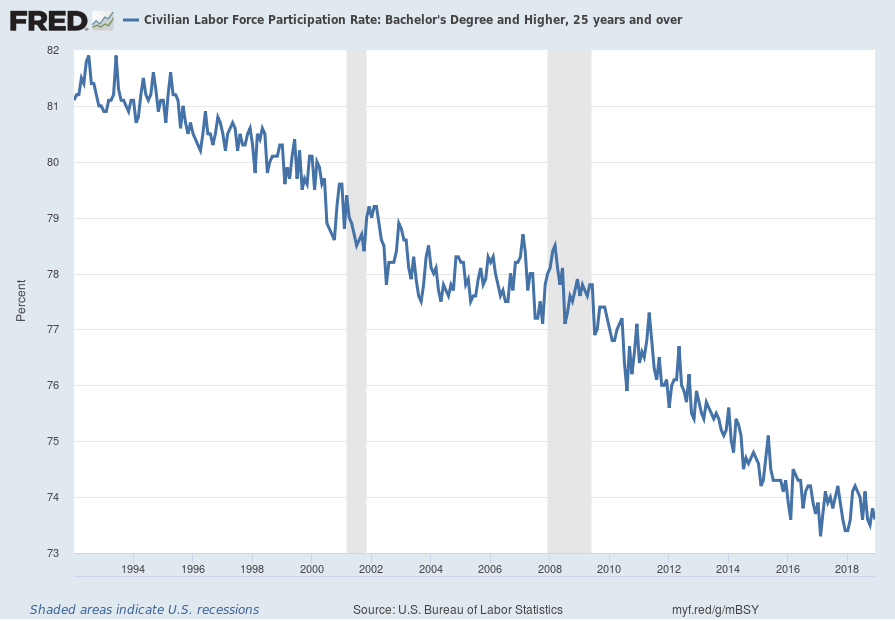
source: U.S. Bureau of Labor Statistics, Civilian Labor Force Participation Rate: Bachelor’s Degree and Higher, 25 years and over [LNS11327662], retrieved from FRED, Federal Reserve Bank of St. Louis; accessed January 10, 2019: https://fred.stlouisfed.org/series/LNS11327662
__
The ECRI WLI, Gr.
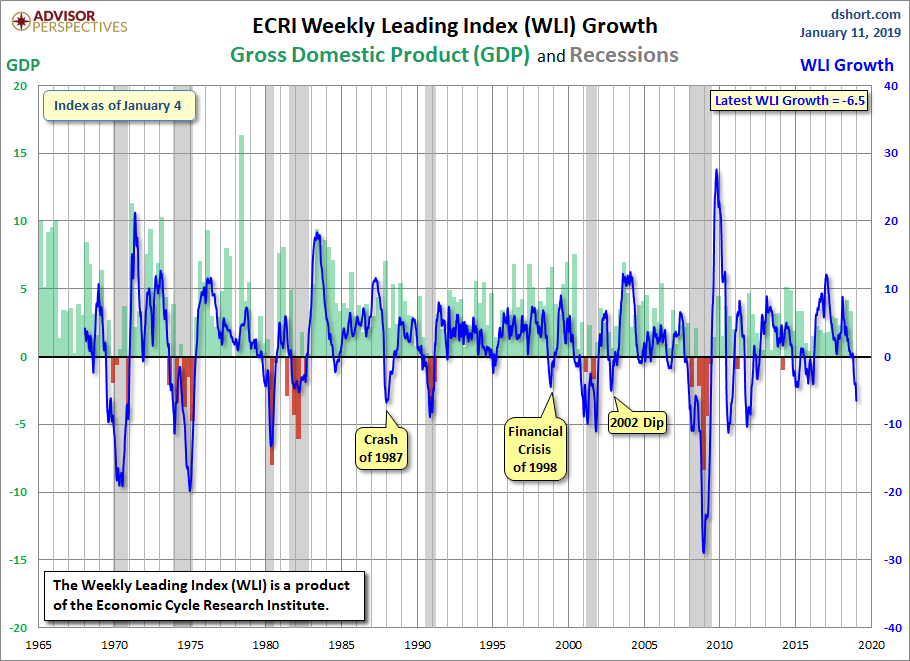
The ECRI WLI,Gr. measure has been steadily declining and now is at -6.5% as of the January 11, 2019 update, reflecting data through January 4, 2019.
A chart of the WLI,Gr., with an overlay of U.S. GDP, from the Doug Short’s site ECRI update post of January 11, 2019:
__
Other Indicators
As mentioned previously, many other indicators discussed on this site indicate weak economic growth or economic contraction, if not outright (gravely) problematical economic conditions.
_____
The Special Note summarizes my overall thoughts about our economic situation
SPX at 2596.26 as this post is written
No comments:
Post a Comment