U.S. Economic Indicators
Throughout this site there are many discussions of economic indicators. This post is the latest in a series of posts indicating facets of U.S. economic weakness or a notably low growth rate.
The level and trend of economic growth is especially notable at this time. As seen in various measures and near-term projections, the U.S. economy had undergone an outsized level of economic contraction in 2020. However, most people believe (and virtually all prominent economic forecasts indicate) that this historic level of contraction will prove ephemeral in nature; i.e. a sustainable economic rebound will have started in the third quarter of 2020, followed by continual economic expansion.
As seen in the April 2021 Wall Street Journal Economic Forecast Survey the consensus (average estimate) among various economists is for 6.41% GDP growth in 2021, 3.21% GDP growth in 2022, and 2.39% GDP growth in 2023.
Charts Indicating U.S. Economic Weakness
Below are a small sampling of charts that depict weak growth or contraction, and a brief comment for each:
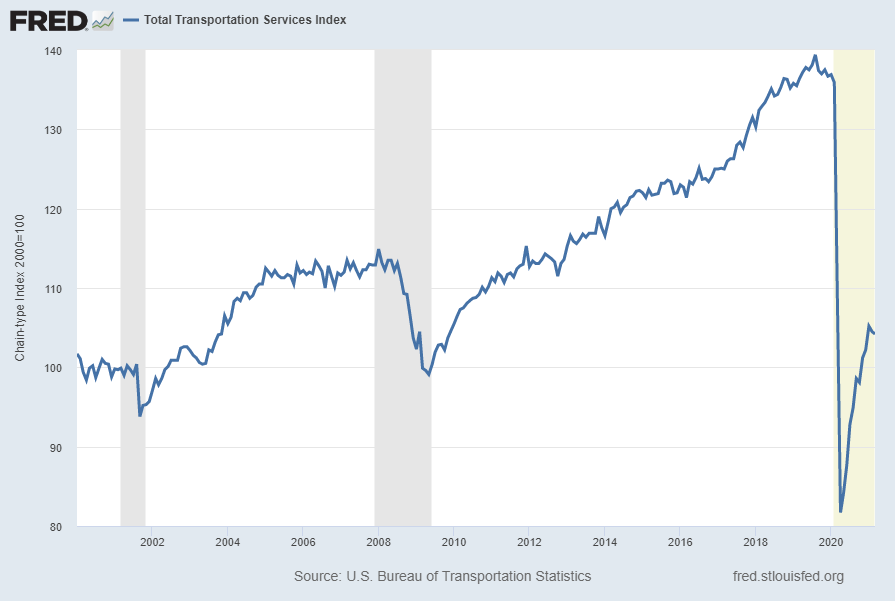
Total Transportation Services Index (TSITTL)
“Total Transportation Services Index” (TSITTL), like other transportation measures, is exhibiting recent substantial weakness. Shown below is this measure with last value of 104.2 through March, last updated June 9, 2021:
Below is this measure displayed on a “Percent Change From Year Ago” basis with value -4.6%:
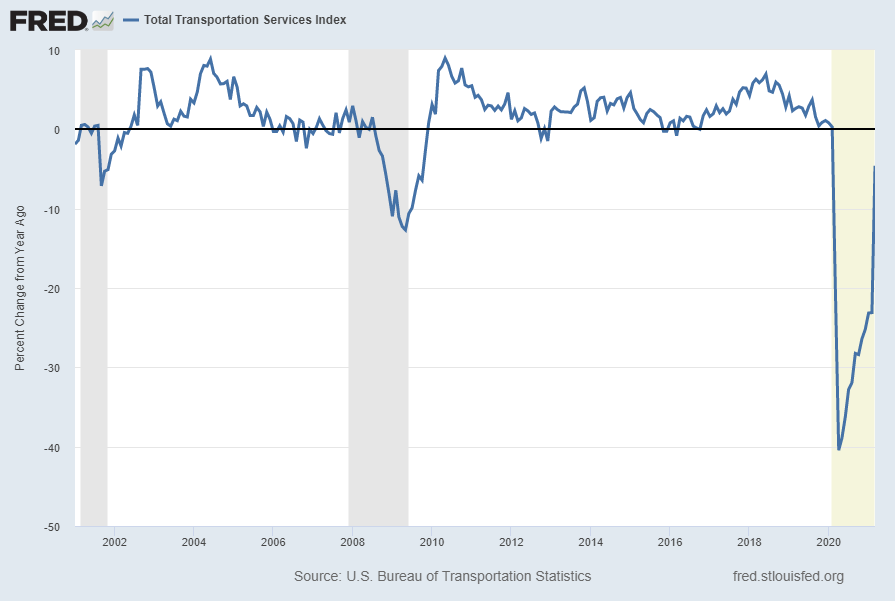
source: U.S. Bureau of Transportation Statistics, Total Transportation Services Index [TSITTL], retrieved from FRED, Federal Reserve Bank of St. Louis; accessed June 14, 2021; https://fred.stlouisfed.org/series/TSITTL
__
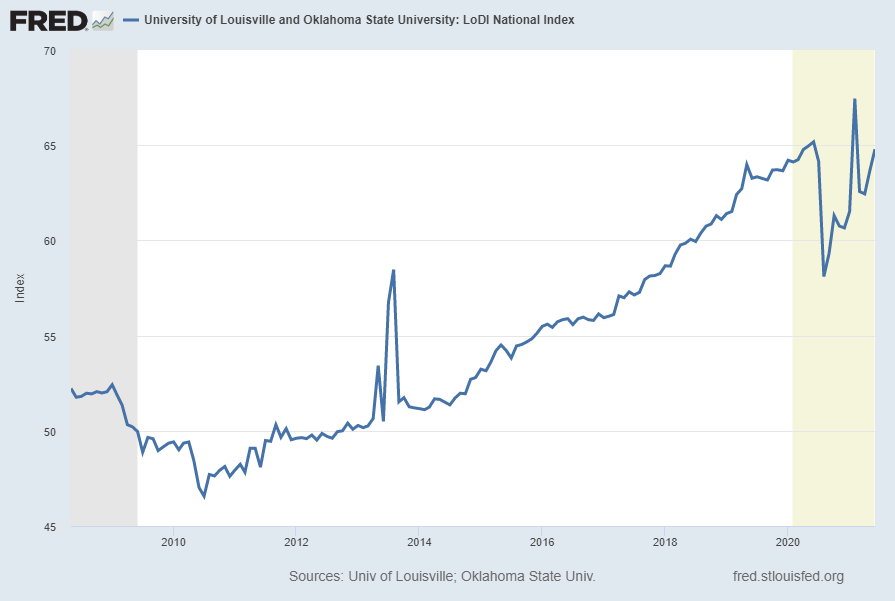
University of Louisville and Oklahoma State University: LoDI National Index (LODINIM066N)
The LoDI National Index is described in FRED as:
The LoDI Index uses linear regression analysis to combine cargo volume data from rail, barge, air, and truck transit, along with various economic factors. The resulting indicator is designed to predict upcoming changes in the level of logistics and distribution activity in the US and is represented by a value between 1 and 100. An index at or above 50 represents a healthy level of activity in the industry.
As seen in the long-term chart below, the index appears to be exhibiting volatility in its rebound from the recent 2020 decline.
Shown below is a chart with data through June 2021 (last value of 64.79044), last updated June 1, 2021:
Below is this measure displayed on a “Percent Change From Year Ago” basis with value -.6%:
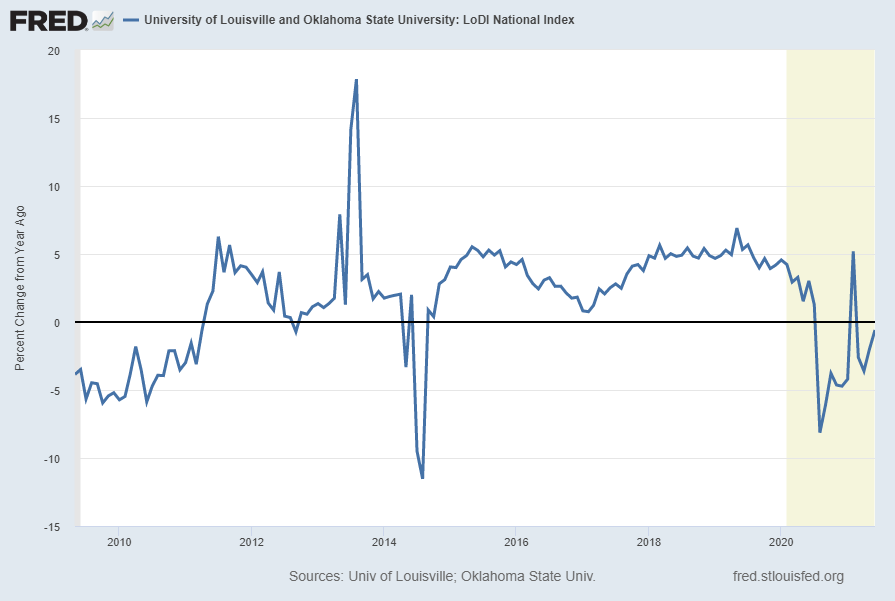
source: University of Louisville. Logistics and Distribution Institute and Oklahoma State University, University of Louisville and Oklahoma State University: LoDI National Index [LODINIM066N], retrieved from FRED, Federal Reserve Bank of St. Louis; accessed June 14, 2021: https://fred.stlouisfed.org/series/LODINIM066N
__
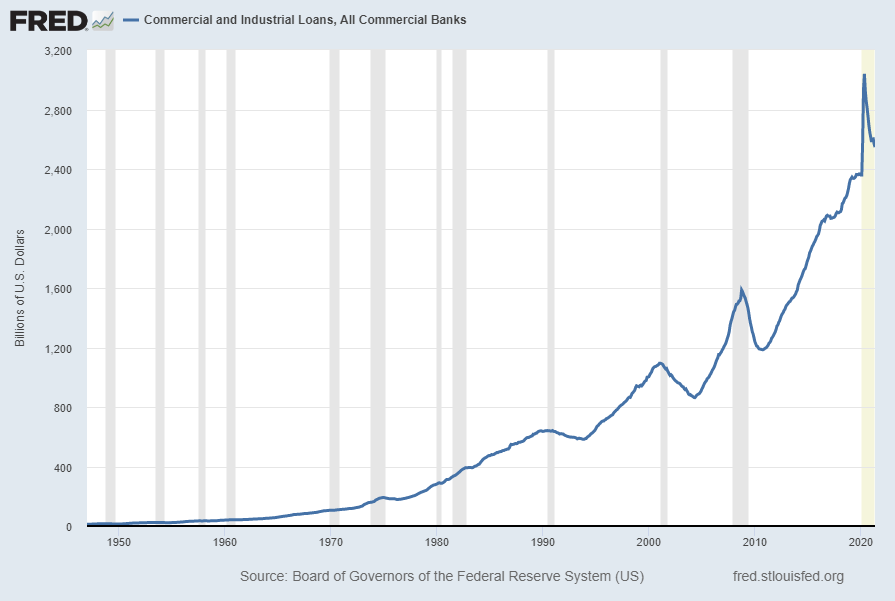
Commercial And Industrial Loans, All Commercial Banks (BUSLOANS)
“Commercial And Industrial Loans, All Commercial Banks” (BUSLOANS) has recently been declining. Shown below is this measure with last value of $2,546.9826 Billion through May, last updated June 11, 2021:
Below is this measure displayed on a “Percent Change From Year Ago” basis with value -16.2%:
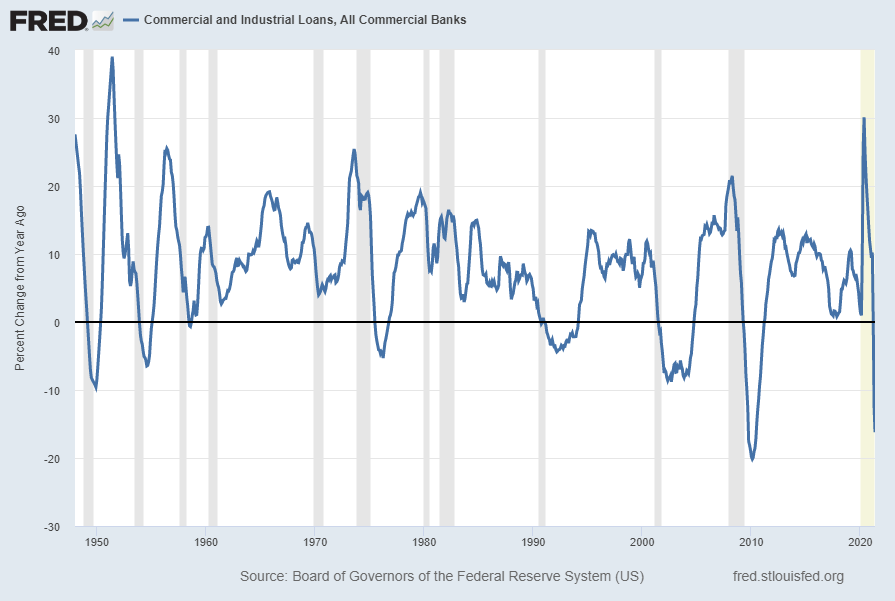
source: Board of Governors of the Federal Reserve System (US), Commercial and Industrial Loans, All Commercial Banks [BUSLOANS], retrieved from FRED, Federal Reserve Bank of St. Louis; accessed June 15, 2021: https://fred.stlouisfed.org/series/BUSLOANS
__
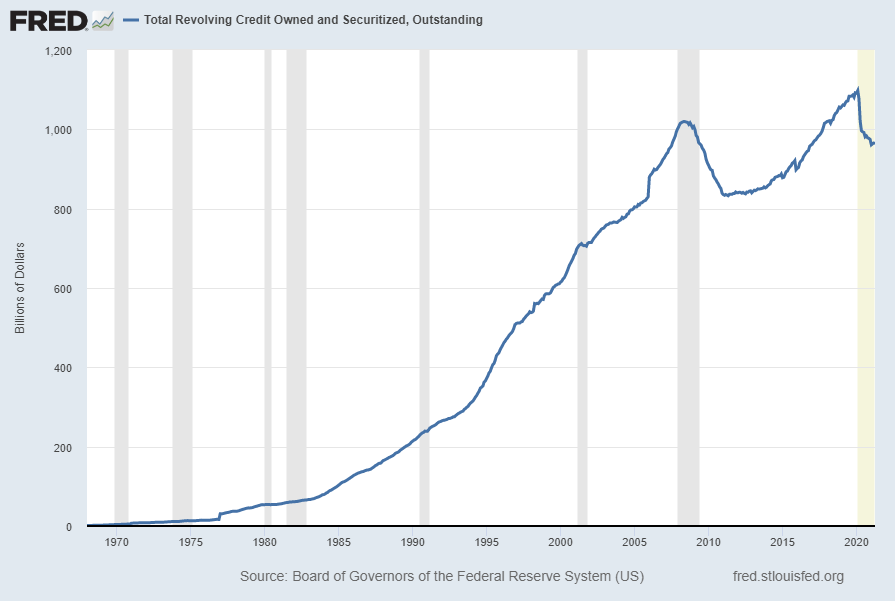
Total Revolving Credit Owned And Securitized, Outstanding (REVOLSL)
“Total Revolving Credit Owned And Securitized, Outstanding” (REVOLSL) has recently been declining. Shown below is this measure with last value of $963.56009 Billion through April, last updated June 7, 2021:
Below is this measure displayed on a “Percent Change From Year Ago” basis with value -5.5%:
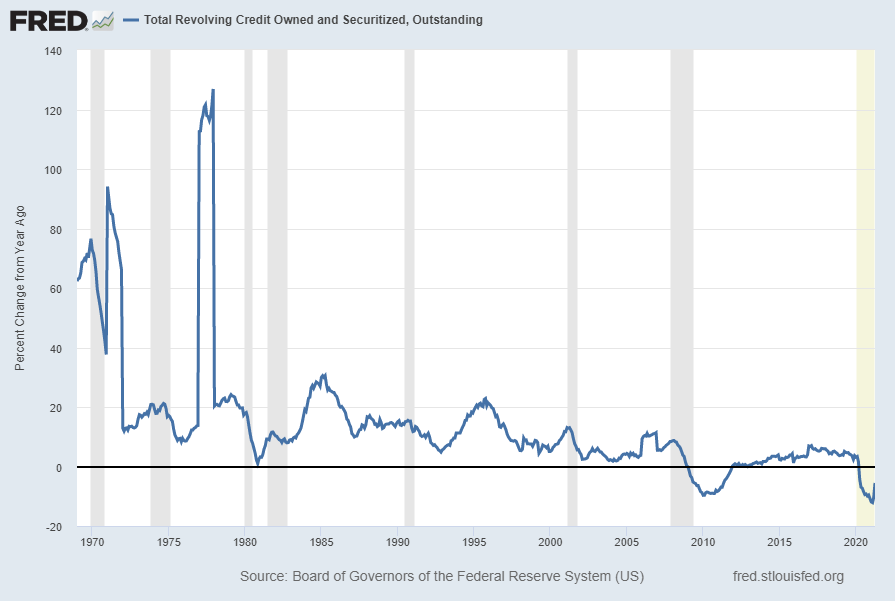
source: Board of Governors of the Federal Reserve System (US), Total Revolving Credit Owned and Securitized, Outstanding [REVOLSL], retrieved from FRED, Federal Reserve Bank of St. Louis; accessed June 16, 2021: https://fred.stlouisfed.org/series/REVOLSL
__
Unemployment
I have written extensively concerning unemployment, as the current and future unemployment issue is of tremendous importance.
Of note, the current unemployment situation, as depicted by various statistics, is in many ways incomparable to past periods given various dynamics of the current (since early 2020) situation and how these dynamics are being reflected and otherwise portrayed.
However, even given these issues, various metrics indicate that current unemployment is very high from a long-term historical perspective.
My analyses indicate that the underlying dynamics of the unemployment situation remain exceedingly worrisome, especially with regard to the future. These dynamics are numerous and complex, and greatly lack recognition and understanding, especially as how from an “all-things-considered” standpoint they will evolve in an economic and societal manner. Further discussion of the long-term U.S. employment situation can be seen on the “U.S. Employment Trends” page.
While there are many charts that can be shown, one that depicts a worrisome trend is the Employment-Population Ratio for those ages 25 – 54 years. [The Employment-Population Ratio is the Civilian Employed divided by the Civilian Noninstitutional Population]. Among disconcerting aspects of this measure is the recent plunge as well as the long-term (most notably the post-2000) trend, especially given this demographic segment.
The current value as of the June 7, 2021 update (reflecting data through the May employment report) is 77.1%:
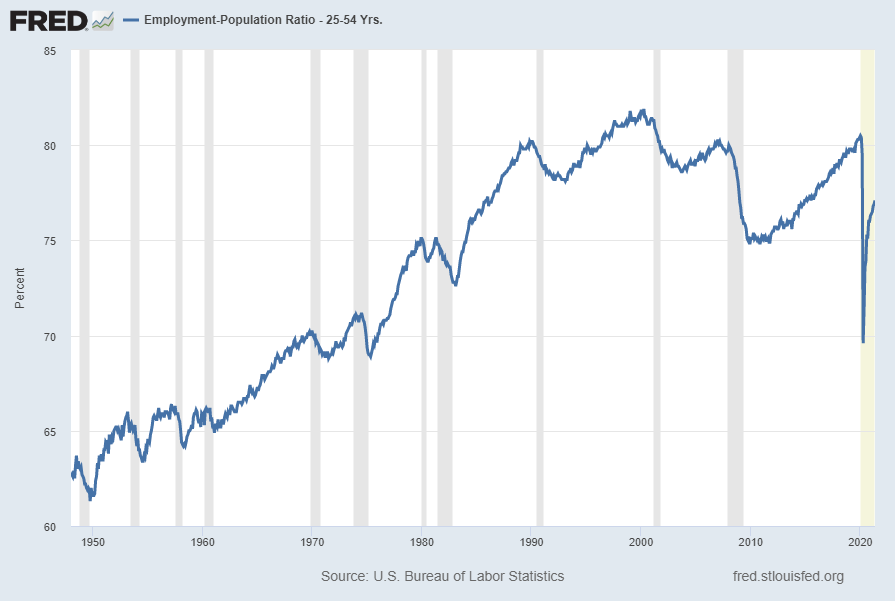
Data Source: U.S. Bureau of Labor Statistics, Employment Population Ratio: 25 – 54 years [LNS12300060], retrieved from FRED, Federal Reserve Bank of St. Louis, accessed June 15, 2021: https://fred.stlouisfed.org/series/LNS12300060
__
Other Indicators
As mentioned previously, many other indicators discussed on this site indicate slow economic growth or economic contraction, if not outright (gravely) problematical economic conditions.
_____
The Special Note summarizes my overall thoughts about our economic situation
SPX at 4246.59 as this post is written
No comments:
Post a Comment