U.S. Economic Indicators
Throughout this site there are many discussions of economic indicators. This post is the latest in a series of posts indicating facets of U.S. economic weakness or a notably low growth rate.
The level and trend of economic growth is especially notable at this time. As seen in various measures and near-term projections, the U.S. economy had undergone an outsized level of economic contraction in 2020. However, most people believe (and virtually all prominent economic forecasts indicate) that this historic level of contraction will prove ephemeral in nature; i.e. a sustainable economic rebound continues, followed by continual economic expansion.
As seen in the July 2021 Wall Street Journal Economic Forecast Survey the consensus (average estimate) among various economists is for 6.89% GDP growth in 2021, 3.24% GDP growth in 2022, and 2.30% GDP growth in 2023.
Charts Indicating U.S. Economic Weakness
Below are a small sampling of charts that depict weak growth or contraction, and a brief comment for each:
The Yield Curve
Many people believe that the Yield Curve is a leading economic indicator for the United States economy.
On March 1, 2010, I wrote a post on the issue, titled “The Yield Curve As A Leading Economic Indicator.”
While I continue to have the stated reservations regarding the “Yield Curve” as an indicator, I do believe that it should be monitored.
The U.S. Yield Curve (one proxy seen below) while positive, is (all things considered) relatively low when viewed from a long-term perspective. Below is the spread between the 10-Year Treasury Constant Maturity and the 3-Month Treasury Constant Maturity from 1982 through the August 13, 2021 value, showing a value of 1.23% (10-Year Treasury Yield (FRED DGS10) of 1.36% as of August 12, 3-Month Treasury Yield (FRED DGS3MO) of .06% as of August 12):
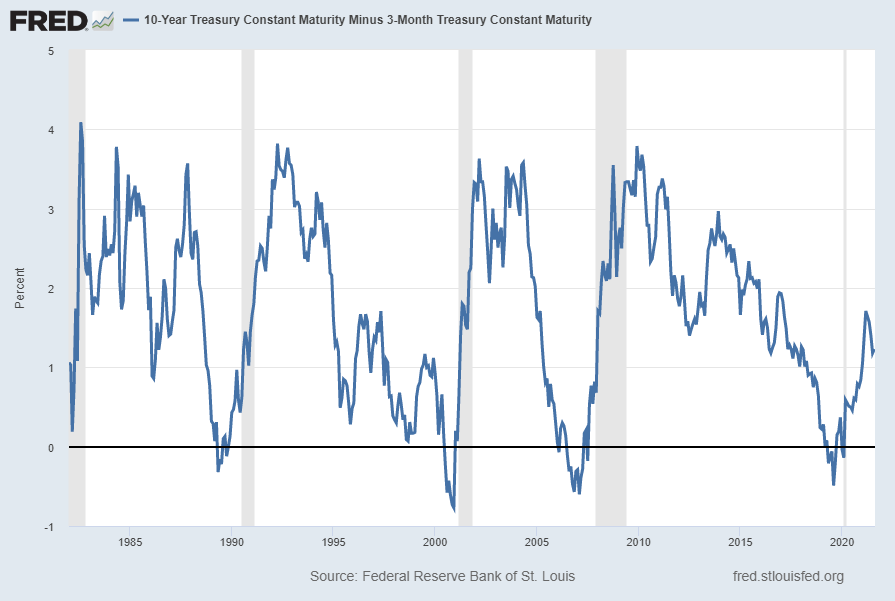
source: Federal Reserve Bank of St. Louis, 10-Year Treasury Constant Maturity Minus 3-Month Treasury Constant Maturity [T10Y3M], retrieved from FRED, Federal Reserve Bank of St. Louis; accessed August 14, 2021: https://fred.stlouisfed.org/series/T10Y3M
__
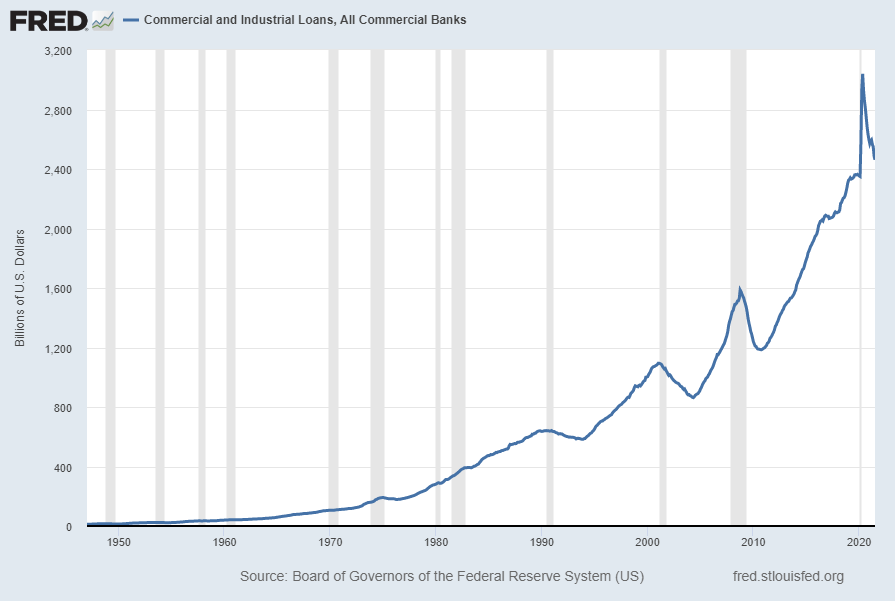
Commercial And Industrial Loans, All Commercial Banks (BUSLOANS)
“Commercial And Industrial Loans, All Commercial Banks” (BUSLOANS) has recently been declining. Shown below is this measure with last value of $2,461.9390 Billion through July, last updated August 13, 2021:
Below is this measure displayed on a “Percent Change From Year Ago” basis with value -13.9%:
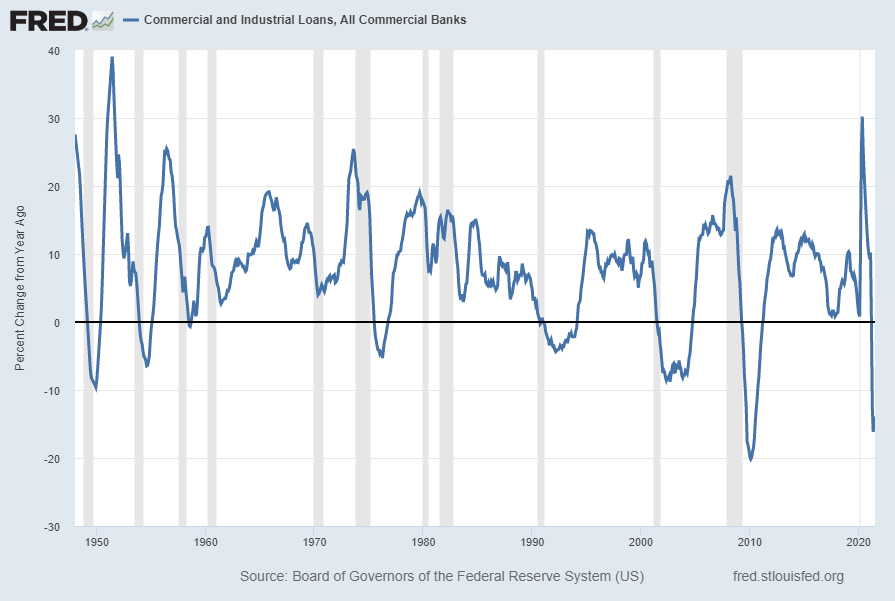
source: Board of Governors of the Federal Reserve System (US), Commercial and Industrial Loans, All Commercial Banks [BUSLOANS], retrieved from FRED, Federal Reserve Bank of St. Louis; accessed August 14, 2021: https://fred.stlouisfed.org/series/BUSLOANS
__
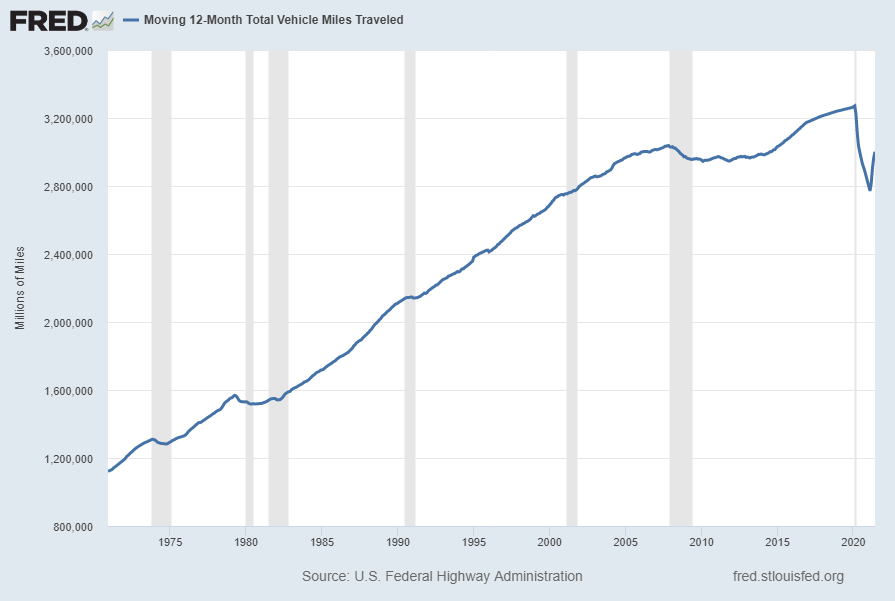
Moving 12-Month Total Vehicle Miles Traveled (M12MTVUSM227NFWA)
Another indication of transportation and mobility is the Moving 12-Month Total Vehicle Miles Traveled indicator.
Shown below is this measure (not seasonally adjusted) with last value of 3,001,581 (Millions of Miles) through June, last updated August 11, 2021:
Below is this measure displayed on a “Percent Change From Year Ago” basis with value .1%:

source: U.S. Federal Highway Administration, Moving 12-Month Total Vehicle Miles Traveled [M12MTVUSM227NFWA], retrieved from FRED, Federal Reserve Bank of St. Louis; accessed August 11, 2021: https://fred.stlouisfed.org/series/M12MTVUSM227NFWA
__
Employment-Population Ratio (EMRATIO)
I have written extensively concerning unemployment, as the trends even before early 2020 exhibited (highly) worrisome dynamics.
My analyses indicate that the underlying dynamics of the unemployment situation remain exceedingly worrisome, especially with regard to the future. These dynamics are numerous and complex, and greatly lack recognition and understanding, especially as how from an “all-things-considered” standpoint they will evolve in an economic and societal manner. Further discussion of the long-term U.S. employment situation can be seen on the “U.S. Employment Trends” page.
Of note, the current (since early 2020) unemployment situation is in many ways incomparable to past periods.
Various metrics indicate that current unemployment is very high from a long-term historical perspective.
Shown below is the “Employment-Population Ratio” (EMRATIO) statistic, with last value of 58.4 percent through July 2021, as of the August 6 update:
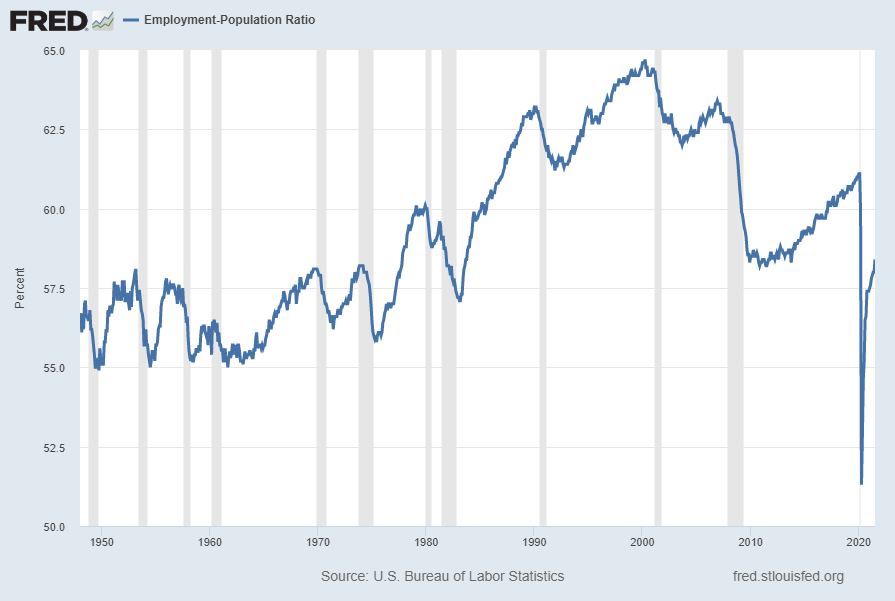
source: U.S. Bureau of Labor Statistics, Employment-Population Ratio [EMRATIO], retrieved from FRED, Federal Reserve Bank of St. Louis; accessed August 13, 2021: https://fred.stlouisfed.org/series/EMRATIO
__
Other Indicators
As mentioned previously, many other indicators discussed on this site indicate economic weakness or economic contraction, if not outright (gravely) problematical economic conditions.
_____
The Special Note summarizes my overall thoughts about our economic situation
SPX at 4468.00 as this post is written
No comments:
Post a Comment