All charts reflect quarterly data through the 1st quarter of 2025, and were last updated as of April 30, 2025.
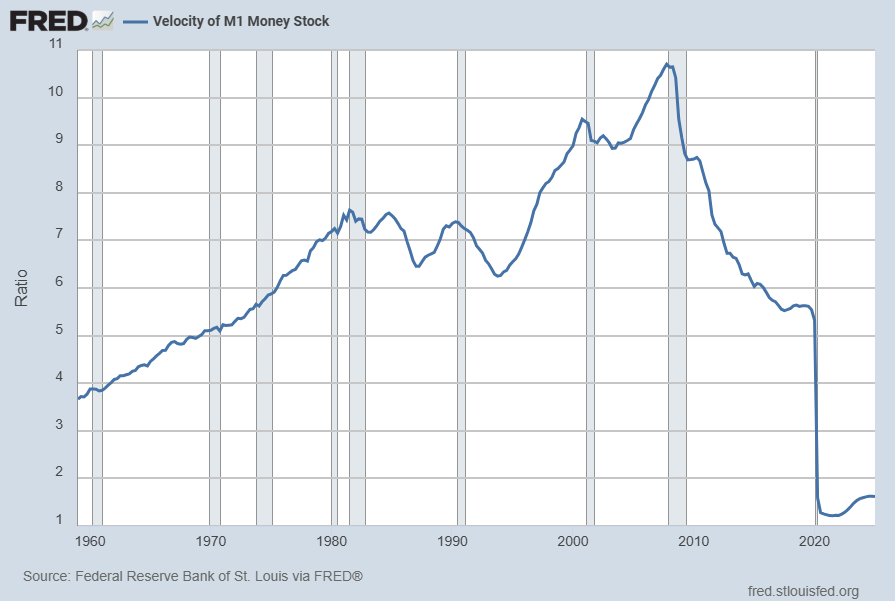
Velocity of M1 Money Stock, current value = 1.619:
Data Source: FRED, Federal Reserve Economic Data, Federal Reserve Bank of St. Louis; accessed April 30, 2025: http://research.stlouisfed.org/fred2/series/M1V
–
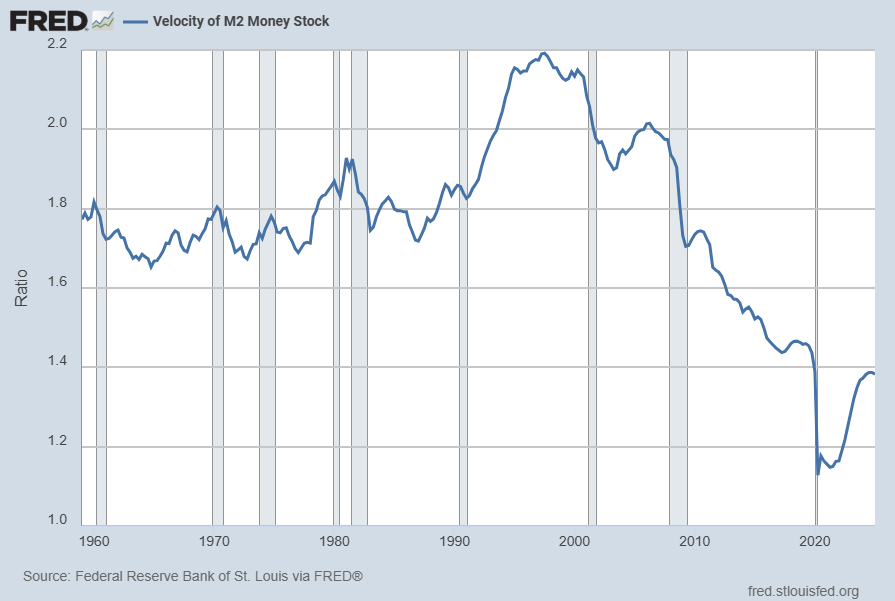
Velocity of M2 Money Stock, current value = 1.383:
Data Source: FRED, Federal Reserve Economic Data, Federal Reserve Bank of St. Louis; accessed April 30, 2025: http://research.stlouisfed.org/fred2/series/M2V
_________
I post various indicators and indices because I believe they should be carefully monitored. However, as those familiar with this site are aware, I do not necessarily agree with what they depict or imply.
_____
The Special Note summarizes my overall thoughts about our economic situation
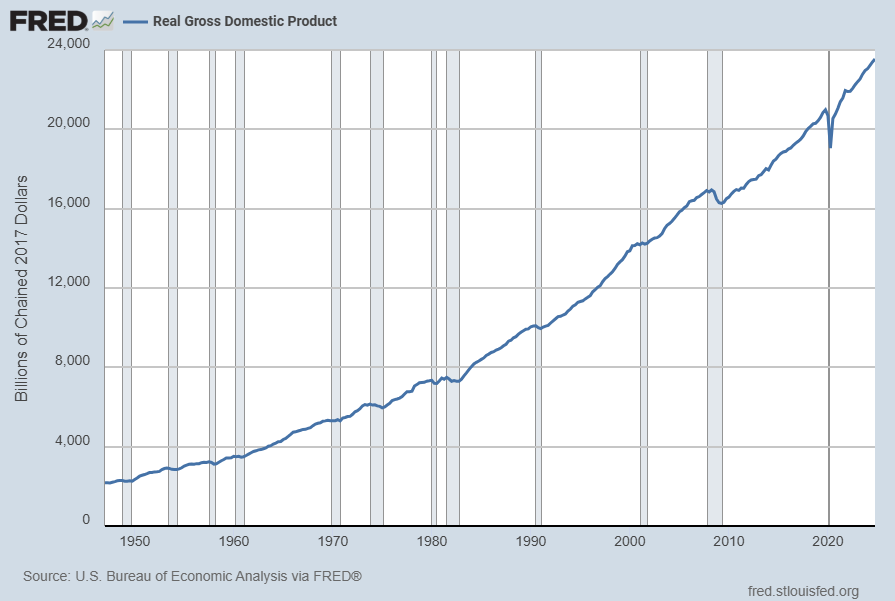
source: U.S. Bureau of Economic Analysis, Real Gross Domestic Product [GDPC1], retrieved from FRED, Federal Reserve Bank of St. Louis; accessed April 30, 2025: https://fred.stlouisfed.org/series/GDPC1
_________
I post various indicators and indices because I believe they should be carefully monitored. However, as those familiar with this site are aware, I do not necessarily agree with what they depict or imply.
_____
The Special Note summarizes my overall thoughts about our economic situation
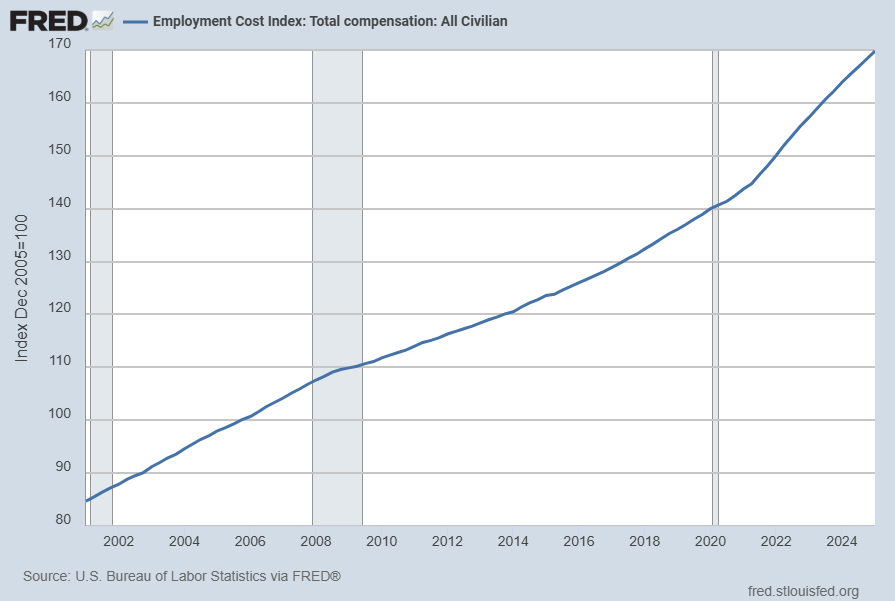
The Employment Cost Index (ECI) is a quarterly measure of the change in the price of labor, defined as compensation per employee hour worked. Closely watched by many economists, the ECI is an indicator of cost pressures within companies that could lead to price inflation for finished goods and services. The index measures changes in the cost of compensation not only for wages and salaries, but also for an extensive list of benefits. As a fixed-weight, or Laspeyres, index, the ECI controls for changes occurring over time in the industrial-occupational composition of employment.
On April 30, 2025, the latest ECI report was released. Here are two excerpts from the BLS release titled “Employment Cost Index – March 2025“:
Compensation costs for civilian workers increased 0.9 percent, seasonally adjusted, for the 3-month period ending in March 2025, the U.S. Bureau of Labor Statistics reported today. Wages and salaries increased 0.8 percent and benefit costs increased 1.2 percent from December 2024. (See tables A, 1, 2, and 3.)
Compensation costs for civilian workers increased 3.6 percent for the 12-month period ending in March 2025 and increased 4.2 percent in March 2024. Wages and salaries increased 3.5 percent for the 12-month period ending in March 2025 and increased 4.4 percent in March 2024. Benefit costs increased 3.8 for the 12-month period ending in March 2025. The prior year’s increase was 3.7 percent. (See tables A, 4, 8, and 12.)
Below are three charts, updated on April 30, 2024 that depict various aspects of the ECI, which is seasonally adjusted (SA):
The first depicts the ECI, with a value of 169.8:
source: US. Bureau of Labor Statistics, Employment Cost Index: Total compensation: All Civilian [ECIALLCIV], retrieved from FRED, Federal Reserve Bank of St. Louis, accessed April 30, 2025: https://fred.stlouisfed.org/series/ECIALLCIV/#
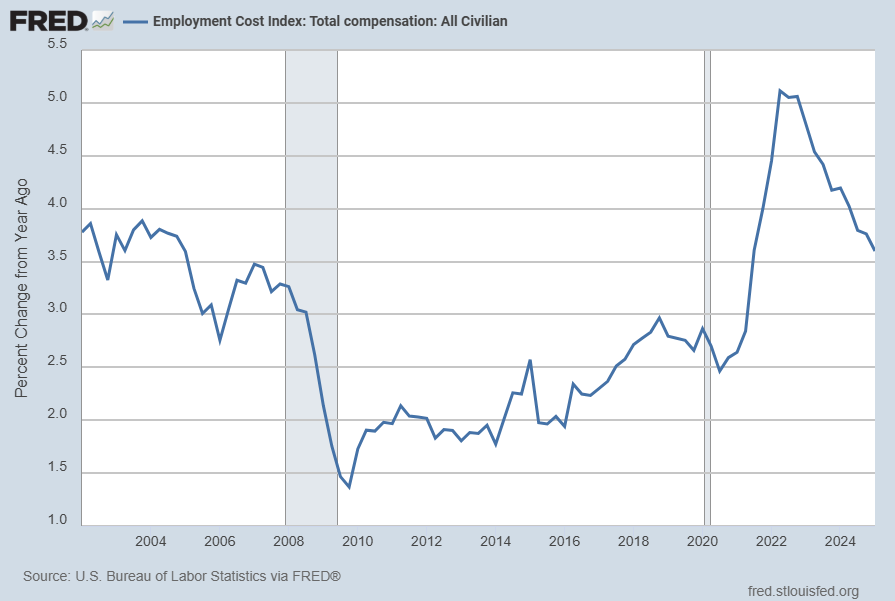
The second chart depicts the ECI on a “Percent Change from Year Ago” basis, with a value of 3.6%:
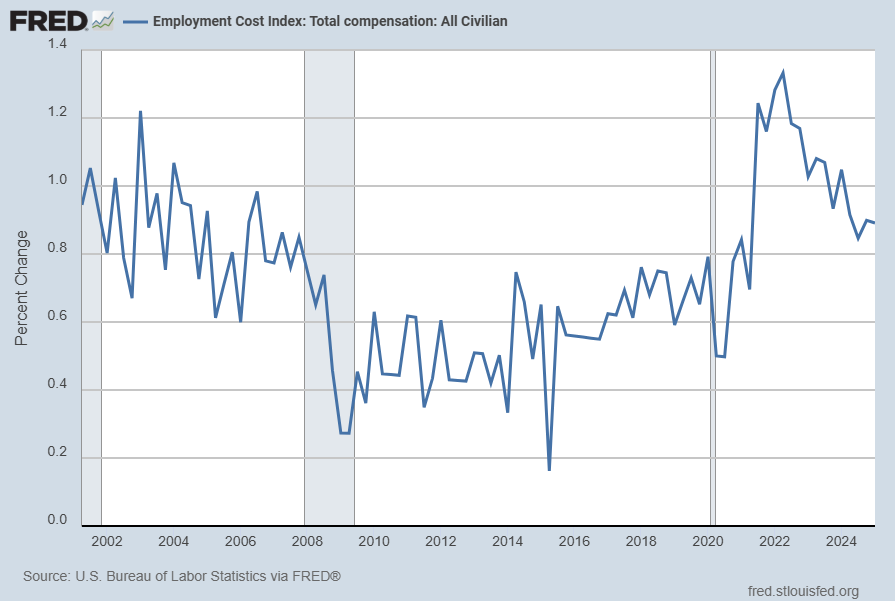
The third chart depicts the ECI on a “Percent Change” (from last quarter) basis, with a value of .9%:
_________
I post various indicators and indices because I believe they should be carefully monitored. However, as those familiar with this site are aware, I do not necessarily agree with what they depict or imply.
_____
The Special Note summarizes my overall thoughts about our economic situation
Advisor Perspectives had a post of April 29, 2025 (“Consumer Confidence Plunges to 5-Year Low in April“) that displays the latest Conference Board Consumer Confidence and University of Michigan Consumer Sentiment Index charts. They are presented below:
(click on charts to enlarge images)
–
–
While I don’t believe that confidence surveys should be overemphasized, I find these readings and trends to be notable, especially in light of a variety of other highly disconcerting measures highlighted throughout this site.
_____
The Special Note summarizes my overall thoughts about our economic situation
The following is an update of various indicators that are supposed to predict and/or depict economic activity. These indicators have been discussed in previous blog posts:
The April 2025 Chicago Fed National Activity Index (CFNAI) updated as of April 24, 2025:
The CFNAI, with a current reading of -.03:
source: Federal Reserve Bank of Chicago, Chicago Fed National Activity Index [CFNAI], retrieved from FRED, Federal Reserve Bank of St. Louis; accessed April 24, 2025: https://fred.stlouisfed.org/series/CFNAI
The CFNAI-MA3, with a current reading of -.01:
source: Federal Reserve Bank of Chicago, Chicago Fed National Activity Index: Three Month Moving Average [CFNAIMA3], retrieved from FRED, Federal Reserve Bank of St. Louis; accessed April 24, 2025: https://fred.stlouisfed.org/series/CFNAIMA3
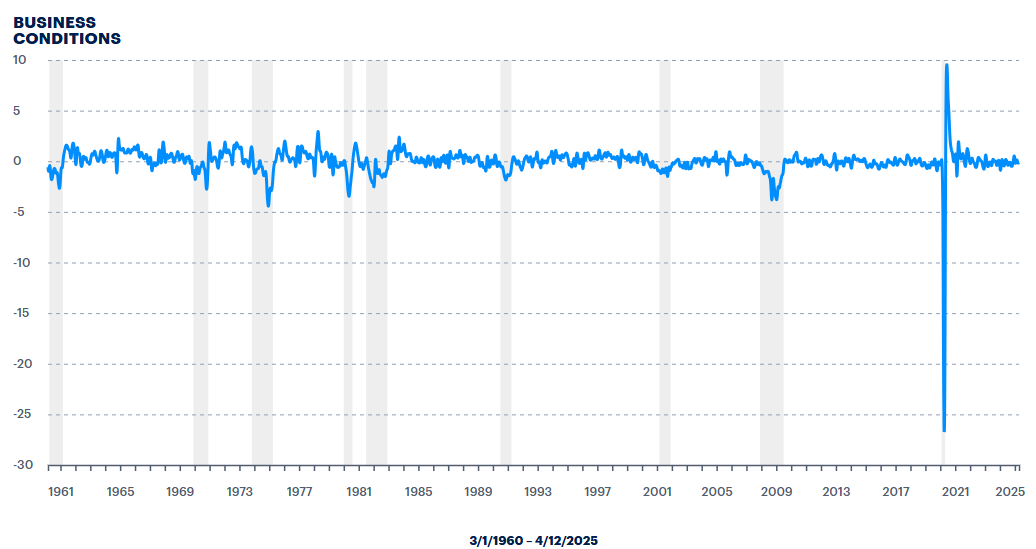
The ADS Index as of April 17, 2025, reflecting data from March 1, 1960 through April 12, 2025, with last value -.100763:
–
The Conference Board Leading Economic Index (LEI), Coincident Economic Index (CEI), and Lagging Economic Index (LAG):
As per the April 21, 2025 Conference Board press release the LEI was 100.5 in March, the CEI was 114.4 in March, and the LAG was 119.1 in March.
An excerpt from the release:
“The US LEI for March pointed to slowing economic activity ahead,” said Justyna Zabinska-La Monica, Senior Manager, Business Cycle Indicators, at The Conference Board. “March’s decline was concentrated among three components that weakened amid soaring economic uncertainty ahead of pending tariff announcements: 1) consumer expectations dropped further, 2) stock prices recorded their largest monthly decline since September 2022, and 3) new orders in manufacturing softened. That said, the data does not suggest that a recession has begun or is about to start. Still, the Conference Board downwardly revised our US GDP growth forecast for 2025 to 1.6%, which is somewhat below the economy’s potential. The slower projected growth rate reflects the impact of deepening trade wars, which may result in higher inflation, supply chain disruptions, less investing and spending, and a weaker labor market.”
_________
I post various indicators and indices because I believe they should be carefully monitored. However, as those familiar with this site are aware, I do not necessarily agree with what they depict or imply.
_____
The Special Note summarizes my overall thoughts about our economic situation
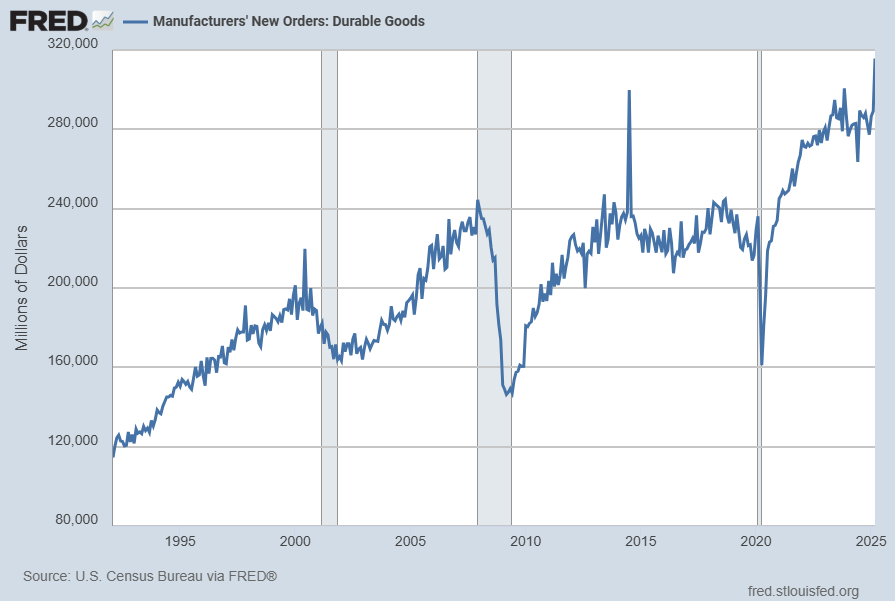
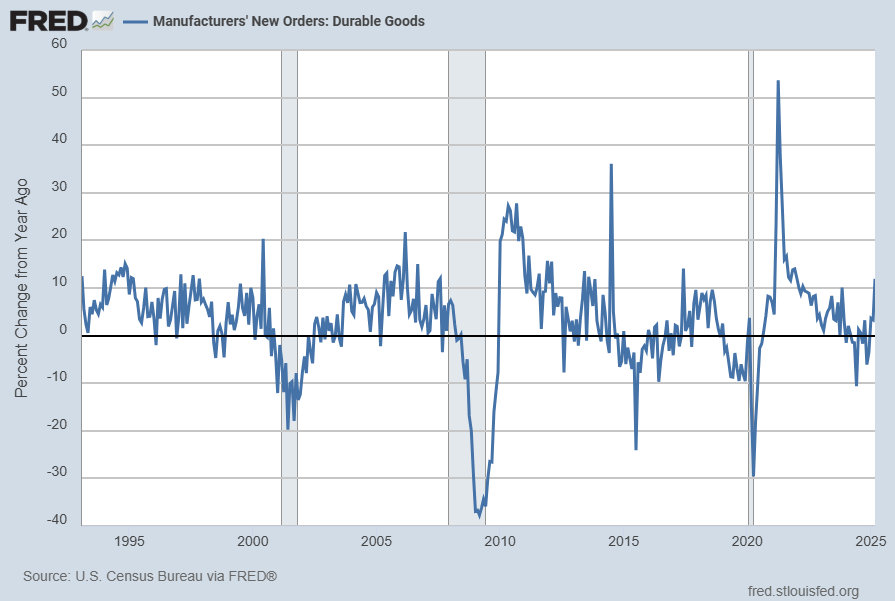
Many people place emphasis on Durable Goods New Orders as a prominent economic indicator and/or leading economic indicator.
For reference, below are two charts depicting this measure.
First, from the St. Louis Fed site (FRED), a chart through March 2025, updated on April 24, 2025. This value is $315,729 ($ Millions):
(click on charts to enlarge images)
–
Second, here is the chart depicting this measure on a “Percent Change from a Year Ago” basis, with a last value of 11.9%:
Data Source: FRED, Federal Reserve Economic Data, Federal Reserve Bank of St. Louis: Manufacturers’ New Orders: Durable Goods [DGORDER]; U.S. Department of Commerce: Census Bureau; accessed April 24, 2025; http://research.stlouisfed.org/fred2/series/DGORDER
_________
I post various indicators and indices because I believe they should be carefully monitored. However, as those familiar with this site are aware, I do not necessarily agree with what they depict or imply.
_____
The Special Note summarizes my overall thoughts about our economic situation
Perhaps the main reason that I write of our economic situation is that I continue to believe, based upon various analyses, that our economic situation is in many ways misunderstood. While no one likes to contemplate a future rife with economic adversity, current and future economic problems must be properly recognized and rectified if high-quality, sustainable long-term economic vitality is to be realized.
There are an array of indications and other “warning signs” – many readily apparent – that current economic activity and financial market performance is accompanied by exceedingly perilous dynamics.
I have written extensively about this peril, including in the following:
My analyses continues to indicate that the growing level of financial danger will lead to the next stock market crash that will also involve (as seen in 2008) various other markets as well. Key attributes of this next crash is its outsized magnitude (when viewed from an ultra-long term historical perspective) and the resulting economic impact. This next financial crash is of tremendous concern, as my analyses indicate it will lead to a Super Depression – i.e. an economy characterized by deeply embedded, highly complex, and difficult-to-solve problems.
For long-term reference purposes, here is a chart of the Dow Jones Industrial Average since 1900, depicted on a monthly basis using a LOG scale (updated through April 17, 2025 with a last value of 39,142.23):
(click on chart to enlarge image)(chart courtesy of StockCharts.com)
_____
The Special Note summarizes my overall thoughts about our economic situation
For reference purposes, below are two sets of charts depicting growth in the money supply.
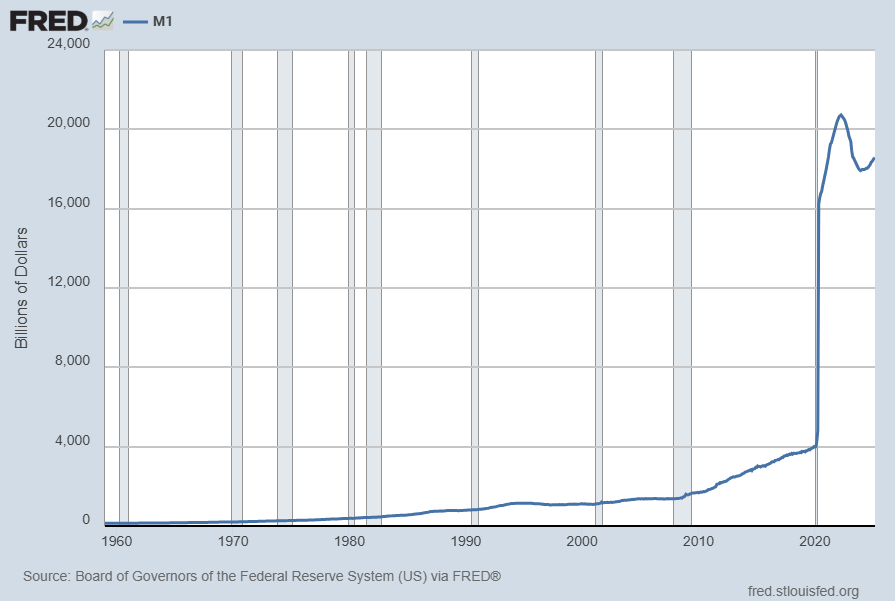
The first shows the M1, defined in FRED as the following:
Before May 2020, M1 consists of (1) currency outside the U.S. Treasury, Federal Reserve Banks, and the vaults of depository institutions; (2) demand deposits at commercial banks (excluding those amounts held by depository institutions, the U.S. government, and foreign banks and official institutions) less cash items in the process of collection and Federal Reserve float; and (3) other checkable deposits (OCDs), consisting of negotiable order of withdrawal, or NOW, and automatic transfer service, or ATS, accounts at depository institutions, share draft accounts at credit unions, and demand deposits at thrift institutions.
Beginning May 2020, M1 consists of (1) currency outside the U.S. Treasury, Federal Reserve Banks, and the vaults of depository institutions; (2) demand deposits at commercial banks (excluding those amounts held by depository institutions, the U.S. government, and foreign banks and official institutions) less cash items in the process of collection and Federal Reserve float; and (3) other liquid deposits, consisting of OCDs and savings deposits (including money market deposit accounts). Seasonally adjusted M1 is constructed by summing currency, demand deposits, and OCDs (before May 2020) or other liquid deposits (beginning May 2020), each seasonally adjusted separately.
Here is the “M1 Money Stock” (seasonally adjusted) chart, updated on April 22, 2025 depicting data through March 2025, with a value of $18,560.8 Billion:
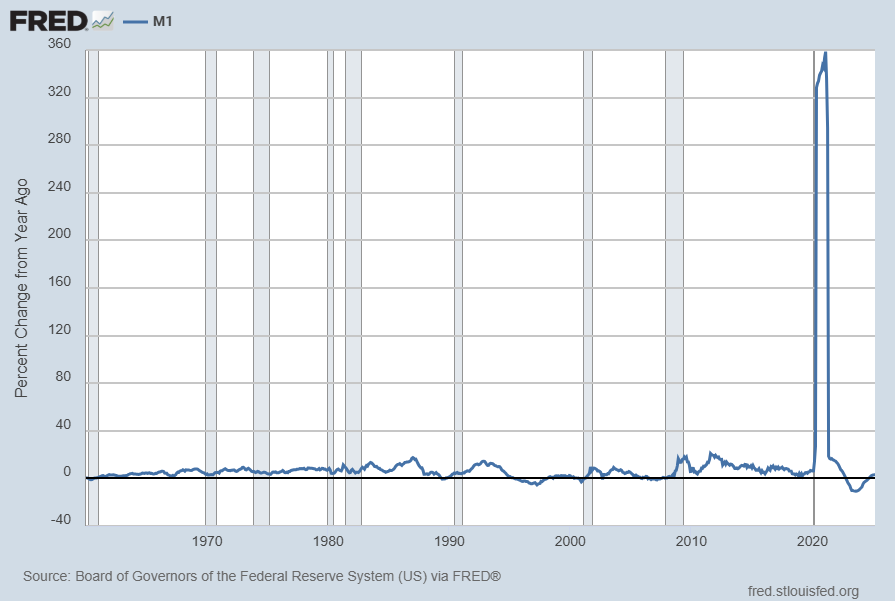
Here is the “M1 Money Stock” chart on a “Percent Change From Year Ago” basis, with a current value of 3.2%:
Data Source: Board of Governors of the Federal Reserve System (US), M1 Money Stock [M1SL], retrieved from FRED, Federal Reserve Bank of St. Louis; accessed April 22, 2025: https://fred.stlouisfed.org/series/M1SL
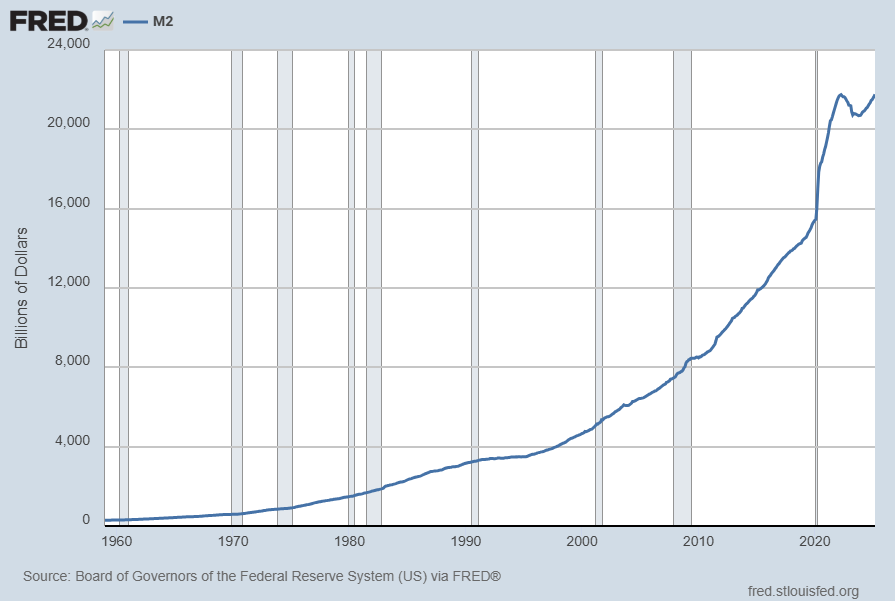
The second set shows M2, defined in FRED as the following:
Before May 2020, M2 consists of M1 plus (1) savings deposits (including money market deposit accounts); (2) small-denomination time deposits (time deposits in amounts of less than $100,000) less individual retirement account (IRA) and Keogh balances at depository institutions; and (3) balances in retail money market funds (MMFs) less IRA and Keogh balances at MMFs.
Beginning May 2020, M2 consists of M1 plus (1) small-denomination time deposits (time deposits in amounts of less than $100,000) less IRA and Keogh balances at depository institutions; and (2) balances in retail MMFs less IRA and Keogh balances at MMFs. Seasonally adjusted M2 is constructed by summing savings deposits (before May 2020), small-denomination time deposits, and retail MMFs, each seasonally adjusted separately, and adding this result to seasonally adjusted M1.
Here is the “M2 Money Stock” (seasonally adjusted) chart, updated on April 22, 2025, depicting data through March 2025, with a value of $21,762.5 Billion:
Here is the “M2 Money Stock” chart on a “Percent Change From Year Ago” basis, with a current value of 4.1%:
Data Source: Board of Governors of the Federal Reserve System (US), M2 Money Stock [M2SL], retrieved from FRED, Federal Reserve Bank of St. Louis; accessed April 22, 2025: https://fred.stlouisfed.org/series/M2SL
_____
The Special Note summarizes my overall thoughts about our economic situation
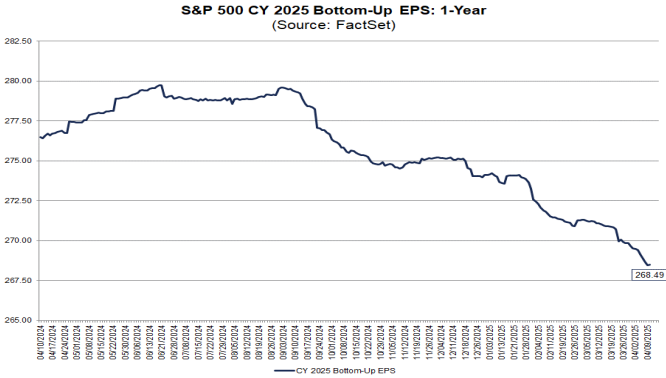
FactSet publishes a report titled “Earnings Insight” that contains a variety of information including the trends and expectations of S&P500 earnings.
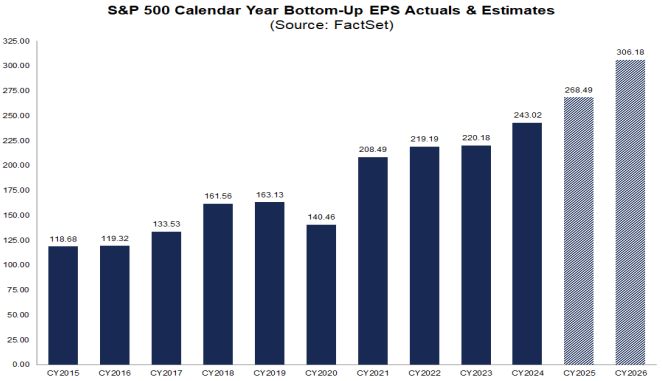
For reference purposes, here are two charts as seen in the “Earnings Insight” report of April 11, 2025:
from page 29:
(click on charts to enlarge images)
from page 30:
_____
I post various economic forecasts because I believe they should be carefully monitored. However, as those familiar with this site are aware, I do not agree with many of the consensus estimates and much of the commentary in these forecast surveys.
_____
The Special Note summarizes my overall thoughts about our economic situation
As many are aware, Refinitiv publishes earnings estimates for the S&P500. (My other posts concerning S&P earnings estimates can be found under the S&P500 Earnings label)
The following estimates are from Exhibit 24 of the “S&P500 Earnings Scorecard” (pdf) of April 11, 2025, and represent an aggregation of individual S&P500 component “bottom up” analyst forecasts. For reference, the Year 2014 value is $118.78/share; the Year 2015 value is $117.46/share; the Year 2016 value is $118.10/share; the Year 2017 value is $132.00/share; the Year 2018 value is $161.93/share; the Year 2019 value is $162.93/share; the Year 2020 value is $139.72/share; the year 2021 value is $208.12/share; the year 2022 value is $218.09/share; and the year 2023 value is $221.36/share:
Year 2024 estimate:
$242.73/share
Year 2025 estimate:
$267.50/share
Year 2026 estimate:
$305.77/share
Year 2027 estimate:
$344.30/share
_____
I post various economic forecasts because I believe they should be carefully monitored. However, as those familiar with this site are aware, I do not agree with many of the consensus estimates and much of the commentary in these forecast surveys.
_____
The Special Note summarizes my overall thoughts about our economic situation