Throughout this site there are many discussions of economic indicators. This post is the latest in a series of posts indicating facets of U.S. economic weakness or a notably low growth rate.
The level and trend of economic growth is especially notable at this time. As seen in various sources, recession estimates have been at elevated levels.
As seen in the January 2025 Wall Street Journal Economic Forecast Survey the consensus (average estimate) among various economists is for 2.54% GDP in 2024, 2.00% GDP in 2025, 2.00% GDP in 2026, and 2.04% GDP in 2027.
Charts Indicating U.S. Economic Weakness
Below is a small sampling of charts that depict weak growth or contraction, and a brief comment for each:
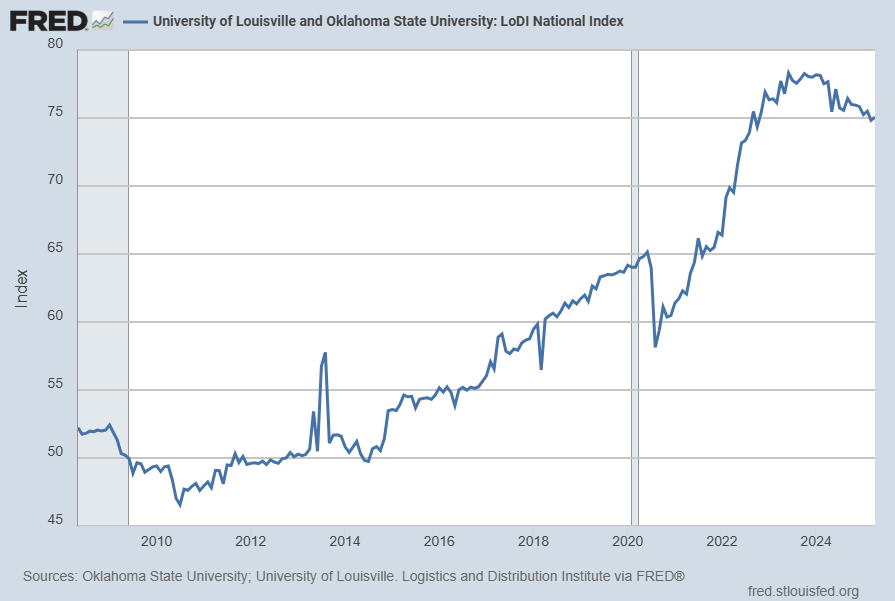
University of Louisville and Oklahoma State University: LoDI National Index (LODINIM066N)
The LoDI National Index is described in FRED as:
The LoDI Index uses linear regression analysis to combine cargo volume data from rail, barge, air, and truck transit, along with various economic factors. The resulting indicator is designed to predict upcoming changes in the level of logistics and distribution activity in the US and is represented by a value between 1 and 100. An index at or above 50 represents a healthy level of activity in the industry.
As seen in the long-term chart below, the index appears to have recently peaked.
Shown below is a chart with data through April 2025 (last value of 75.06450), last updated April 1, 2025:
Below is this measure displayed on a “Percent Change From Year Ago” basis with value -3.3%:

source: University of Louisville. Logistics and Distribution Institute and Oklahoma State University, University of Louisville and Oklahoma State University: LoDI National Index [LODINIM066N], retrieved from FRED, Federal Reserve Bank of St. Louis; accessed April 7, 2025: https://fred.stlouisfed.org/series/LODINIM066N
__
Job Openings (JTSJOL)
Job openings (Job Openings: Total Nonfarm [JTSJOL]), although still at a high level, have recently declined significantly. This “Job Openings” measure had a value of 7,568 (Thousands) through February 2025 as of the April 1, 2024 update, as shown below:

Below is this measure displayed on a “Percent Change From Year Ago” basis with value -10.4%:

source: U.S. Bureau of Labor Statistics, Job Openings: Total Nonfarm [JTSJOL], retrieved from FRED, Federal Reserve Bank of St. Louis; accessed April 7, 2025: https://fred.stlouisfed.org/series/JTSJOL
__
Motor Vehicle Retail Sales: Heavy Weight Trucks (HTRUCKSSA)
Sales of “Heavy Weight Trucks” (HTRUCKSSA) has recently been volatile. Shown below is this measure with last value of 36.313 Thousand through February 2025, last updated March 28, 2025:

Below is this measure displayed on a “Percent Change From Year Ago” basis with value -14.2%:

source: U.S. Bureau of Economic Analysis, Motor Vehicle Retail Sales: Heavy Weight Trucks [HTRUCKSSA], retrieved from FRED, Federal Reserve Bank of St. Louis; accessed April 7, 2025: https://fred.stlouisfed.org/series/HTRUCKSSA
__
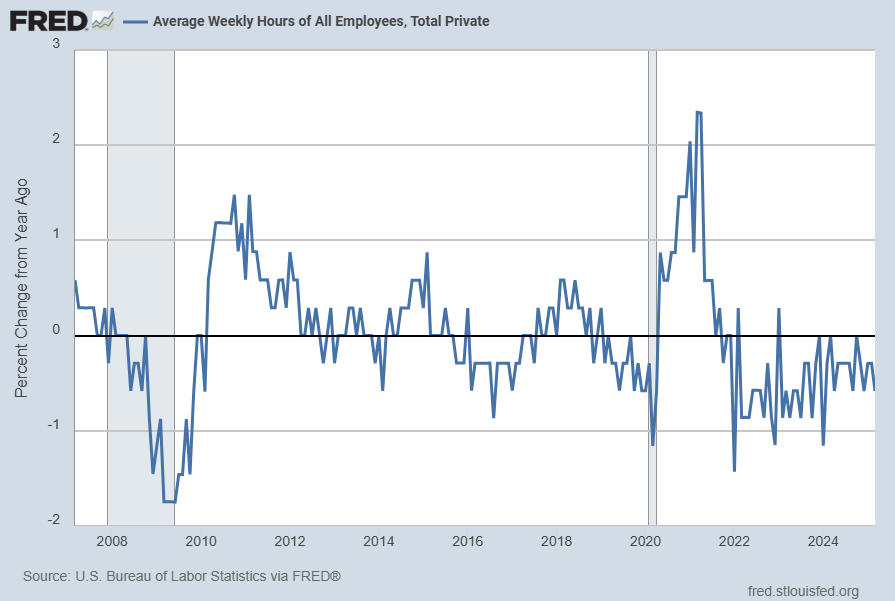
Average Weekly Hours of All Employees, Total Private (AWHAETP)
Average Weekly Hours of All Employees, Total Private continues a significant downward progression. This “Average Weekly Hours” measure had a value of 34.2 (Hours) through March 2025 as of the April 4, 2025 update:

Below is this measure displayed on a “Percent Change From Year Ago” basis with value -.6%:
source: U.S. Bureau of Labor Statistics, Average Weekly Hours of All Employees, Total Private [AWHAETP], retrieved from FRED, Federal Reserve Bank of St. Louis; accessed April 7, 2025: https://fred.stlouisfed.org/series/AWHAETP
__
Other Indicators
As mentioned previously, many other indicators discussed on this site indicate weak economic growth or economic contraction, if not outright (gravely) problematical economic conditions.
_____
The Special Note summarizes my overall thoughts about our economic situation
SPX at 5091.69 as this post is written
No comments:
Post a Comment