Thursday, January 23, 2020

The U.S. Economic Situation – January 23, 2020 Update

Perhaps the main reason that I write of our economic situation is that I continue to believe, based upon various analyses, that our economic situation is in many ways misunderstood.  While no one likes to contemplate a future rife with economic adversity, current and future economic problems must be properly recognized and rectified if high-quality, sustainable long-term economic vitality is to be realized.
There are an array of indications and other “warning signs” – many readily apparent – that current economic activity and financial market performance is accompanied by exceedingly perilous dynamics.
I have written extensively about this peril, including in the following:
Building Financial Danger” (ongoing updates)
My analyses continues to indicate that the growing level of financial danger will lead to the next stock market crash that will also involve (as seen in 2008) various other markets as well.  Key attributes of this next crash is its outsized magnitude (when viewed from an ultra-long term historical perspective) and the resulting economic impact.  This next financial crash is of tremendous concern, as my analyses indicate it will lead to a Super Depression – i.e. an economy characterized by deeply embedded, highly complex, and difficult-to-solve problems.
For long-term reference purposes, here is a chart of the Dow Jones Industrial Average since 1900, depicted on a monthly basis using a LOG scale (updated through January 22, 2020, with a last value of 29186.27):
(click on chart to enlarge image)(chart courtesy of StockCharts.com)
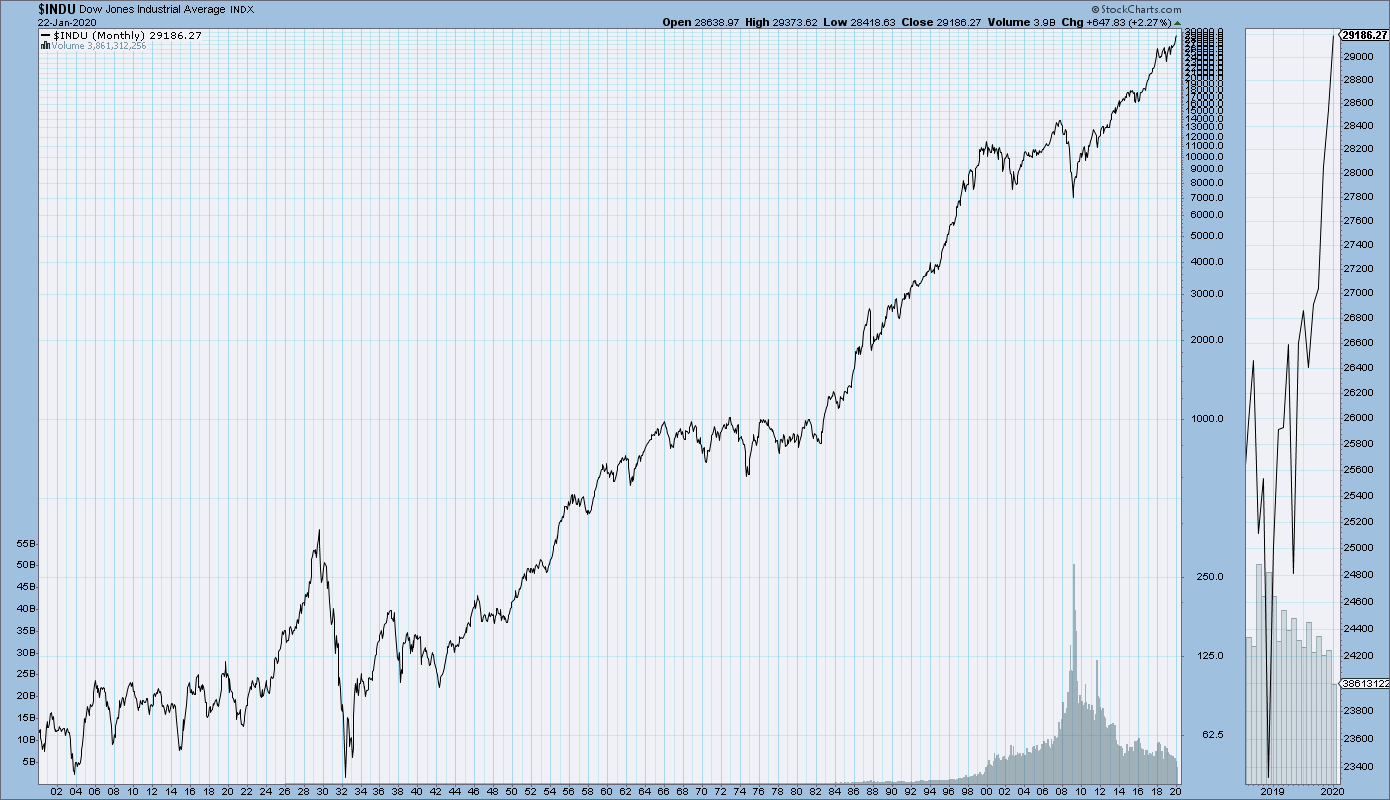
DJIA since 1900 chart
_____
The Special Note summarizes my overall thoughts about our economic situation
SPX at 3321.75 as this post is written

Wednesday, January 22, 2020

Updates Of Economic Indicators January 2020

The following is an update of various indicators that are supposed to predict and/or depict economic activity. These indicators have been discussed in previous blog posts:
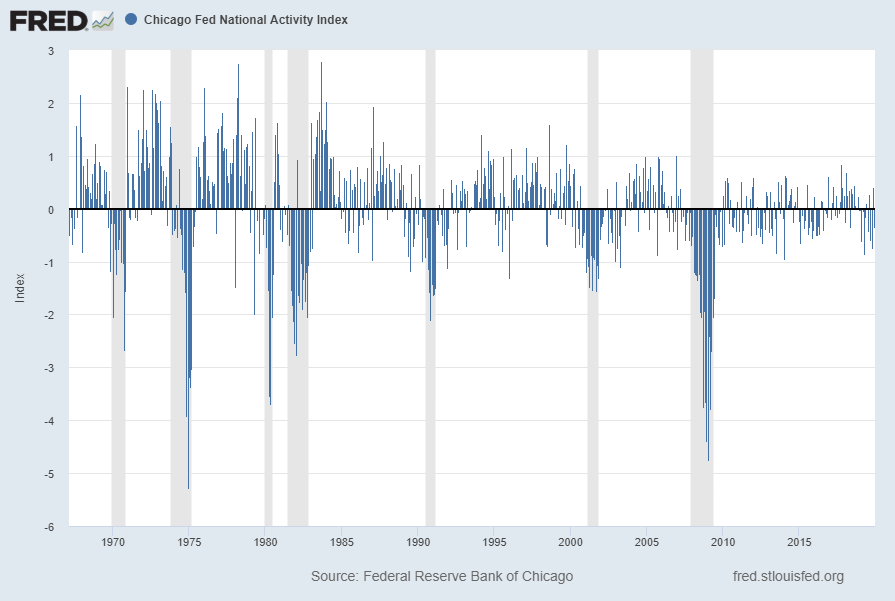
The January 2020 Chicago Fed National Activity Index (CFNAI) updated as of January 22, 2020:
The CFNAI, with current reading of -.35:
CFNAI
source:  Federal Reserve Bank of Chicago, Chicago Fed National Activity Index [CFNAI], retrieved from FRED, Federal Reserve Bank of St. Louis, January 22, 2020;
https://fred.stlouisfed.org/series/CFNAI
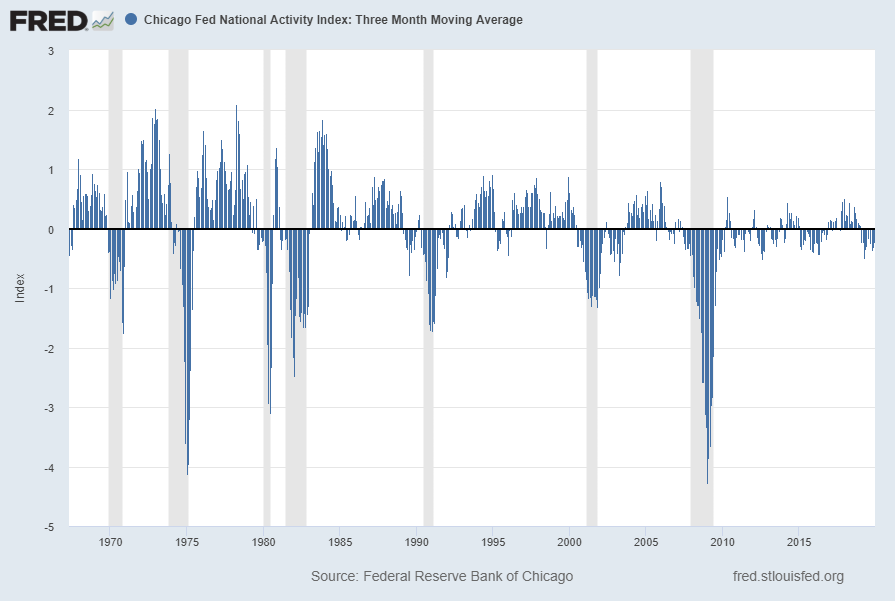
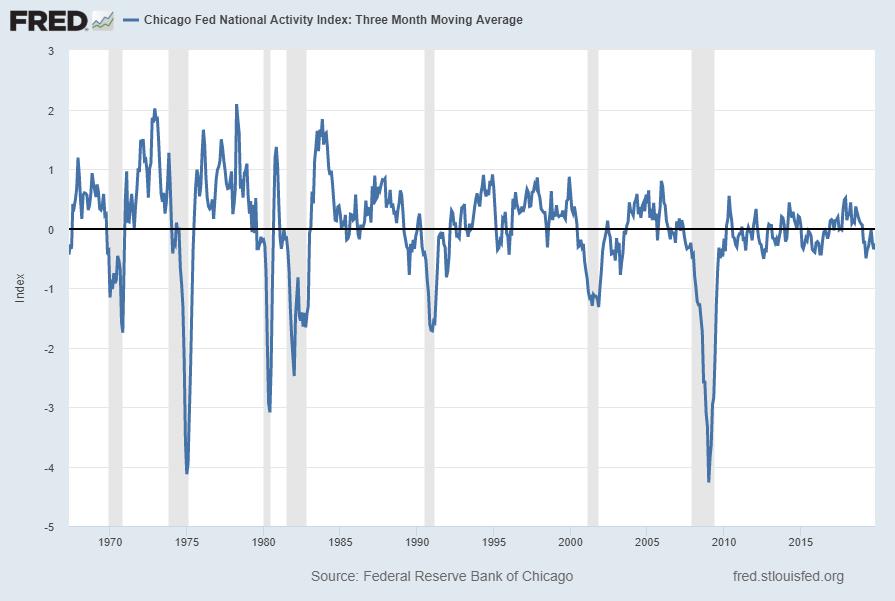
The CFNAI-MA3, with current reading of -.23:
CFNAIMA3
source:  Federal Reserve Bank of Chicago, Chicago Fed National Activity Index: Three Month Moving Average [CFNAIMA3], retrieved from FRED, Federal Reserve Bank of St. Louis, January 22, 2020;
https://fred.stlouisfed.org/series/CFNAIMA3
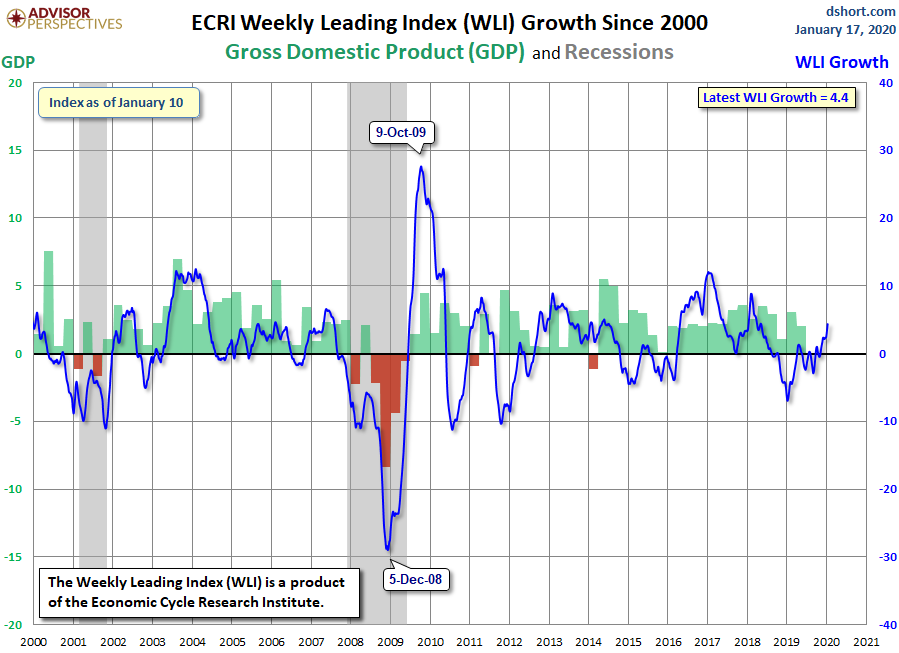
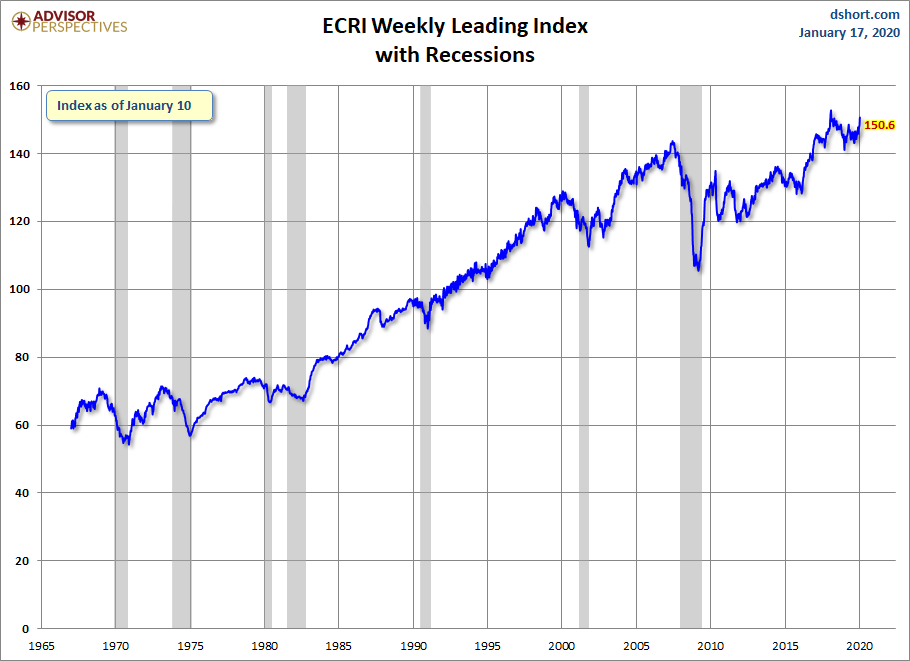
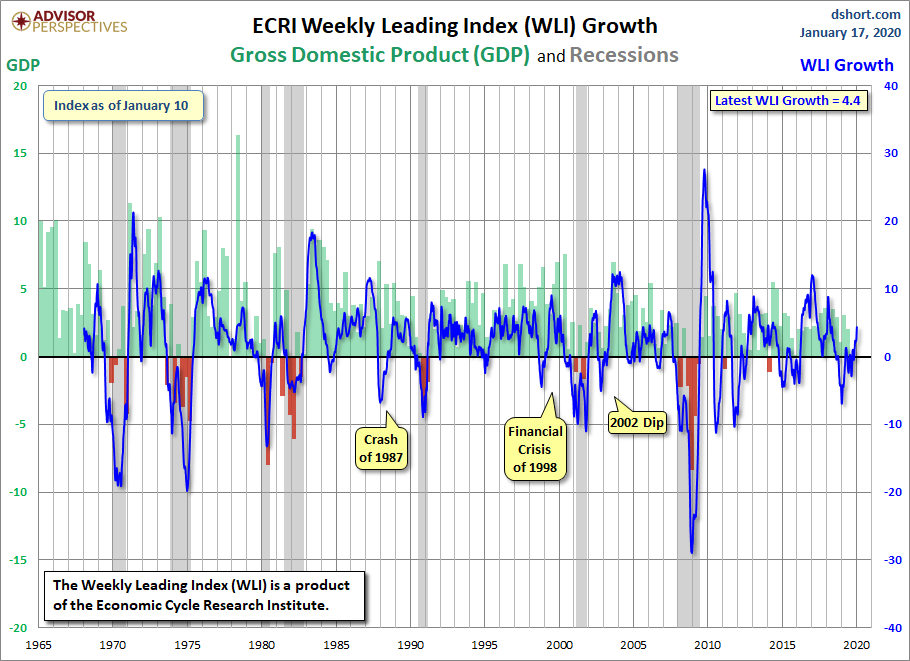
As of January 17, 2020 (incorporating data through January 10, 2020) the WLI was at 150.6 and the WLI, Gr. was at 4.4%.
A chart of the WLI,Gr., from the Doug Short site’s ECRI update post of January 17, 2020:
ECRI WLI,Gr.
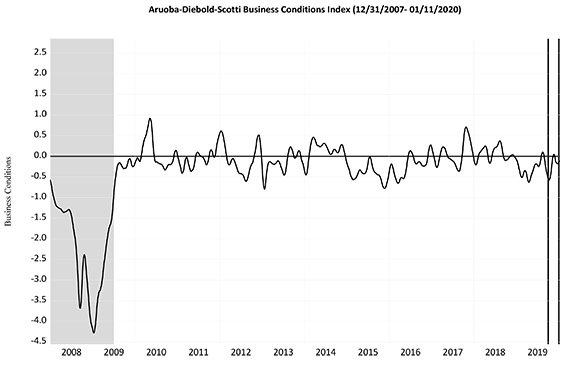
Below is the latest chart, depicting the ADS Index from December 31, 2007 through January 11, 2020:
ADS Index
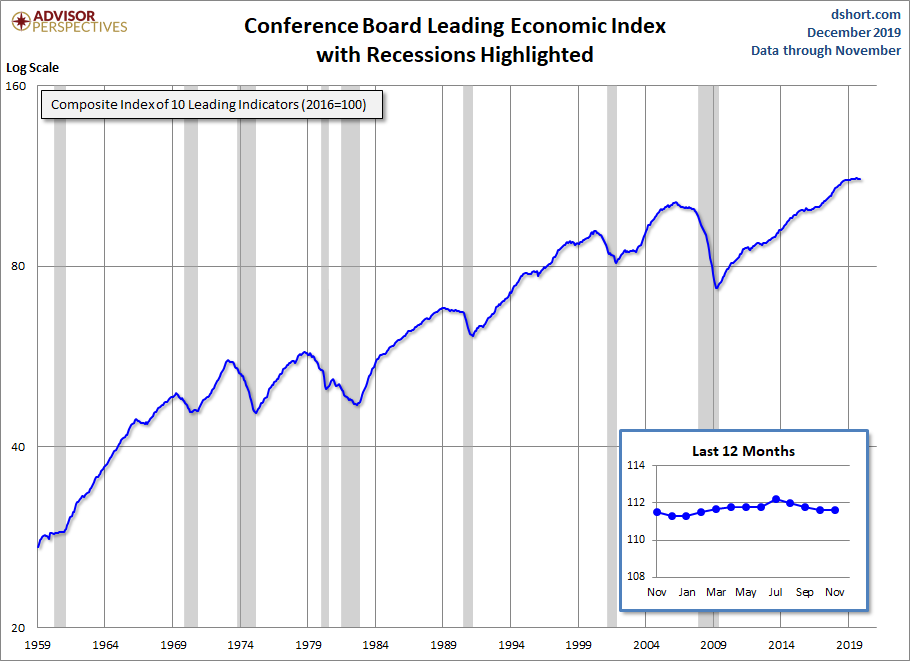
The Conference Board Leading (LEI), Coincident (CEI) Economic Indexes, and Lagging Economic Indicator (LAG):
As per the December 19, 2019 Conference Board press release, titled “The Conference Board Leading Economic Index (LEI) for the U.S. was Unchanged in November” the LEI was at 111.6, the CEI was at 106.8, and the LAG was 108.7 in November.
An excerpt from the release:
The US LEI was unchanged in November after three consecutive monthly declines. Strength in residential construction, financial markets, and consumers’ outlook offset weakness in manufacturing and labor markets,” said Ataman Ozyildirim, Senior Director of Economic Research at The Conference Board. “While the six-month growth rate of the LEI remains slightly negative, the Index suggests that economic growth is likely to stabilize around 2 percent in 2020.”
Here is a chart of the LEI from the Doug Short site Conference Board Leading Economic Index update of December 19, 2019:
Conference Board LEI
_________
I post various indicators and indices because I believe they should be carefully monitored.  However, as those familiar with this site are aware, I do not necessarily agree with what they depict or imply.
_____
The Special Note summarizes my overall thoughts about our economic situation
SPX at 3328.81 as this post is written
Trends Of S&P500 Earnings Forecasts

S&P500 earnings trends and estimates are a notably important topic, for a variety of reasons, at this point in time.
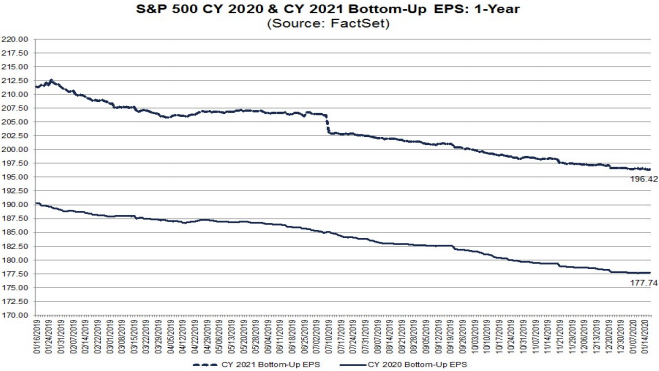
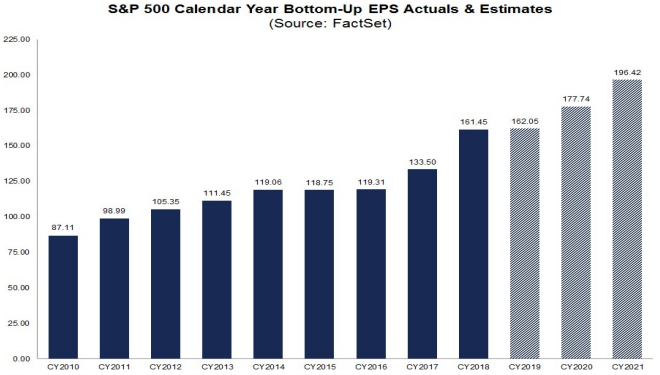
FactSet publishes a report titled “Earnings Insight” that contains a variety of information including the trends and expectations of S&P500 earnings.
For reference purposes, here are two charts as seen in the “Earnings Insight” report of January 17, 2020:
from page 24:
(click on charts to enlarge images)
S&P500 EPS forecasts
from page 25:
S&P500 EPS 2010-2021
_____
I post various economic forecasts because I believe they should be carefully monitored.  However, as those familiar with this site are aware, I do not agree with many of the consensus estimates and much of the commentary in these forecast surveys.
_____
The Special Note summarizes my overall thoughts about our economic situation
SPX at 3320.79 as this post is written
Tuesday, January 21, 2020

S&P500 EPS Forecasts 2019 Through 2021 And Recent EPS

As many are aware, Refinitiv publishes earnings estimates for the S&P500.  (My other posts concerning S&P earnings estimates can be found under the S&P500 Earnings label)
The following estimates are from Exhibit 24 of the “S&P500 Earnings Scorecard” (pdf) of January 21, 2020, and represent an aggregation of individual S&P500 component “bottom up” analyst forecasts.  For reference, the Year 2014 value is $118.78/share; the Year 2015 value is $117.46; the Year 2016 value is $118.10/share; the Year 2017 value is $132.00/share; and the Year 2018 value is $161.93:
Year 2019 estimate:
$161.51/share
Year 2020 estimate:
$177.06/share
Year 2021 estimate:
$196.42/share
_____
I post various economic forecasts because I believe they should be carefully monitored.  However, as those familiar with this site are aware, I do not agree with many of the consensus estimates and much of the commentary in these forecast surveys.
_____
The Special Note summarizes my overall thoughts about our economic situation
SPX at 3320.79 as this post is written
Standard & Poor’s S&P500 EPS Estimates 2019, 2020, & 2021 – January 16, 2020

As many are aware, Standard & Poor’s publishes earnings estimates for the S&P500.  (My posts concerning their estimates can be found under the S&P500 Earnings label)
For reference purposes, the most current estimates are reflected below, and are as of January 16, 2020:
Year 2019 estimates add to the following:
-From a “bottom up” perspective, operating earnings of $158.03/share
-From a “top down” perspective, operating earnings of N/A
-From a “bottom up” perspective, “as reported” earnings of $140.24/share
Year 2020 estimates add to the following:
-From a “bottom up” perspective, operating earnings of $175.16/share
-From a “top down” perspective, operating earnings of N/A
-From a “bottom up” perspective, “as reported” earnings of $160.92/share
Year 2021 estimates add to the following:
-From a “bottom up” perspective, operating earnings of $191.22/share
-From a “top down” perspective, operating earnings of N/A
-From a “bottom up” perspective, “as reported” earnings of $171.23/share
_____
I post various economic forecasts because I believe they should be carefully monitored.  However, as those familiar with this site are aware, I do not agree with many of the consensus estimates and much of the commentary in these forecast surveys.
_____
The Special Note summarizes my overall thoughts about our economic situation
SPX at 3329.62 as this post is written
Friday, January 17, 2020

Long-Term Charts Of The ECRI WLI & ECRI WLI, Gr. – January 17, 2020 Update

As I stated in my July 12, 2010 post ("ECRI WLI Growth History"):
For a variety of reasons, I am not as enamored with ECRI’s WLI and WLI Growth measures as many are.
However, I do think the measures are important and deserve close monitoring and scrutiny.
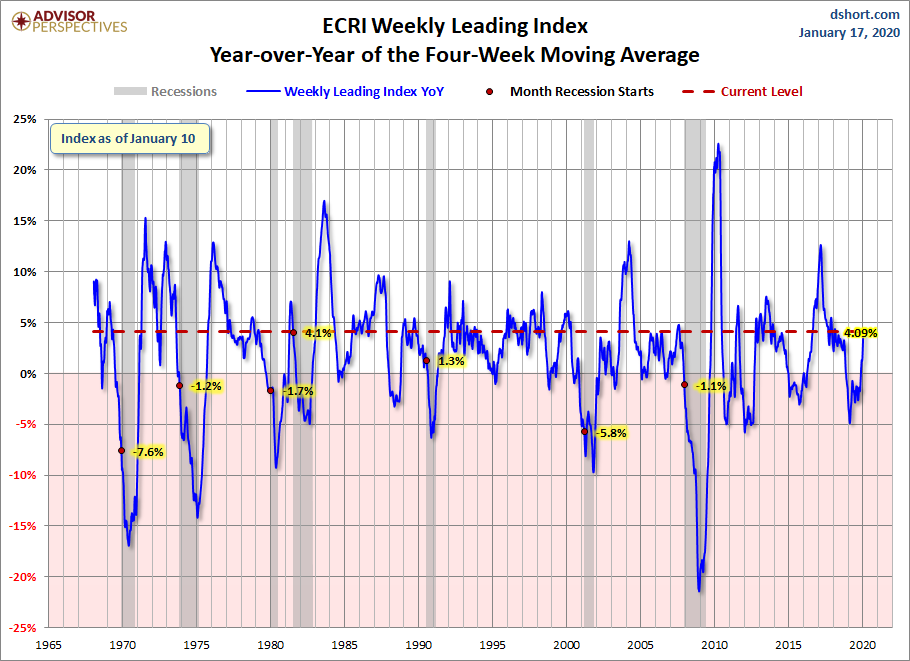
Below are three long-term charts, from the Doug Short site’s ECRI update post of January 17, 2020 titled “ECRI Weekly Leading Index Update.”  These charts are on a weekly basis through the January 17, 2020 release, indicating data through January 10, 2020.
Here is the ECRI WLI (defined at ECRI’s glossary):

ECRI WLI

This next chart depicts, on a long-term basis, the Year-over-Year change in the 4-week moving average of the WLI:

ECRI WLI Year-over-Year of the Four-Week Moving Average

This last chart depicts, on a long-term basis, the WLI, Gr.:

ECRI WLI,Gr.

_________
I post various economic indicators and indices because I believe they should be carefully monitored.  However, as those familiar with this site are aware, I do not necessarily agree with what they depict or imply.
_____
The Special Note summarizes my overall thoughts about our economic situation
SPX at 3329.62 as this post is written
Thursday, January 16, 2020

The January 2020 Wall Street Journal Economic Forecast Survey

The January 2020 Wall Street Journal Economic Forecast Survey was published on January 16, 2020.  The headline is “WSJ Survey: U.S., China Agreement Will Boost Growth.”
I found numerous items to be notable – although I don’t necessarily agree with them – both within the article and in the “Economist Q&A” section.
Two excerpts:
On average, forecasters expected GDP would expand 1.9% this year, measured from the fourth quarter of 2019 to the fourth quarter of this year, compared with an anticipated 2.3% in 2019. GDP increased 2.5% in 2018 from the year-earlier fourth quarter and 2.8% in 2017, according to the Commerce Department. Economists saw the unemployment rate, which was 3.5% in December, ticking up to 3.6% in December 2020.
also:
Still, economists were broadly upbeat for 2020. The probability of a recession this year ticked down in January to 24%, the lowest average since last May.
About 30% of economists said they expect the next recession to start in 2021, and another 30% see one in 2022. Roughly 14% expect it in 2023.
As mentioned above, as well as seen in the “Recession Probability” section, the average response as to the odds of another recession starting within the next 12 months was 23.97%. The individual estimates, of those who responded, ranged from 0% to 67%.  For reference, the average response in December’s survey was 25.85%.
As stated in the article, the survey’s 71 respondents were academic, financial and business economists.  Not every economist answered every question.  The survey was conducted January 10 – January 14, 2020.

Economic Forecasts

The current average forecasts among economists polled include the following:

GDP:

full-year 2019:  2.27%
full-year 2020:  1.87%
full-year 2021:  1.97%
full-year 2022:  1.97%

Unemployment Rate:

December 2020: 3.62%
December 2021: 3.83%
December 2022: 4.04%

10-Year Treasury Yield:

December 2020: 2.03%
December 2021: 2.25%
December 2022: 2.53%

CPI:

December 2020:  1.99%
December 2021:  2.16%
December 2022:  2.22%

Crude Oil  ($ per bbl):

for 12/31/2020: $57.41
for 12/31/2021: $58.12
for 12/31/2022: $57.82
(note: I highlight this WSJ Economic Forecast survey each month; commentary on past surveys can be found under the “Economic Forecasts” label)
_____
I post various economic forecasts because I believe they should be carefully monitored.  However, as those familiar with this site are aware, I do not necessarily agree with many of the consensus estimates and much of the commentary in these forecast surveys.
_____
The Special Note summarizes my overall thoughts about our economic situation
SPX at 3316.81 as this post is written
Disturbing Charts (Update 36)

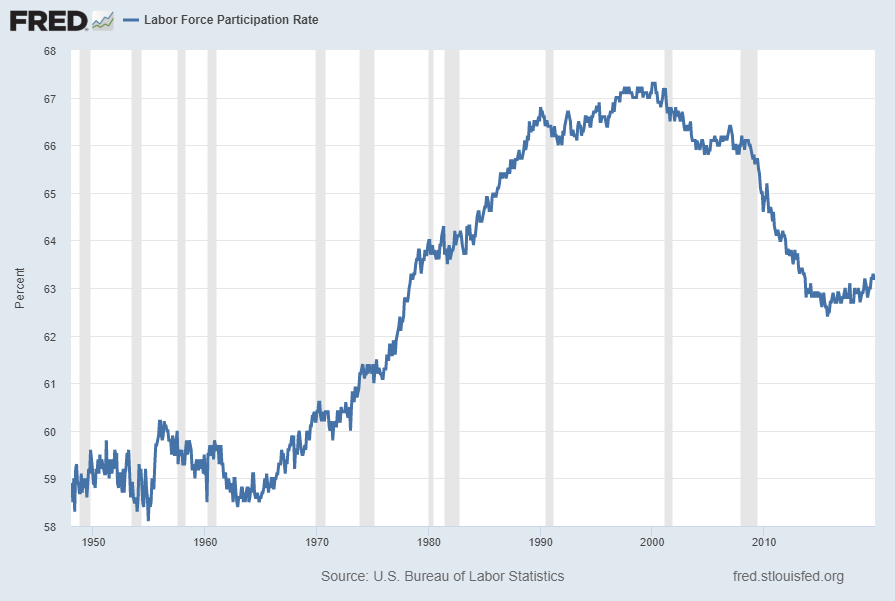
I find the following charts to be disturbing.   These charts would be disturbing at any point in the economic cycle; that they (on average) depict such a tenuous situation now – 127 months after the official (as per the September 20, 2010 NBER BCDC announcement) June 2009 end of the recession – is especially notable.
These charts raise a lot of questions.  As well, they highlight the “atypical” nature of our economic situation from a long-term historical perspective.
All of these charts are from the Federal Reserve, and represent the most recently updated data.
(click on charts to enlarge images)

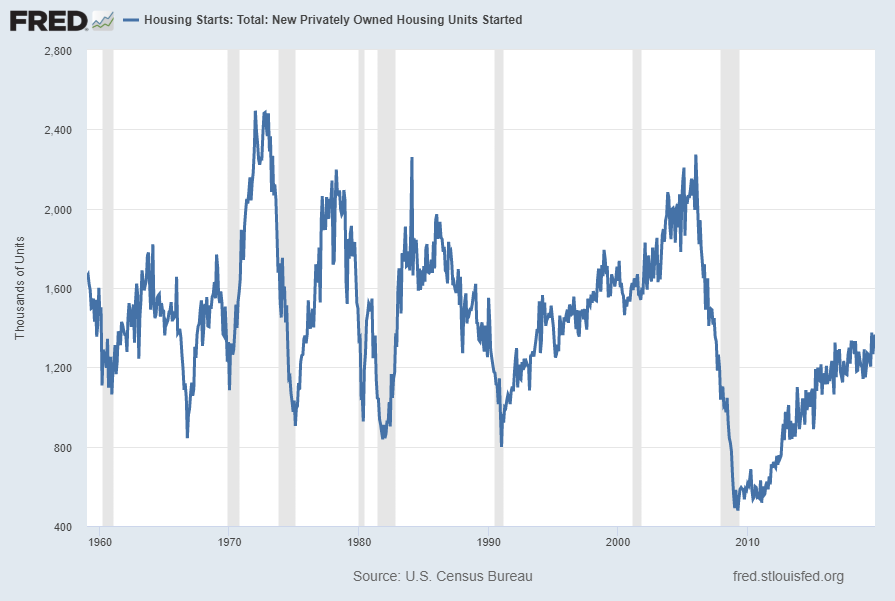
Housing starts (last updated December 17, 2019):

Housing Starts
US. Bureau of the Census, Housing Starts: Total: New Privately Owned Housing Units Started [HOUST], retrieved from FRED, Federal Reserve Bank of St. Louis https://research.stlouisfed.org/fred2/series/HOUST/, January 15, 2020.

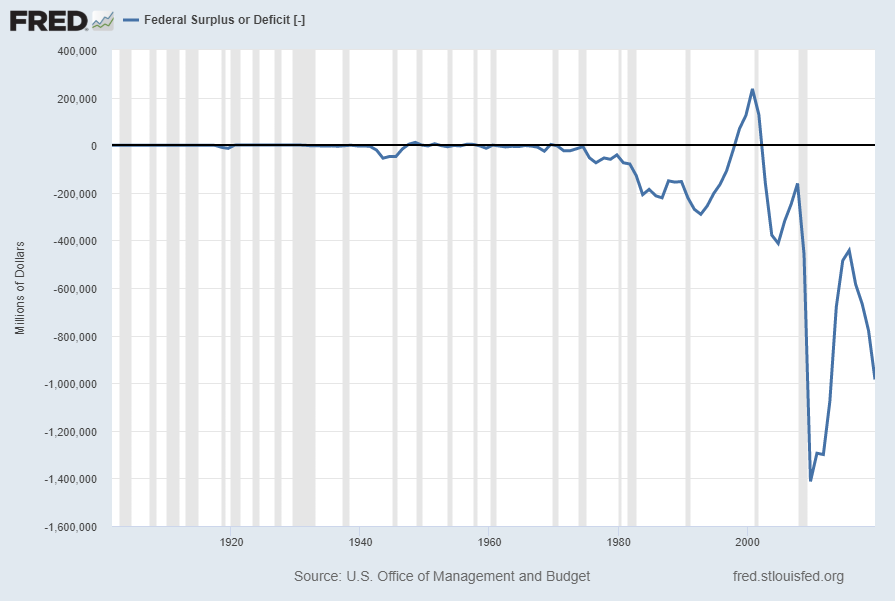
The Federal Deficit (last updated October 25, 2019):

Federal Deficit
US. Office of Management and Budget, Federal Surplus or Deficit [-] [FYFSD], retrieved from FRED, Federal Reserve Bank of St. Louis https://research.stlouisfed.org/fred2/series/FYFSD/, January 15, 2020.

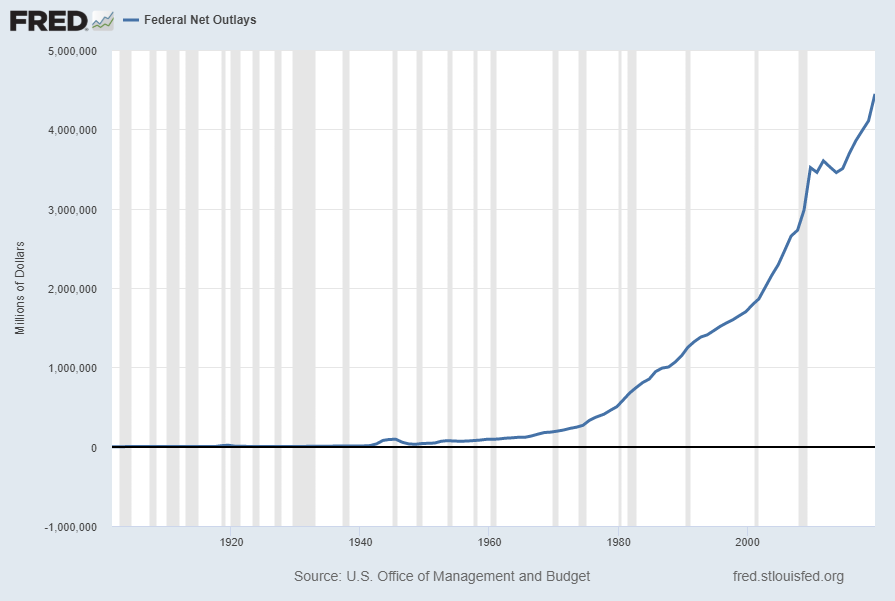
Federal Net Outlays (last updated October 25, 2019):

Federal Net Outlays
US. Office of Management and Budget, Federal Net Outlays [FYONET], retrieved from FRED, Federal Reserve Bank of St. Louis https://research.stlouisfed.org/fred2/series/FYONET/, January 15, 2020.

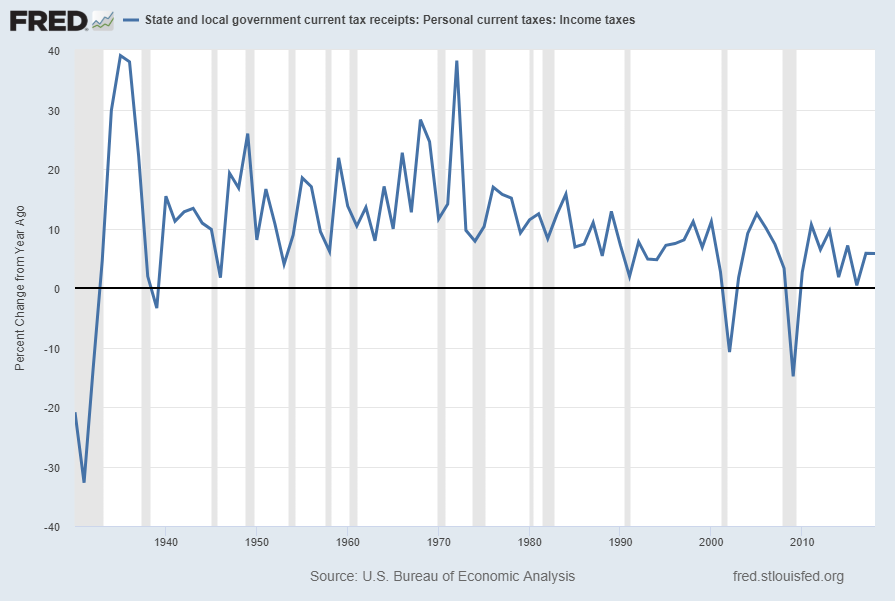
State & Local Personal Income Tax Receipts (% Change from Year Ago)(last updated July 26, 2019):

State & Local Personal Income Tax Receipts Percent Change From Year Ago
US. Bureau of Economic Analysis, State and local government current tax receipts: Personal current taxes: Income taxes [ASLPITAX], retrieved from FRED, Federal Reserve Bank of St. Louis https://research.stlouisfed.org/fred2/series/ASLPITAX/, January 15, 2020.

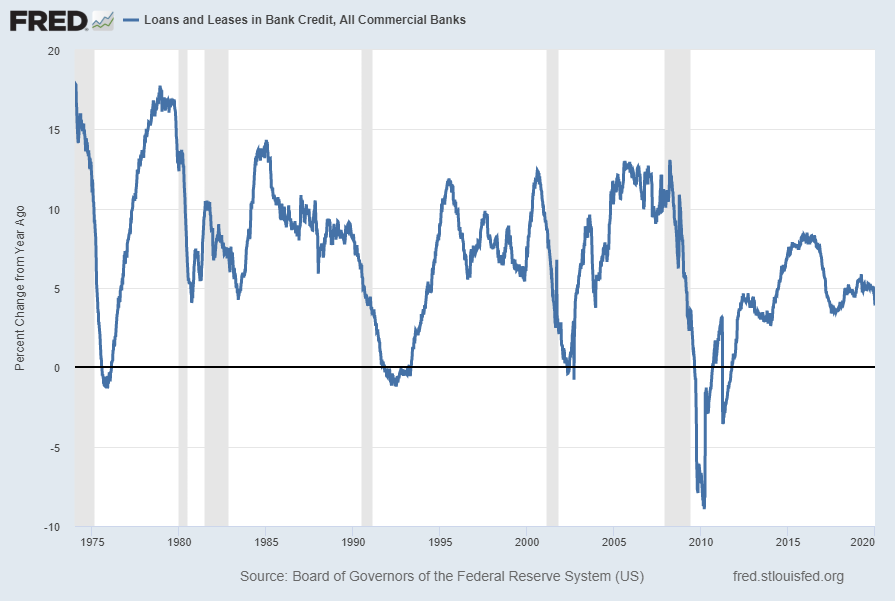
Total Loans and Leases of Commercial Banks (% Change from Year Ago)(last updated January 10, 2020):

Total Loans and Leases of Commercial Banks Percent Change From Year Ago
Board of Governors of the Federal Reserve System (US), Loans and Leases in Bank Credit, All Commercial Banks [TOTLL], retrieved from FRED, Federal Reserve Bank of St. Louis https://research.stlouisfed.org/fred2/series/TOTLL/, January 15, 2020.

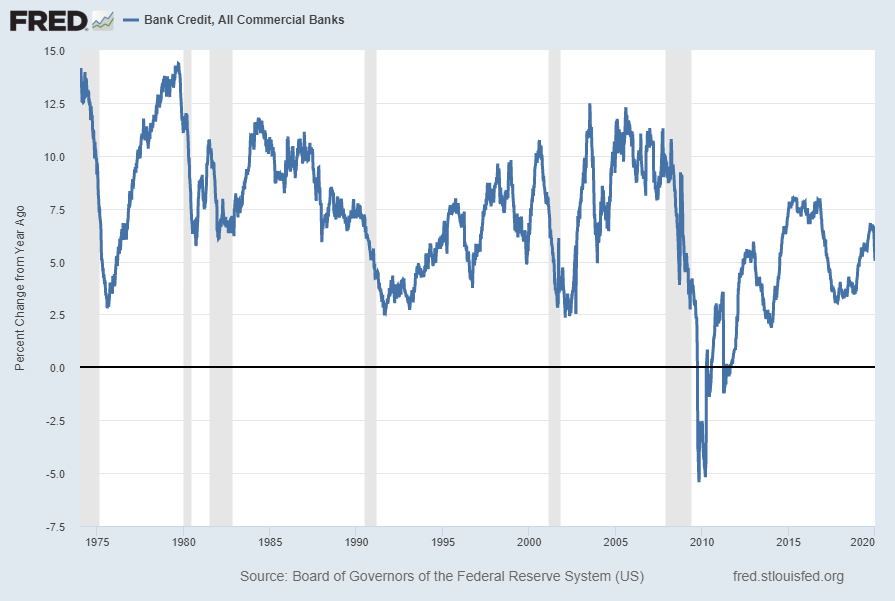
Bank Credit – All Commercial Banks (% Change from Year Ago)(last updated January 10, 2020):

Bank Credit - All Commercial Banks Percent Change From Year Ago
Board of Governors of the Federal Reserve System (US), Bank Credit of All Commercial Banks [TOTBKCR], retrieved from FRED, Federal Reserve Bank of St. Louis https://research.stlouisfed.org/fred2/series/TOTBKCR/, January 15, 2020.

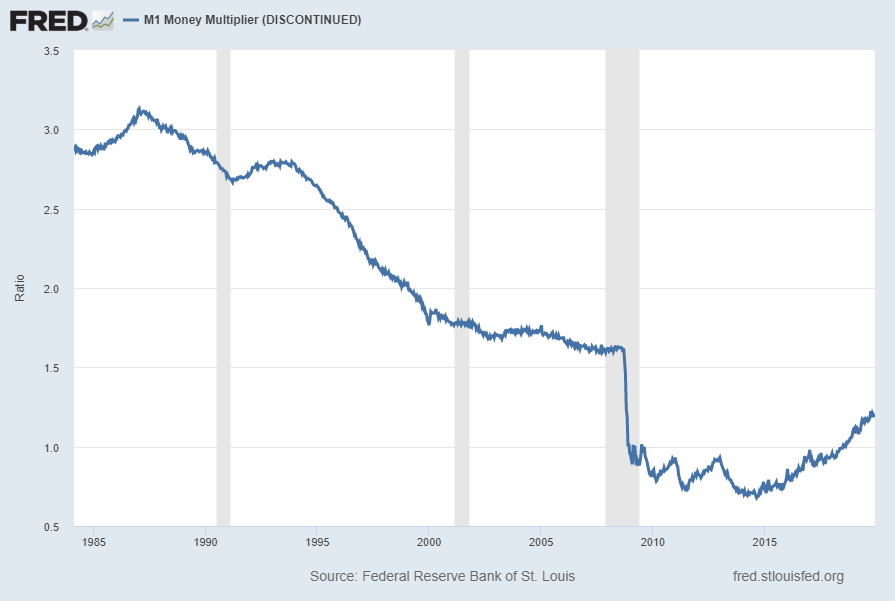
M1 Money Multiplier (last updated December 12, 2019):

M1 Money Multiplier
Federal Reserve Bank of St. Louis, M1 Money Multiplier [MULT], retrieved from FRED, Federal Reserve Bank of St. Louis https://research.stlouisfed.org/fred2/series/MULT/, January 15, 2020.

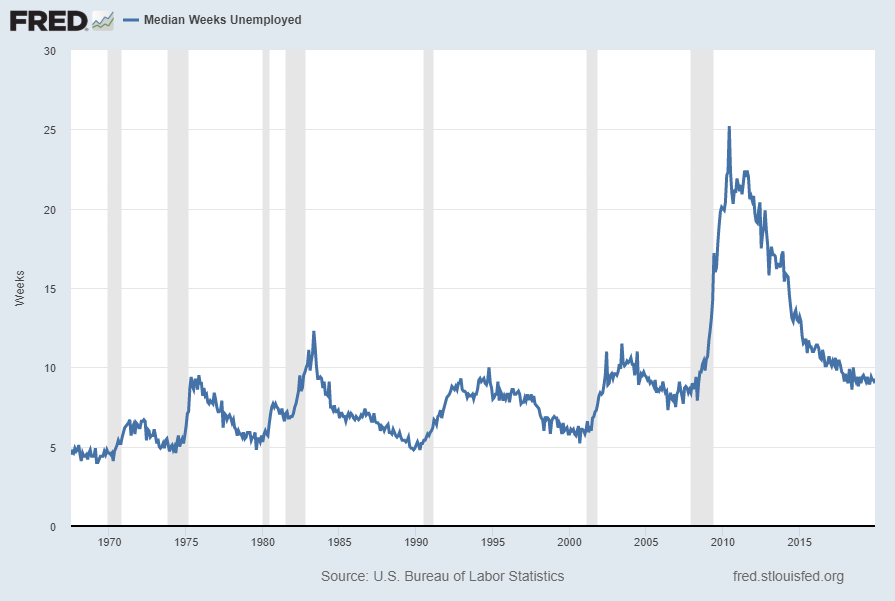
Median Duration of Unemployment (last updated January 10, 2020):

Median Duration of Unemployment
US. Bureau of Labor Statistics, Median Duration of Unemployment [UEMPMED], retrieved from FRED, Federal Reserve Bank of St. Louis https://research.stlouisfed.org/fred2/series/UEMPMED/, January 15, 2020.

Labor Force Participation Rate (last updated January 10, 2020):

Labor Force Participation Rate
US. Bureau of Labor Statistics, Civilian Labor Force Participation Rate [CIVPART], retrieved from FRED, Federal Reserve Bank of St. Louis https://research.stlouisfed.org/fred2/series/CIVPART/, January 15, 2020.

The Chicago Fed National Activity Index (CFNAI) 3-month moving average (CFNAI-MA3)(last updated December 23, 2019):

Chicago Fed National Activity Index 3-Month Moving Average
Federal Reserve Bank of Chicago, Chicago Fed National Activity Index: Three Month Moving Average [CFNAIMA3], retrieved from FRED, Federal Reserve Bank of St. Louis https://research.stlouisfed.org/fred2/series/CFNAIMA3/, January 15, 2020.
I will continue to update these charts on an intermittent basis as they deserve close monitoring…
_____
The Special Note summarizes my overall thoughts about our economic situation
SPX at 3289.29 as this post is written