On Wednesday, December 15, 2021 FOMC Chairman Jerome Powell gave his scheduled December 2021 FOMC Press Conference. (link of video and related materials)
Below are Jerome Powell’s comments I found most notable – although I don’t necessarily agree with them – in the order they appear in the transcript. These comments are excerpted from the “Transcript of Chairman Powell’s Press Conference“ (preliminary)(pdf) of December 15, 2021, with the accompanying “FOMC Statement” and “Summary of Economic Projections” dated December 15, 2021.
Excerpts from Chairman Powell’s opening comments:
Supply and demand imbalances related to the pandemic and the reopening of the economy have continued to contribute to elevated levels of inflation. In particular, bottlenecks and supply constraints are limiting how quickly production can respond to higher demand in the near term. These problems have been larger and longer lasting than anticipated, exacerbated by waves of the virus. As a result, overall inflation is running well above our 2 percent longer-run goal and will likely continue to do so well into next year. While the drivers of higher inflation have been predominantly connected to the dislocations caused by the pandemic, price increases have now spread to a broader range of goods and services. Wages have also risen briskly, but thus far, wage growth has not been a major contributor to the elevated levels of inflation. We are attentive to the risks that persistent real wage growth in excess of productivity could put upward pressure on inflation. Like most forecasters, we continue to expect inflation to decline to levels closer to our 2 percent longer-run goal by the end of next year. The median inflation projection of FOMC participants falls from 5.3 percent this year to 2.6 percent next year; this trajectory is notably higher that projected in September.
also:
At today’s meeting, the Committee also decided to double the pace of reductions in its asset purchases. Beginning in mid-January, we will reduce the monthly pace of our net asset purchases by $20 billion for Treasury securities and $10 billion for agency mortgage-backed securities. If the economy evolves broadly as expected, similar reductions in the pace of net asset purchases will likely be appropriate each month, implying that increases in our securities holdings would cease by mid-March, a few months sooner than we anticipated in early November. We are phasing out our purchases more rapidly because with elevated inflation pressures and a rapidly strengthening labor market, the economy no longer needs increasing amounts of policy support. In addition, a quicker conclusion of our asset purchases will better position policy to address the full range of plausible economic outcomes. We remain prepared to adjust the pace of purchases if warranted by changes in the economic outlook. And even after our balance sheet stops expanding, our holdings of securities will continue to foster accommodative financial conditions.
Excerpts of Jerome Powell’s responses as indicated to various questions:
RACHEL SIEGEL. Thank you very much, Michelle. And thank you, Chair Powell, for taking our questions. The latest FOMC materials say that the FOMC thinks it will be appropriate to keep rates near zero until labor market conditions reach levels consistent with maximum employment. And there are also three rate hikes penciled in the projections for next year. In order to set up those hikes, what will maximum employment have to look like? When will you know that that threshold has been met? And how will that be communicated? Thank you.
CHAIR POWELL. So maximum employment, if you look at our statement of longer-run goals in monetary policy strategy, maximum employment it — is something that we look at a broad range of indicators. And those would include, of course, things like the unemployment rate, the labor force participation rate, job openings, wages, flows in and out of the labor force in various parts of the labor force. We’d also tend to look broadly and inclusively at different demographic groups and not just at the headline and aggregate numbers. So that’s a judgment for the Committee to make. The Committee will make a judgement that we’ve achieved labor market conditions consistent with maximum employment when it makes that it is admittedly a judgment call because it’s a range of factors, unlike inflation, where we have one number that sort of dominates. It’s a broad range of things. So, as I mentioned in my opening remarks, in my view, we are making rapid progress toward maximum employment. And you see that in — of course, in some of the factors that I mentioned.
STEVE LIESMAN. All right. Thank you, Mr. Chairman. My question is if — It’s often said that monetary policy has long and variable lags, how does continuing to buy assets now, even though it’s at a slower pace, address the current inflation problem? Won’t the impact of today’s changes not really have any impact for six months or a year down the road on the current inflation problem? Aren’t you actually lengthening that time by continuing to buy assets such that it could be not until the long and variable lag after you end purchases sometime in March, that you will start to have any impact on the inflation problem?
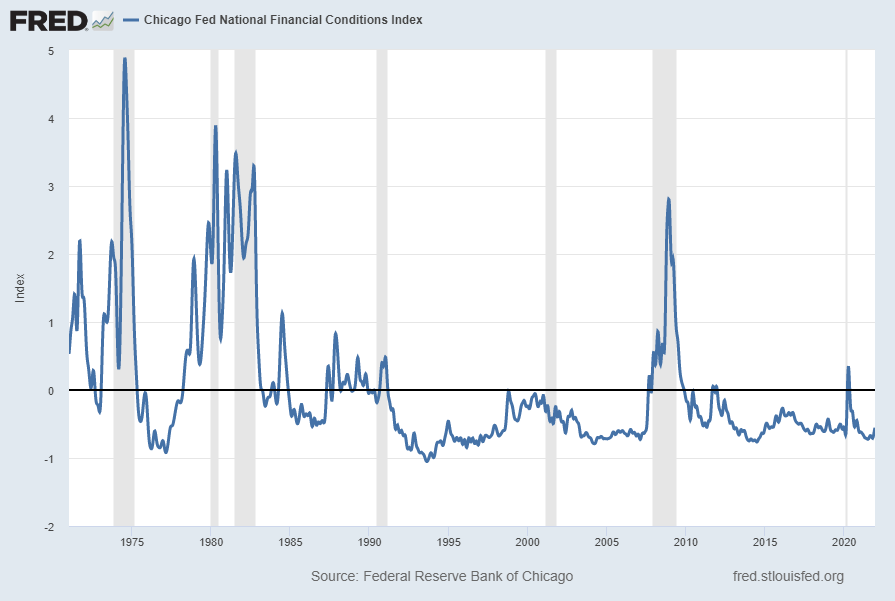
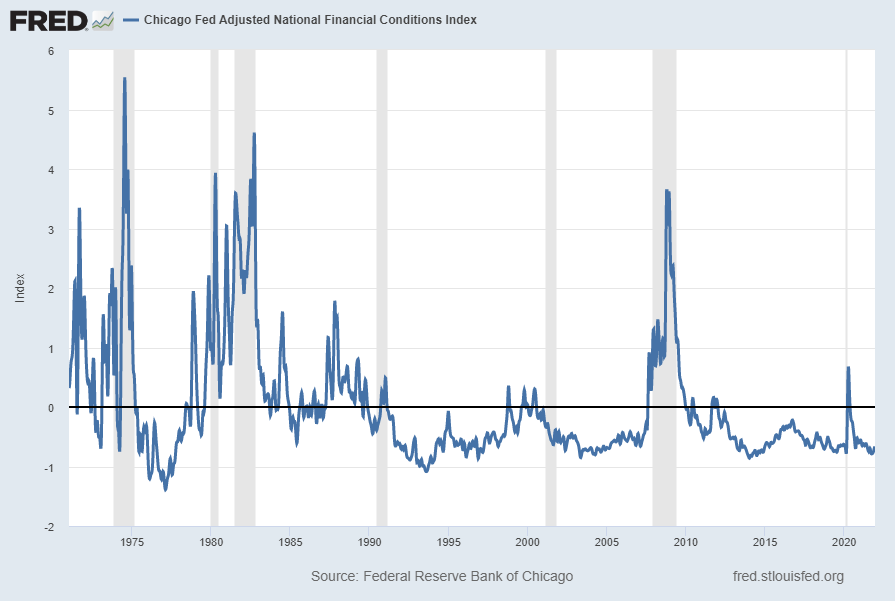
CHAIR POWELL. So, on the first part of your question, which is, why not stop purchasing now, I would just say this, we’ve learned that we’re — in dealing with balance sheet issues, we’ve learned that it’s best to take a careful sort of methodical approach to make adjustments. Markets can be sensitive to it. And we thought that this was a doubling of the speed. We’ll — We’re basically two meetings away now from finishing the taper. And we thought that was the appropriate way to go. So we announced it and that’s what will happen. You know, the question of long and variable lags is an interesting one. That’s Milton Friedman’s famous statement. And I do think that in this world where everything is — or the global financial connect — markets are connected together, financial conditions can change very quickly. And my own sense is that they get into — financial conditions affect the economy fairly rapidly, longer than the traditional thought of, you know, a year or 18 months. Shorter than that, rather. But in addition, when we communicate about what we’re going to do, the markets move immediately to that. So, financial conditions are changing to reflect, you know, the forecasts that we made and — basically, which was, I think, fairly in line with what markets were expecting. But financial conditions don’t wait to change until things actually happen. They change on the expectation of things happening. So, I don’t think it’s a question of having to wait.
STEVE LIESMAN. Can I just follow up, thinking about having to wait, is it still the policy or the position of the Committee that you will not raise rates until the taper is complete? Thank you.
CHAIR POWELL. Yes. I — The sense of that, of course, being that buying assets is adding accommodation and raising rates is removing accommodation. Since we’re two meetings away from completing the taper, assuming things go as expected, I think if we wanted to lift off before then, then what we — you would stop the taper potentially sooner, but it’s not something I expect to happen. But I do not think it would be appropriate and we don’t find ourselves in a situation where we might have to raise rates while we — while we’re still purchasing assets.
also:
OLIVIA ROCKEMAN. And just to quickly follow up on that, if some of the reason that labor force participation isn’t back to, you know, February 2020 levels, because people are voluntarily making life decisions that are different, does that make you think we’re going to end up at a lower rate overall?
CHAIR POWELL. Well, there’s a demographic trend underlying all of this. And we actually got above the demographic trend at the end of the last expansion. But — So one would expect over time that labor force participation would move down because in aging population, the older people are, the lower their participation rate is. So, you would expect that the trend would be lower and that, over time, participation would move down. The question of how much we can get back up closer to where we were in February of 2020 and, indeed, for the year or so before that is a good one. And — I mean, I — But what we can do is try to create the conditions, there’s a lot of good for society when you have a tight but stable labor market, where people are coming in, they’re getting into labor force, they’re getting paid well. In the labor market we had before, we had, you know, the biggest wage increases, we’re going to people at the bottom end of the wage spectrum for the last couple of years. There were just a lot of really desirable aspects of a labor market like that higher participation is one of them. And we’d love to get back there. But, again, ultimately, we have the tools that we have, which are essentially to stimulate demand and also to control inflation. I mean, really, it might be — One of the two big threats to getting back to maximum employment is actually high inflation, because to get back to where we were, the evidence grows that it’s going to take some time. And what we need is another long expansion like the ones we’ve been having over the last 40 years. We’ve had, I think, three of the four longest in our recorded history, including the last one, which was the longest in our recorded history. That’s what it would really take to get back to the kind of labor market we’d like to see. And to have that happen, we need to make sure that we maintain price stability.
also:
MICHAEL DERBY. Yeah. Thanks for taking my question. So, as the Fed shifts towards an accelerated taper, I wonder what your read is on financial stability risks right now. I mean, these periods can be, you know, seems like the taper process has gone fairly smooth so far. But, you know, what do you see in terms of stability risks? Are there any parts of the financial sector that concern you right now? And are there any significant systemic issues that are on your radar, you know, maybe from the cryptocurrency sector or something like that?
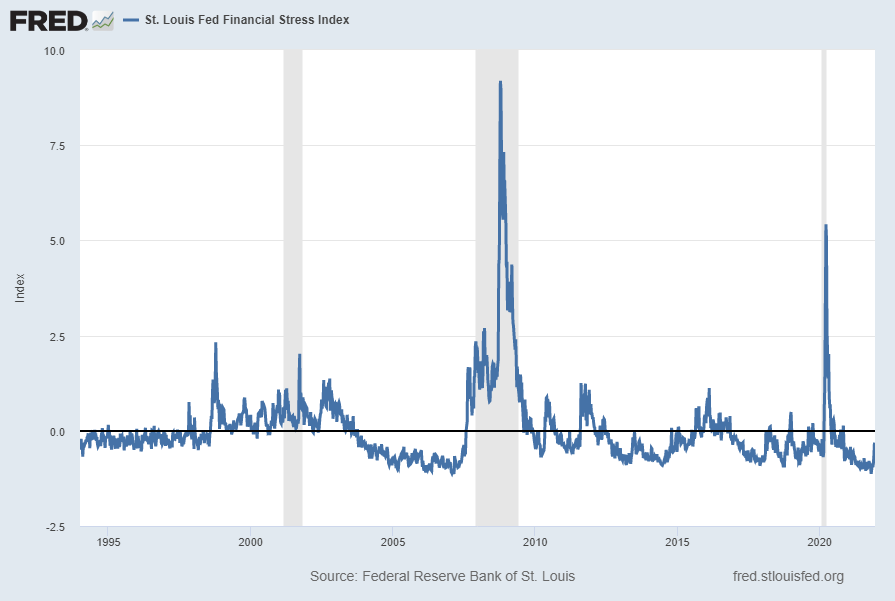
CHAIR POWELL. You know, we have had now for a decade and more four-part financial stability framework that we use, so we can hold ourselves to the same kind of framework and, you know, not just treat each event individually. And there are four key areas, asset valuations, debt owed by households and businesses, funding risk, and leverage among financial institutions. So I would say asset valuation — So I’m going to go really superficially here, but asset valuations are somewhat elevated, I would say. Debt owed by businesses, you know, and households, households are in very strong financial shape. Businesses actually have a lot of debt, but their default rates are very, very low. But nonetheless, it’s something we’re watching. Funding risk is, by and large, low among financial institutions, but we do see money market funds as a vulnerability and, you know, would applaud the SEC’s action this week. Leverage among financial institutions is low in the sense that capital is high. So, overall, you know, financial stability, that’s how I would make an overall characteristic that we break it down into those pieces. In terms of the things, you know, that we’re looking for — looking at, you know, the — it’s the things we’ve already talked about, to some extent, it’s the emergence of a new variant that could — you know, that could lead to significant economic. If it were — If there were to be a variant, for example, that were quite resistant to vaccines, it could have another significant effect on the economy. We don’t see that. We don’t have any basis for thinking that the new variant that we have is that one, but it’s certainly one we’re looking at. I would say, you know, cyber risk, the risk of a successful cyberattack is, for me, you know, always the most, you know, one that we would be very difficult to deal with. I think we know how to deal with bad loans and things like that. I think more — a cyberattack that we’re to take down a major financial institution or financial market utility would be a really significant financial stability risk that we haven’t actually faced yet. So, I could go on with list of horribles, but I think that’s a decent picture of where I would start.
also:
NANCY MARSHALL-GENZER. Chair Powell — Hi, Chair Powell, thanks for the question. Going back to inflation, is the Fed behind the curve on getting inflation under control?
CHAIR POWELL. So, I would say this, I actually think we are well positioned to deal with what’s coming, with the range of plausible outcomes that can come. I do. And I think if you look at how we got here, I do think we’ve been adapting to the incoming data, really, all the way along. And, you know, noticing and calling out that the — both the effects and the persistence of inflation of bottlenecks, and labor shortages and things like that. So, we’ve been calling out the fact that those were becoming longer and more persistent and larger. And now we’re in a position where we’re ending our taper within the next — well, by March in two meetings, and we’ll be in a position to raise interest rates as and when we think it’s appropriate. And we will, if that — to the extent, that’s appropriate. At the same time, we’re going to be seeing a few more months of data. I don’t actually think we’re out of position now. I think this was an important move for us to make. I think that the data that we got toward the end of the Fall was a really strong signal that inflation is more persistent and higher, and that the risk of it remaining higher for longer has grown. And I think we’re reacting to that now and we’ll continue to adapt our policy, so I wouldn’t look at it that we’re behind the curve. I would look at it that we’re actually in position now to take the steps that we’ll need to take, you know, in a thoughtful manner to address all of the issues, including that of too-high inflation.
_____
_____
The Special Note summarizes my overall thoughts about our economic situation
SPX at 4683.39 as this post is written