Tuesday, July 26, 2022

Money Supply Charts Through June 2022

For reference purposes, below are two sets of charts depicting growth in the money supply.

The first shows the M1, defined in FRED as the following:

Before May 2020, M1 consists of (1) currency outside the U.S. Treasury, Federal Reserve Banks, and the vaults of depository institutions; (2) demand deposits at commercial banks (excluding those amounts held by depository institutions, the U.S. government, and foreign banks and official institutions) less cash items in the process of collection and Federal Reserve float; and (3) other checkable deposits (OCDs), consisting of negotiable order of withdrawal, or NOW, and automatic transfer service, or ATS, accounts at depository institutions, share draft accounts at credit unions, and demand deposits at thrift institutions.

Beginning May 2020, M1 consists of (1) currency outside the U.S. Treasury, Federal Reserve Banks, and the vaults of depository institutions; (2) demand deposits at commercial banks (excluding those amounts held by depository institutions, the U.S. government, and foreign banks and official institutions) less cash items in the process of collection and Federal Reserve float; and (3) other liquid deposits, consisting of OCDs and savings deposits (including money market deposit accounts). Seasonally adjusted M1 is constructed by summing currency, demand deposits, and OCDs (before May 2020) or other liquid deposits (beginning May 2020), each seasonally adjusted separately.

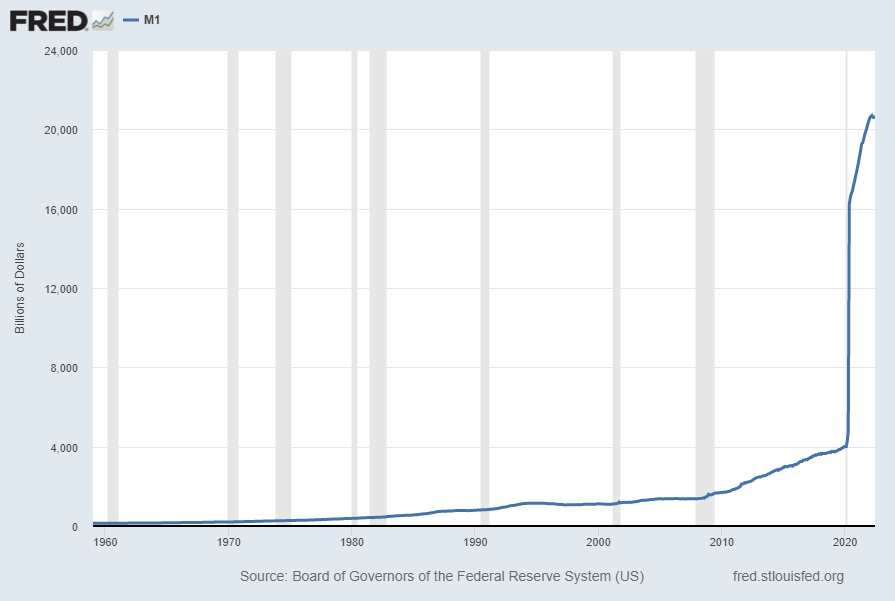
Here is the “M1 Money Stock” (seasonally adjusted) chart, updated on July 26, 2022 depicting data through June 2022, with a value of $20,545.4 Billion:
M1SL

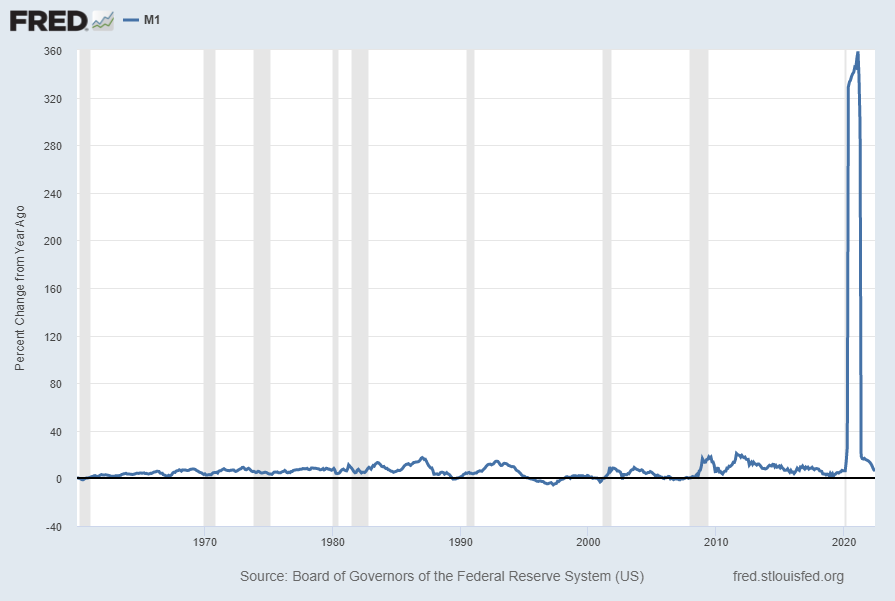
Here is the “M1 Money Stock” chart on a “Percent Change From Year Ago” basis, with a current value of 6.3%:
M1SL Percent Change From Year Ago

Data Source: Board of Governors of the Federal Reserve System (US), M1 Money Stock [M1SL], retrieved from FRED, Federal Reserve Bank of St. Louis; accessed July 26, 2022: https://fred.stlouisfed.org/series/M1SL

The second set shows M2, defined in FRED as the following:

Before May 2020, M2 consists of M1 plus (1) savings deposits (including money market deposit accounts); (2) small-denomination time deposits (time deposits in amounts of less than $100,000) less individual retirement account (IRA) and Keogh balances at depository institutions; and (3) balances in retail money market funds (MMFs) less IRA and Keogh balances at MMFs.

Beginning May 2020, M2 consists of M1 plus (1) small-denomination time deposits (time deposits in amounts of less than $100,000) less IRA and Keogh balances at depository institutions; and (2) balances in retail MMFs less IRA and Keogh balances at MMFs. Seasonally adjusted M2 is constructed by summing savings deposits (before May 2020), small-denomination time deposits, and retail MMFs, each seasonally adjusted separately, and adding this result to seasonally adjusted M1.

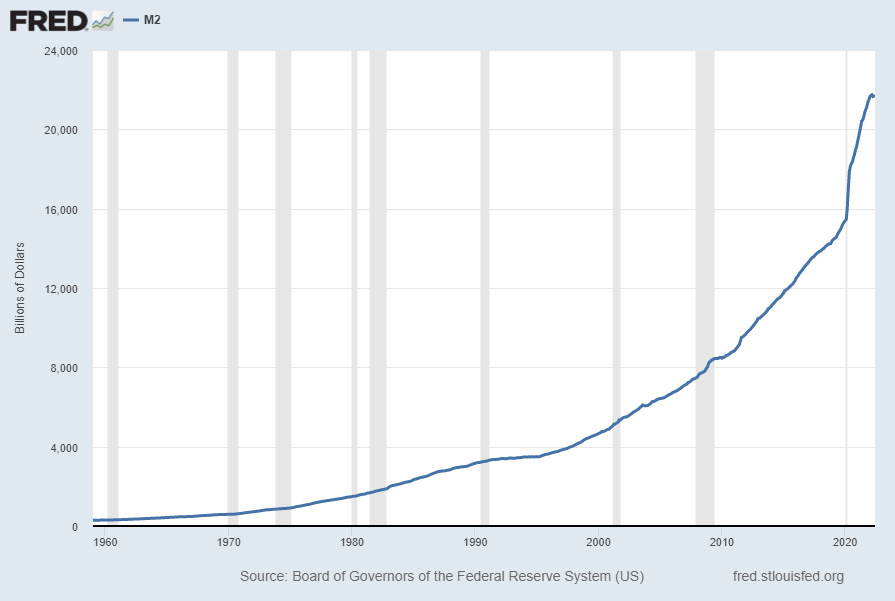
Here is the “M2 Money Stock” (seasonally adjusted) chart, updated on July 26, 2022, depicting data through June 2022, with a value of $21,667.5 Billion:
M2SL

Here is the “M2 Money Stock” chart on a “Percent Change From Year Ago” basis, with a current value of 5.9%:
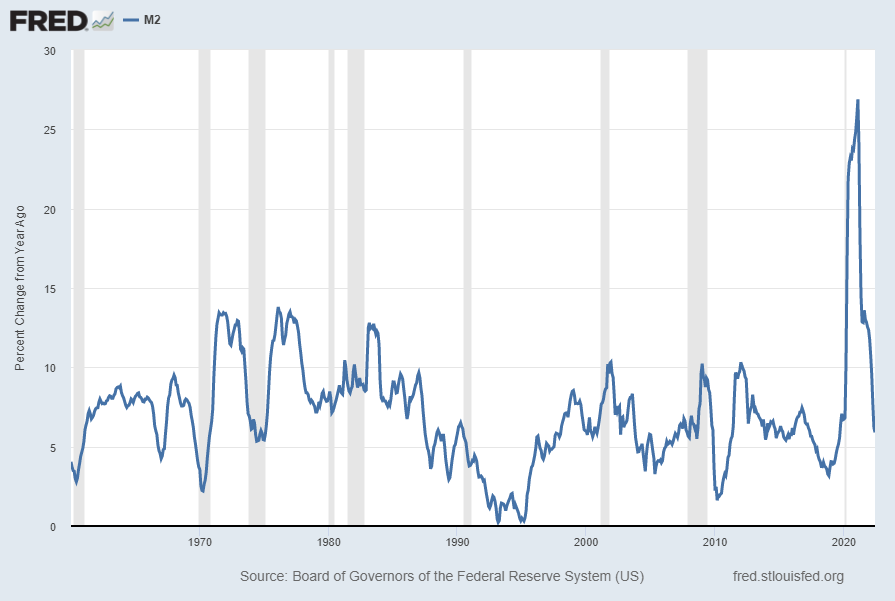
M2SL Percent Change From Year Ago

Data Source: Board of Governors of the Federal Reserve System (US), M2 Money Stock [M2SL], retrieved from FRED, Federal Reserve Bank of St. Louis; accessed July 26, 2022: https://fred.stlouisfed.org/series/M2SL

_____

The Special Note summarizes my overall thoughts about our economic situation

SPX at 3927.08 as this post is written

Monday, July 25, 2022

Updates Of Economic Indicators July 2022

The following is an update of various indicators that are supposed to predict and/or depict economic activity. These indicators have been discussed in previous blog posts:

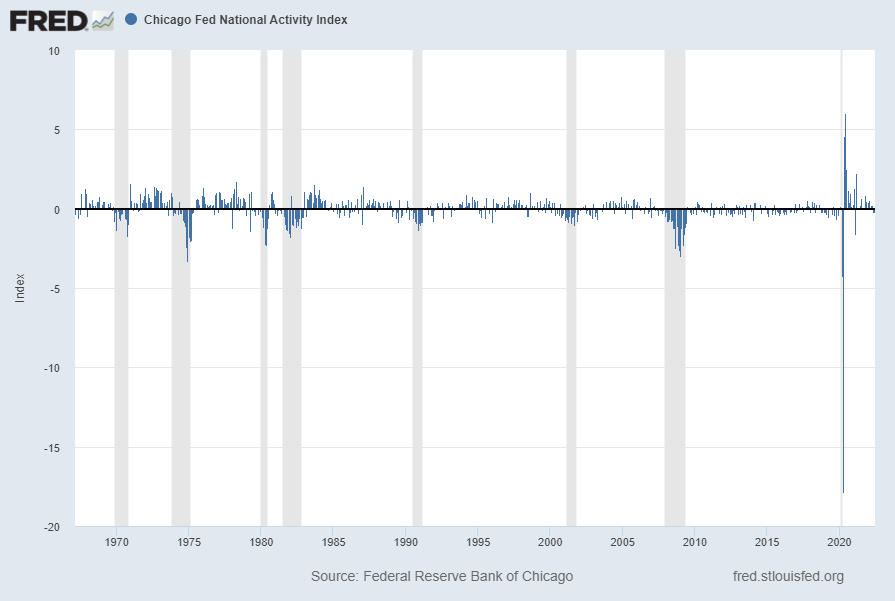
The July 2022 Chicago Fed National Activity Index (CFNAI) updated as of July 25, 2022:

The CFNAI, with a current reading of -.19:

CFNAI -.19

source:  Federal Reserve Bank of Chicago, Chicago Fed National Activity Index [CFNAI], retrieved from FRED, Federal Reserve Bank of St. Louis; accessed July 25, 2022: 
https://fred.stlouisfed.org/series/CFNAI

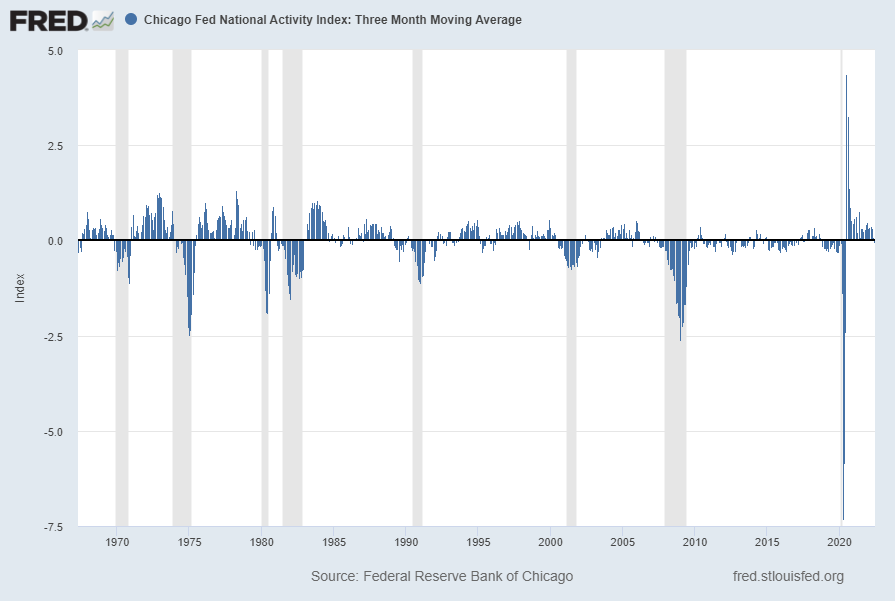
The CFNAI-MA3, with a current reading of -.04:

CFNAIMA3 -.04

source:  Federal Reserve Bank of Chicago, Chicago Fed National Activity Index: Three Month Moving Average [CFNAIMA3], retrieved from FRED, Federal Reserve Bank of St. Louis; accessed July 25, 2022: 
https://fred.stlouisfed.org/series/CFNAIMA3

–

The ECRI WLI (Weekly Leading Index):

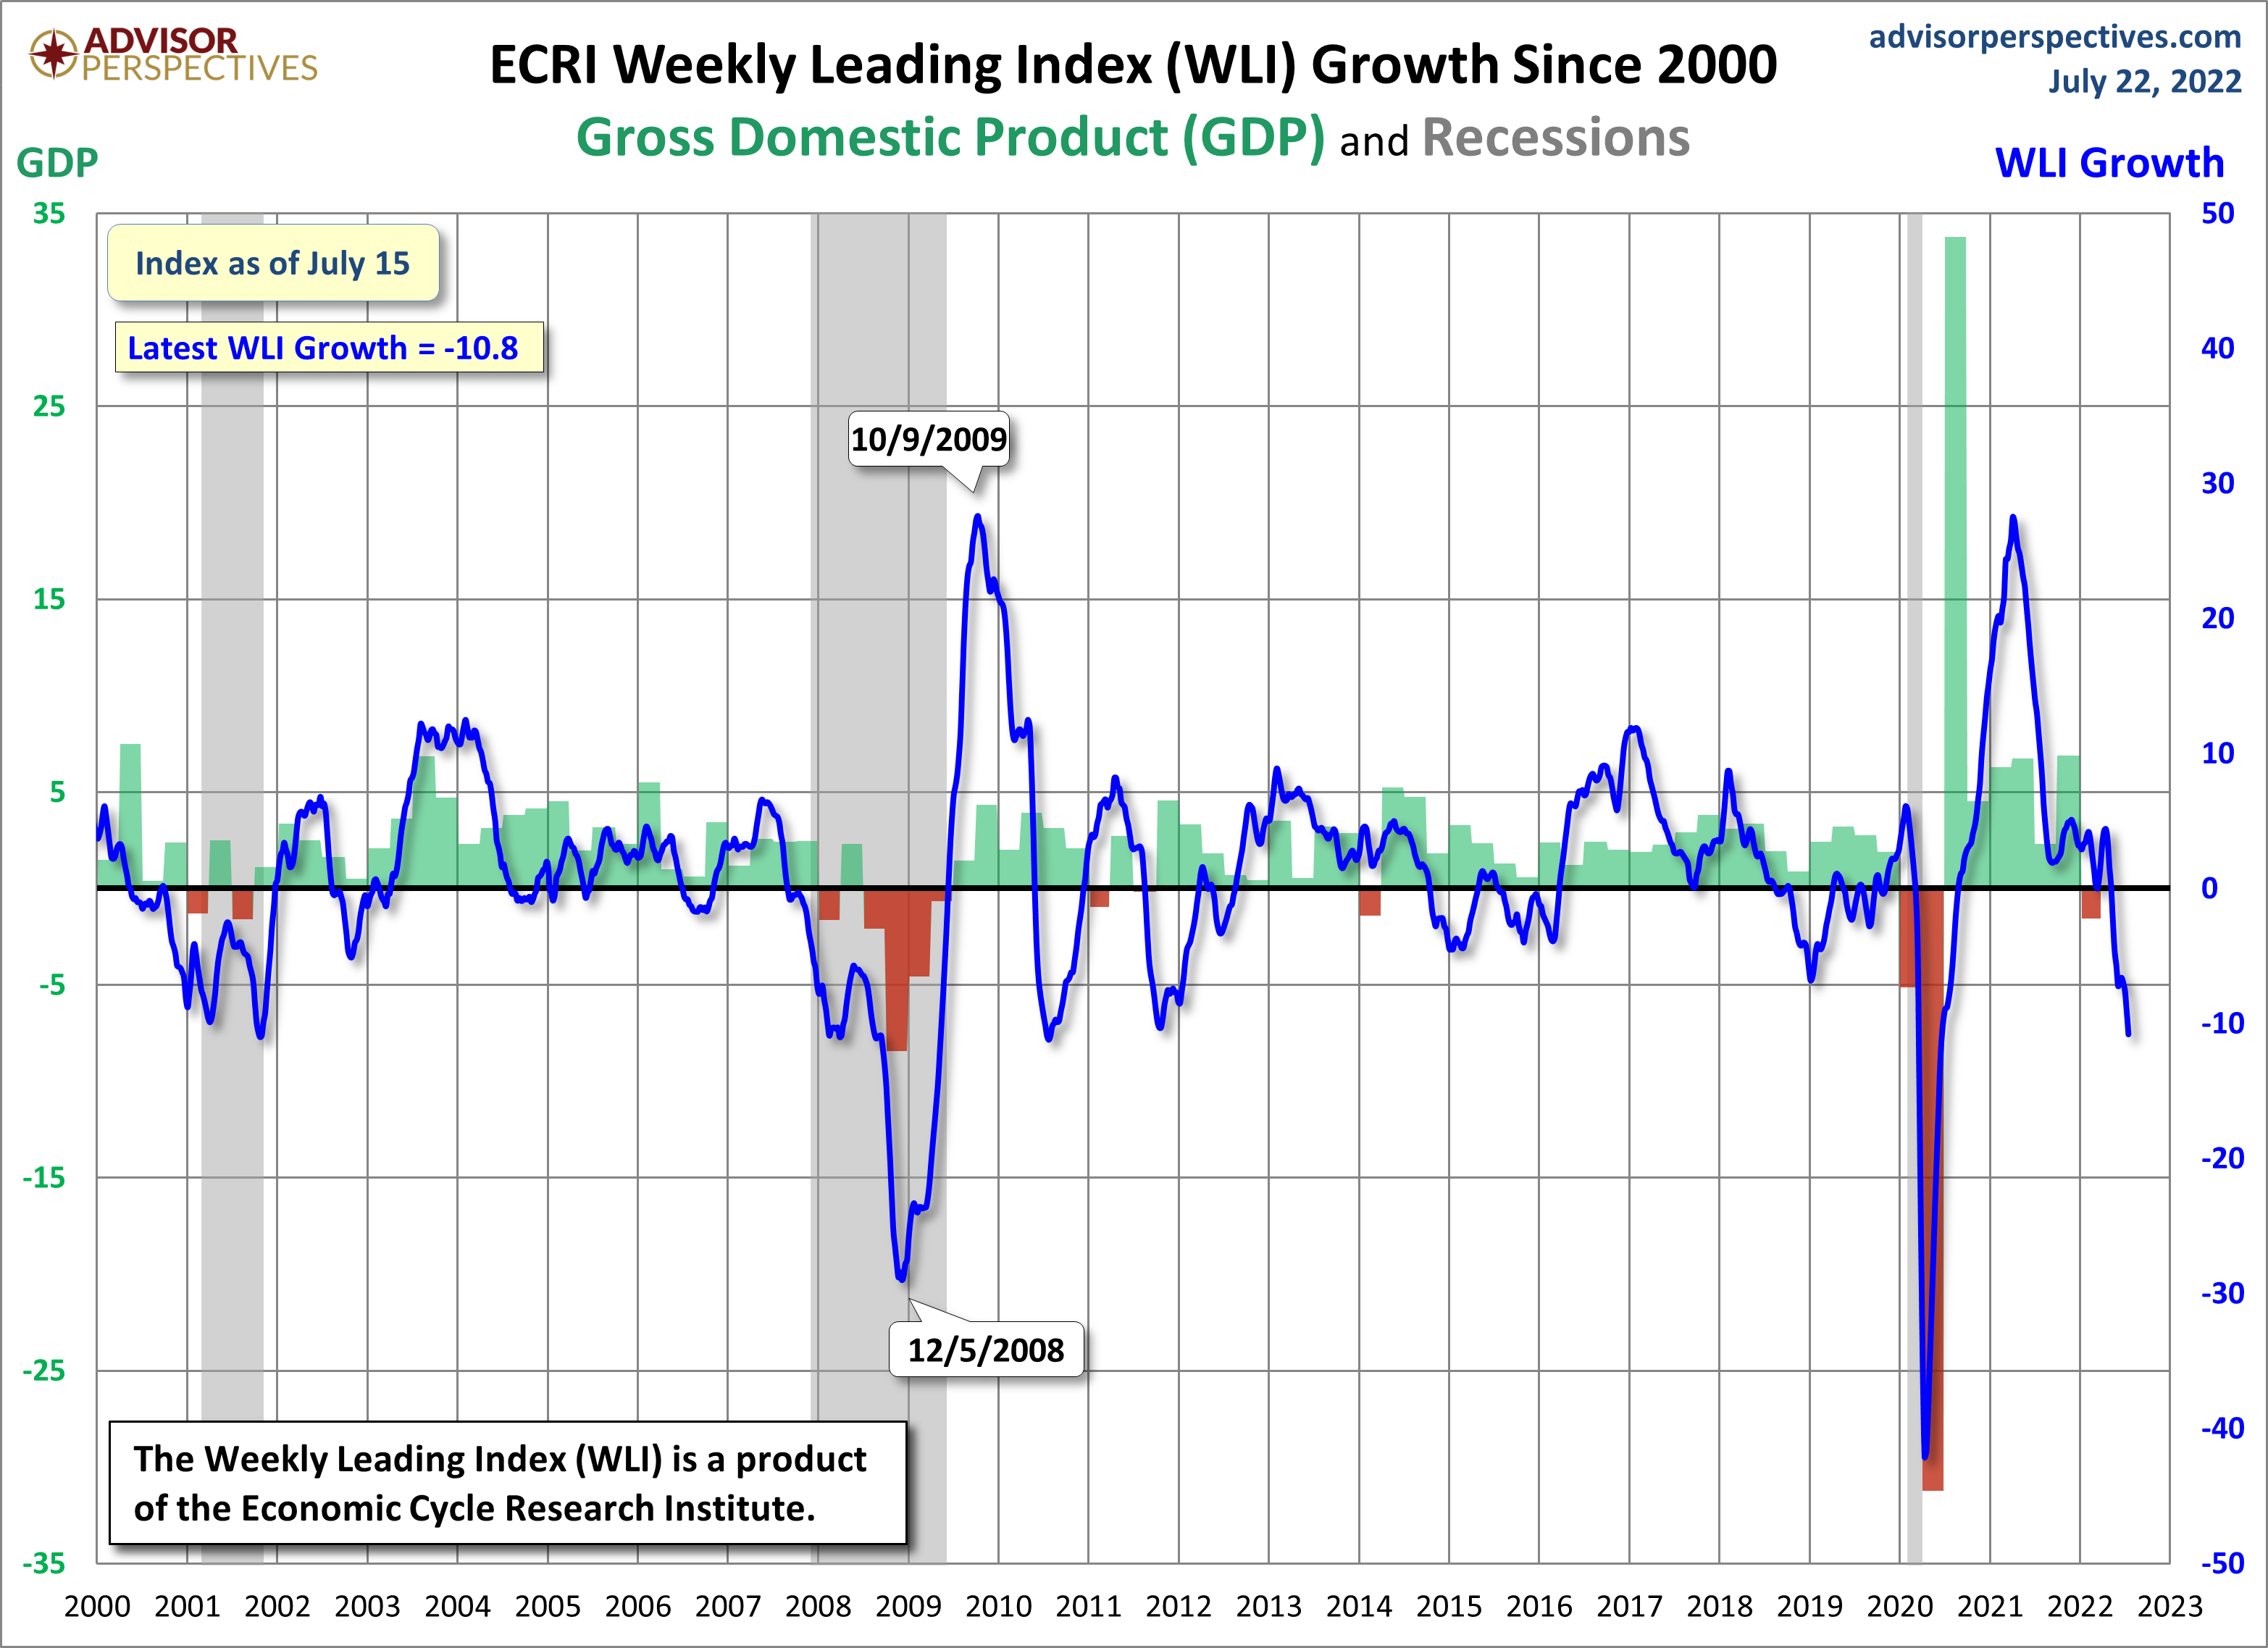
As of July 22, 2022 (incorporating data through July 15, 2022) the WLI was at 144.5 and the WLI, Gr. was at -10.8%.

A chart of the WLI,Gr., from the Advisor Perspectives’ ECRI update post of July 22, 2022:

ECRI WLI, Gr. -10.8 Percent

–

The Aruoba-Diebold-Scotti Business Conditions (ADS) Index

The ADS Index as of July 21, 2022, reflecting data from March 1, 1960 through July 16, 2022, with last value -.151012:

ADS Index -.151012

–

The Conference Board Leading Economic Index (LEI), Coincident Economic Index (CEI), and Lagging Economic Index (LAG):

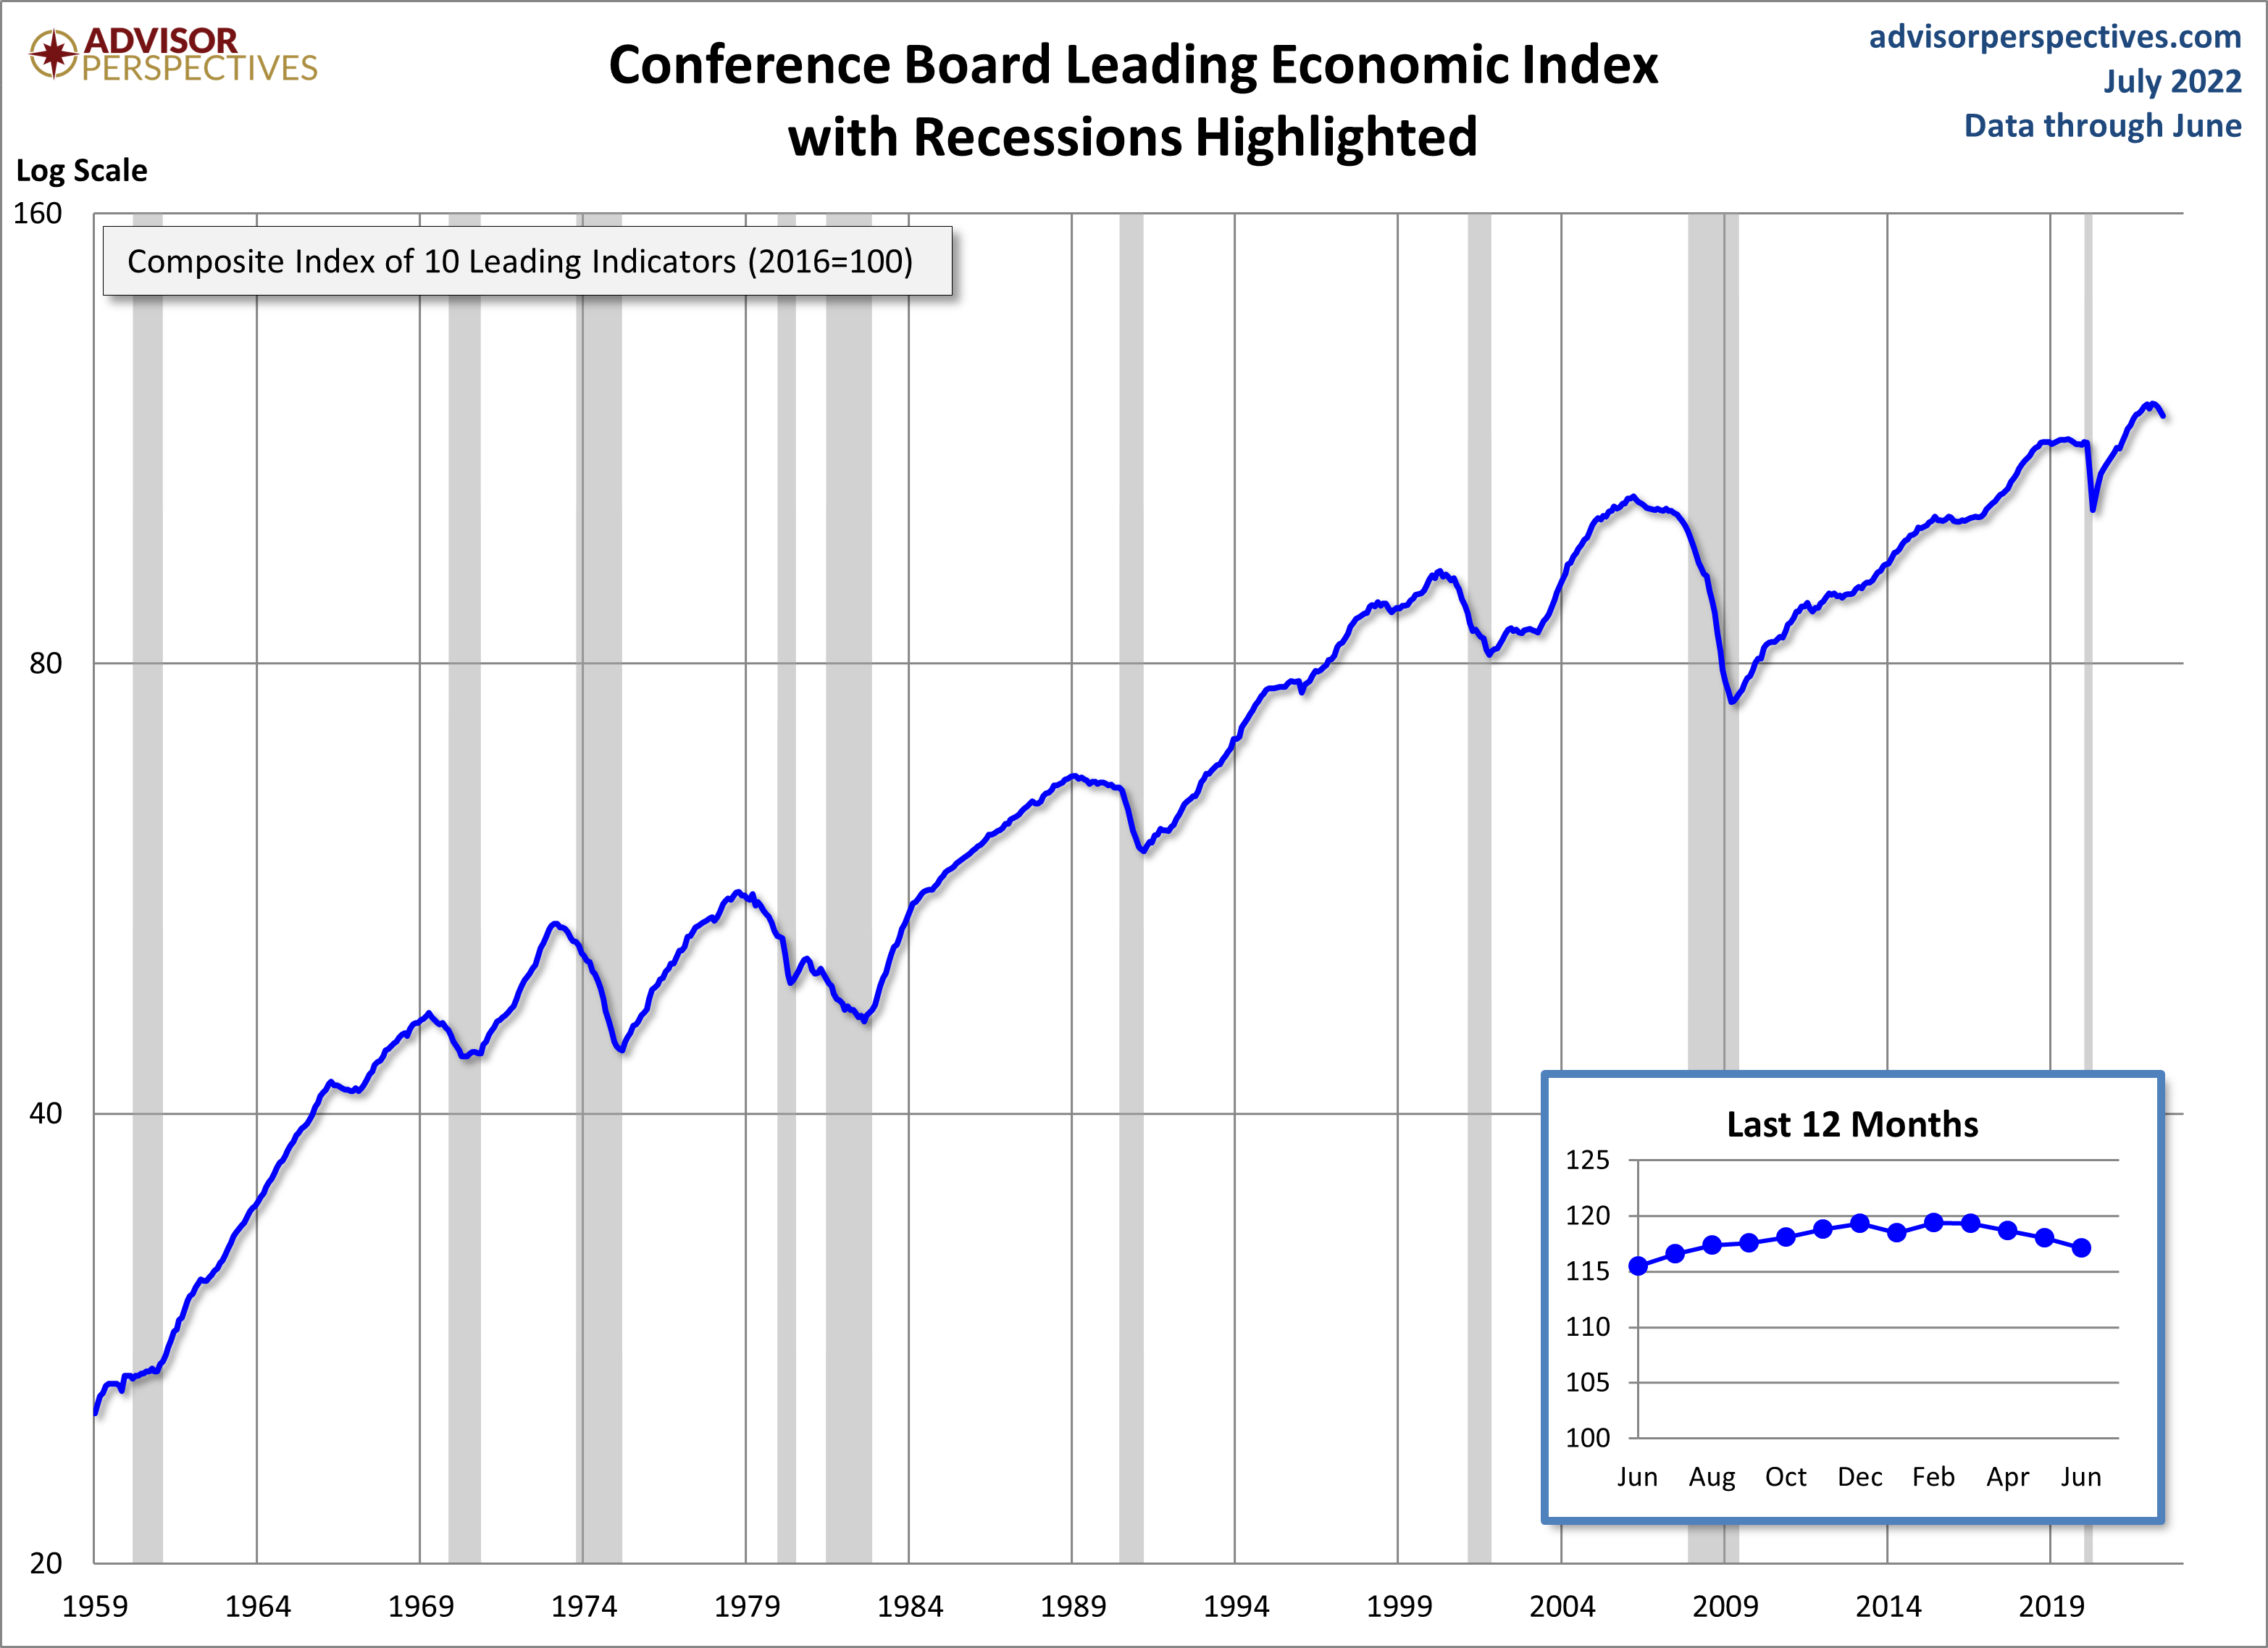
As per the July 21, 2022 Conference Board press release titled “The Conference Board LEI for the US Fell Further in June” the LEI was 117.1 in June, the CEI was 108.6 in June, and the LAG was 113.9 in June.

An excerpt from the release:

“The US LEI declined for a fourth consecutive month suggesting economic growth is likely to slow further in the near-term as recession risks grow,” said Ataman Ozyildirim, Senior Director of Economic Research at The Conference Board. “Consumer pessimism about future business conditions, moderating labor market conditions, falling stock prices, and weaker manufacturing new orders drove the LEI’s decline in June. The coincident economic index which rose in June suggests the economy grew through the second quarter. However, the forward-looking LEI points to a US economic downturn ahead.”

“Amid high inflation and rapidly tightening monetary policy, The Conference Board expects economic growth will continue to cool throughout 2022. A US recession around the end of this year and early next is now likely. Accordingly, we’ve downgraded our forecast of 2022 annual Real GDP growth to 1.7 percent year-over-year (from 2.3 percent), while 2023 growth was downgraded to 0.5 percent YOY (from 1.8 percent).”

Here is a chart of the LEI from the Advisor Perspectives’ Conference Board Leading Economic Index (LEI) update of July 21, 2022:

Conference Board LEI 117.1

_________

I post various indicators and indices because I believe they should be carefully monitored.  However, as those familiar with this site are aware, I do not necessarily agree with what they depict or imply.

_____

The Special Note summarizes my overall thoughts about our economic situation

SPX at 3965.22 as this post is written

Friday, July 22, 2022

The U.S. Economic Situation – July 22, 2022 Update

Perhaps the main reason that I write of our economic situation is that I continue to believe, based upon various analyses, that our economic situation is in many ways misunderstood.  While no one likes to contemplate a future rife with economic adversity, current and future economic problems must be properly recognized and rectified if high-quality, sustainable long-term economic vitality is to be realized.

There are an array of indications and other “warning signs” – many readily apparent – that current economic activity and financial market performance is accompanied by exceedingly perilous dynamics.
I have written extensively about this peril, including in the following:
“Building Financial Danger” (ongoing updates)
My analyses continues to indicate that the growing level of financial danger will lead to the next stock market crash that will also involve (as seen in 2008) various other markets as well.  Key attributes of this next crash is its outsized magnitude (when viewed from an ultra-long term historical perspective) and the resulting economic impact.  This next financial crash is of tremendous concern, as my analyses indicate it will lead to a Super Depression – i.e. an economy characterized by deeply embedded, highly complex, and difficult-to-solve problems.

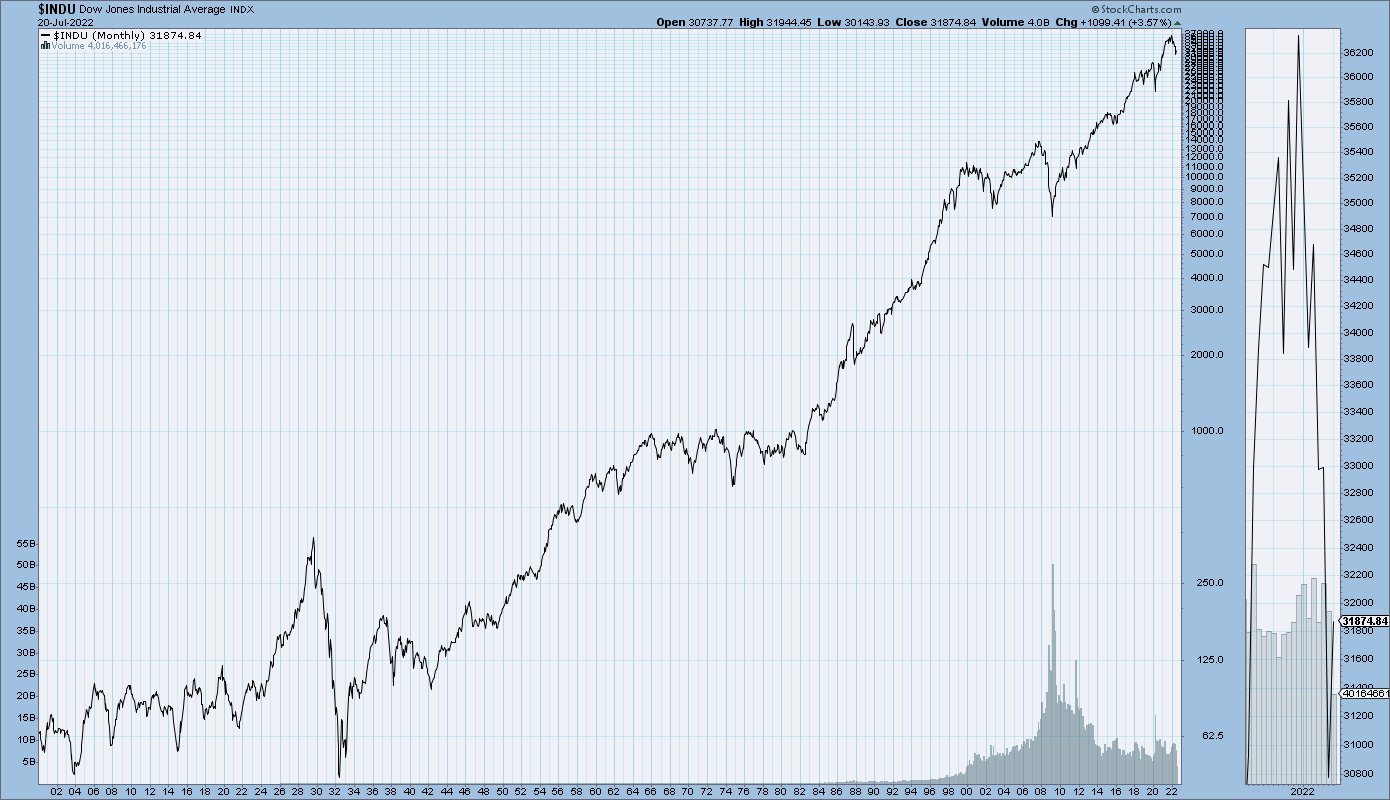
For long-term reference purposes, here is a chart of the Dow Jones Industrial Average since 1900, depicted on a monthly basis using a LOG scale (updated through July 20, 2022, with a last value of 31,874.84):

(click on chart to enlarge image)(chart courtesy of StockCharts.com)

DJIA 1900 - July 20, 2022

_____

The Special Note summarizes my overall thoughts about our economic situation

SPX at 3998.95 as this post is written

Monday, July 18, 2022

Trends Of S&P500 Earnings Forecasts

S&P500 earnings trends and estimates are a notably important topic, for a variety of reasons, at this point in time.

FactSet publishes a report titled “Earnings Insight” that contains a variety of information including the trends and expectations of S&P500 earnings.

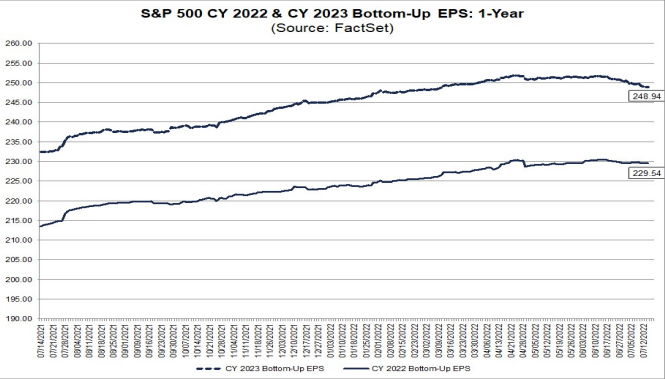
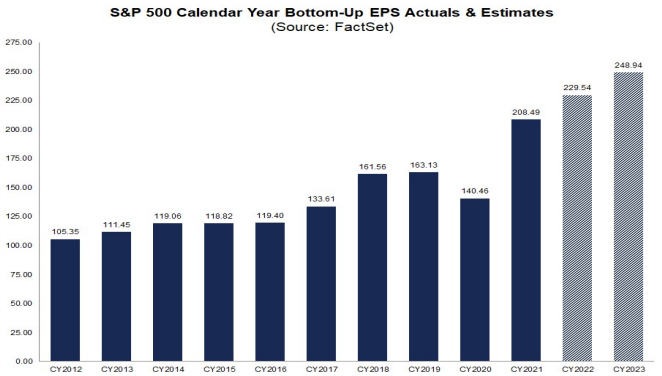
For reference purposes, here are two charts as seen in the “Earnings Insight” report of July 15, 2022:

from page 27:

(click on charts to enlarge images)

S&P500 EPS trends

from page 28:

S&P500 EPS 2012-2023

_____

I post various economic forecasts because I believe they should be carefully monitored.  However, as those familiar with this site are aware, I do not agree with many of the consensus estimates and much of the commentary in these forecast surveys.

_____

The Special Note summarizes my overall thoughts about our economic situation

SPX at 3857.85 as this post is written

2022-2024 S&P500 EPS Estimates And Prior Years’ Realized EPS

As many are aware, Refinitiv publishes earnings estimates for the S&P500.  (My other posts concerning S&P earnings estimates can be found under the S&P500 Earnings label)

The following estimates are from Exhibit 24 of the “S&P500 Earnings Scorecard” (pdf) of July 18, 2022, and represent an aggregation of individual S&P500 component “bottom up” analyst forecasts.  For reference, the Year 2014 value is $118.78/share; the Year 2015 value is $117.46/share; the Year 2016 value is $118.10/share; the Year 2017 value is $132.00/share; the Year 2018 value is $161.93/share; the Year 2019 value is $162.93/share; the Year 2020 value is $139.72/share; and the year 2021 value is $208.12:

Year 2022 estimate:

$228.35/share

Year 2023 estimate:

$248.81/share

Year 2024 estimate:

$268.44/share

_____

I post various economic forecasts because I believe they should be carefully monitored.  However, as those familiar with this site are aware, I do not agree with many of the consensus estimates and much of the commentary in these forecast surveys.

_____

The Special Note summarizes my overall thoughts about our economic situation

SPX at 3880.17 as this post is written

Standard & Poor’s S&P500 EPS Estimates 2022 – 2023 – July 14, 2022

As many are aware, Standard & Poor’s publishes earnings estimates for the S&P500.  (My posts concerning their estimates can be found under the S&P500 Earnings label)

For reference purposes, the most current estimates are reflected below, and are as of July 14, 2022:

Year 2022 estimates add to the following:

-From a “bottom up” perspective, operating earnings of $223.17/share

-From a “bottom up” perspective, “as reported” earnings of $210.03/share

Year 2023 estimates add to the following:

-From a “bottom up” perspective, operating earnings of $246.46/share

-From a “bottom up” perspective, “as reported” earnings of $230.98/share

_____

I post various economic forecasts because I believe they should be carefully monitored.  However, as those familiar with this site are aware, I do not agree with many of the consensus estimates and much of the commentary in these forecast surveys.

_____

The Special Note summarizes my overall thoughts about our economic situation

SPX at 3887.68 as this post is written

Sunday, July 17, 2022

The July 2022 Wall Street Journal Economic Forecast Survey

The July 2022 Wall Street Journal Economic Forecast Survey was published on July 17, 2022. The headline is “As Fed Tightens, Economists Worry It Will Go Too Far.”

I found numerous items to be notable – although I don’t necessarily agree with them – both within the article and in the forecasts section.

An excerpt:

Economists increasingly expect the Federal Reserve, in its efforts to push down inflation, to raise rates enough to trigger a recession, with many worrying the central bank will go too far.

Economists surveyed by The Wall Street Journal now put the chance of a recession sometime in the next 12 months at 49% in July, on average, up from 44% a month ago and just 18% in January.

Some 46% of economists said they expect the Fed to raise interest rates excessively and cause unnecessary economic weakness. Slightly fewer, 42%, said they anticipated the Fed increasing rates about the right amount to balance inflation and growth. Around 12.3% thought it would raise rates too little.

As noted above, and also seen in the “Recession Probability” section, the average response as to whether the economy will be in a recession within the next 12 months was 49%. The individual estimates, of those who responded, ranged from 1% to 99%.  For reference, the average response in June’s survey [the previously published survey] was 44%.

As stated in the article, the survey’s 62 respondents were academic, financial and business economists.  The survey was conducted July 8 – July 12. Not every economist answered every question.

–

Economic Forecasts

The current average forecasts among economists polled include the following:

GDP:

full-year 2022:  .71%

full-year 2023:  1.14%

full-year 2024:  2.05%

Unemployment Rate:

December 2022: 3.76%

December 2023: 4.28%

December 2024: 4.35%

10-Year Treasury Yield:

December 2022: 3.32%

December 2023: 3.22%

December 2024: 3.17%

CPI:

December 2022:  6.85%

December 2023:  2.93%

December 2024:  2.31%

Core PCE:

full-year 2022:  4.47%

full-year 2023:  2.93%

full-year 2024:  2.32%

(note: I have highlighted this WSJ Economic Forecast survey each time it is published; it was published monthly until April 2021, after which the survey is conducted (at least) every three months; commentary on past surveys can be found under the “Economic Forecasts” label)

_____

I post various economic forecasts because I believe they should be carefully monitored.  However, as those familiar with this site are aware, I do not necessarily agree with many of the consensus estimates and much of the commentary in these forecast surveys.

_____

The Special Note summarizes my overall thoughts about our economic situation

SPX at 3863.16 as this post is written

Friday, July 15, 2022

Long-Term Charts Of The ECRI WLI & ECRI WLI, Gr. – July 15, 2022 Update

As I stated in my July 12, 2010 post (“ECRI WLI Growth History“):

For a variety of reasons, I am not as enamored with ECRI’s WLI and WLI Growth measures as many are.

However, I do think the measures are important and deserve close monitoring and scrutiny.

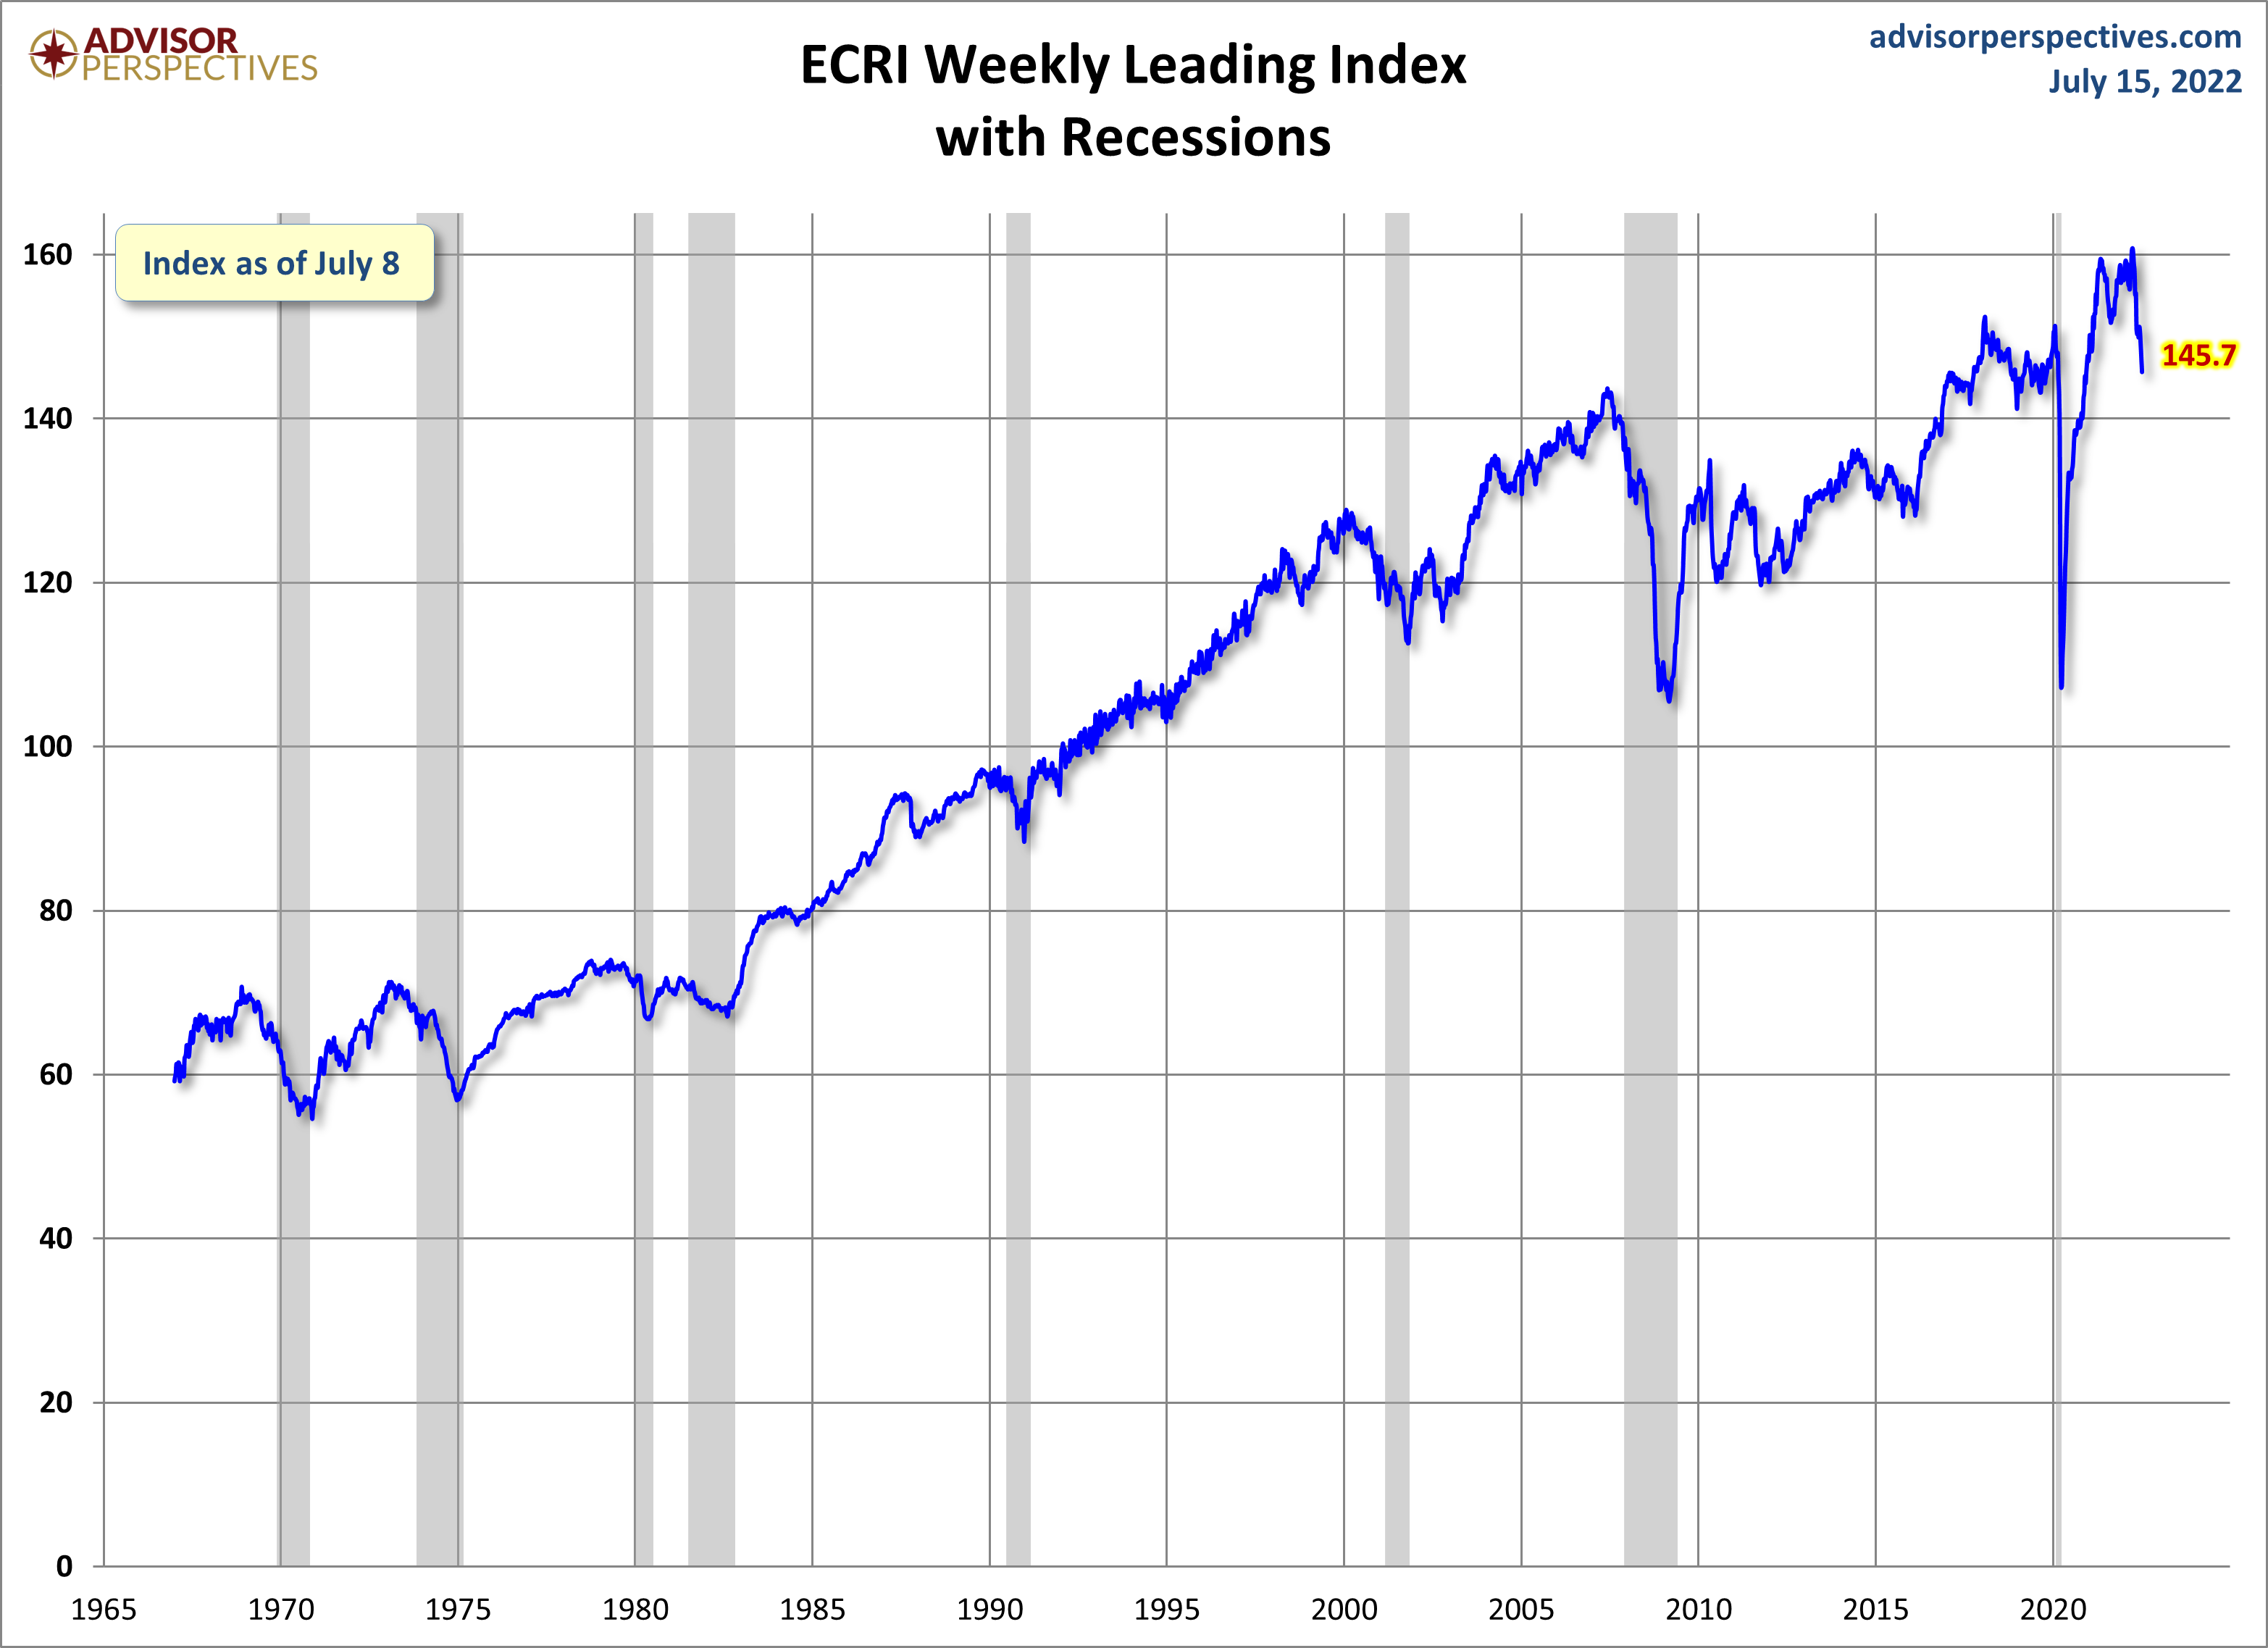
Below are three long-term charts, from Advisor Perspectives’ ECRI update post of July 15, 2022 titled “ECRI Weekly Leading Index Update.”  These charts are on a weekly basis as of the July 15, 2022 release, reflecting data through July 8, 2022.

Here is the ECRI WLI (defined at ECRI’s glossary):

ECRI WLI 145.7

–

This next chart depicts, on a long-term basis, the Year-over-Year change in the 4-week moving average of the WLI:

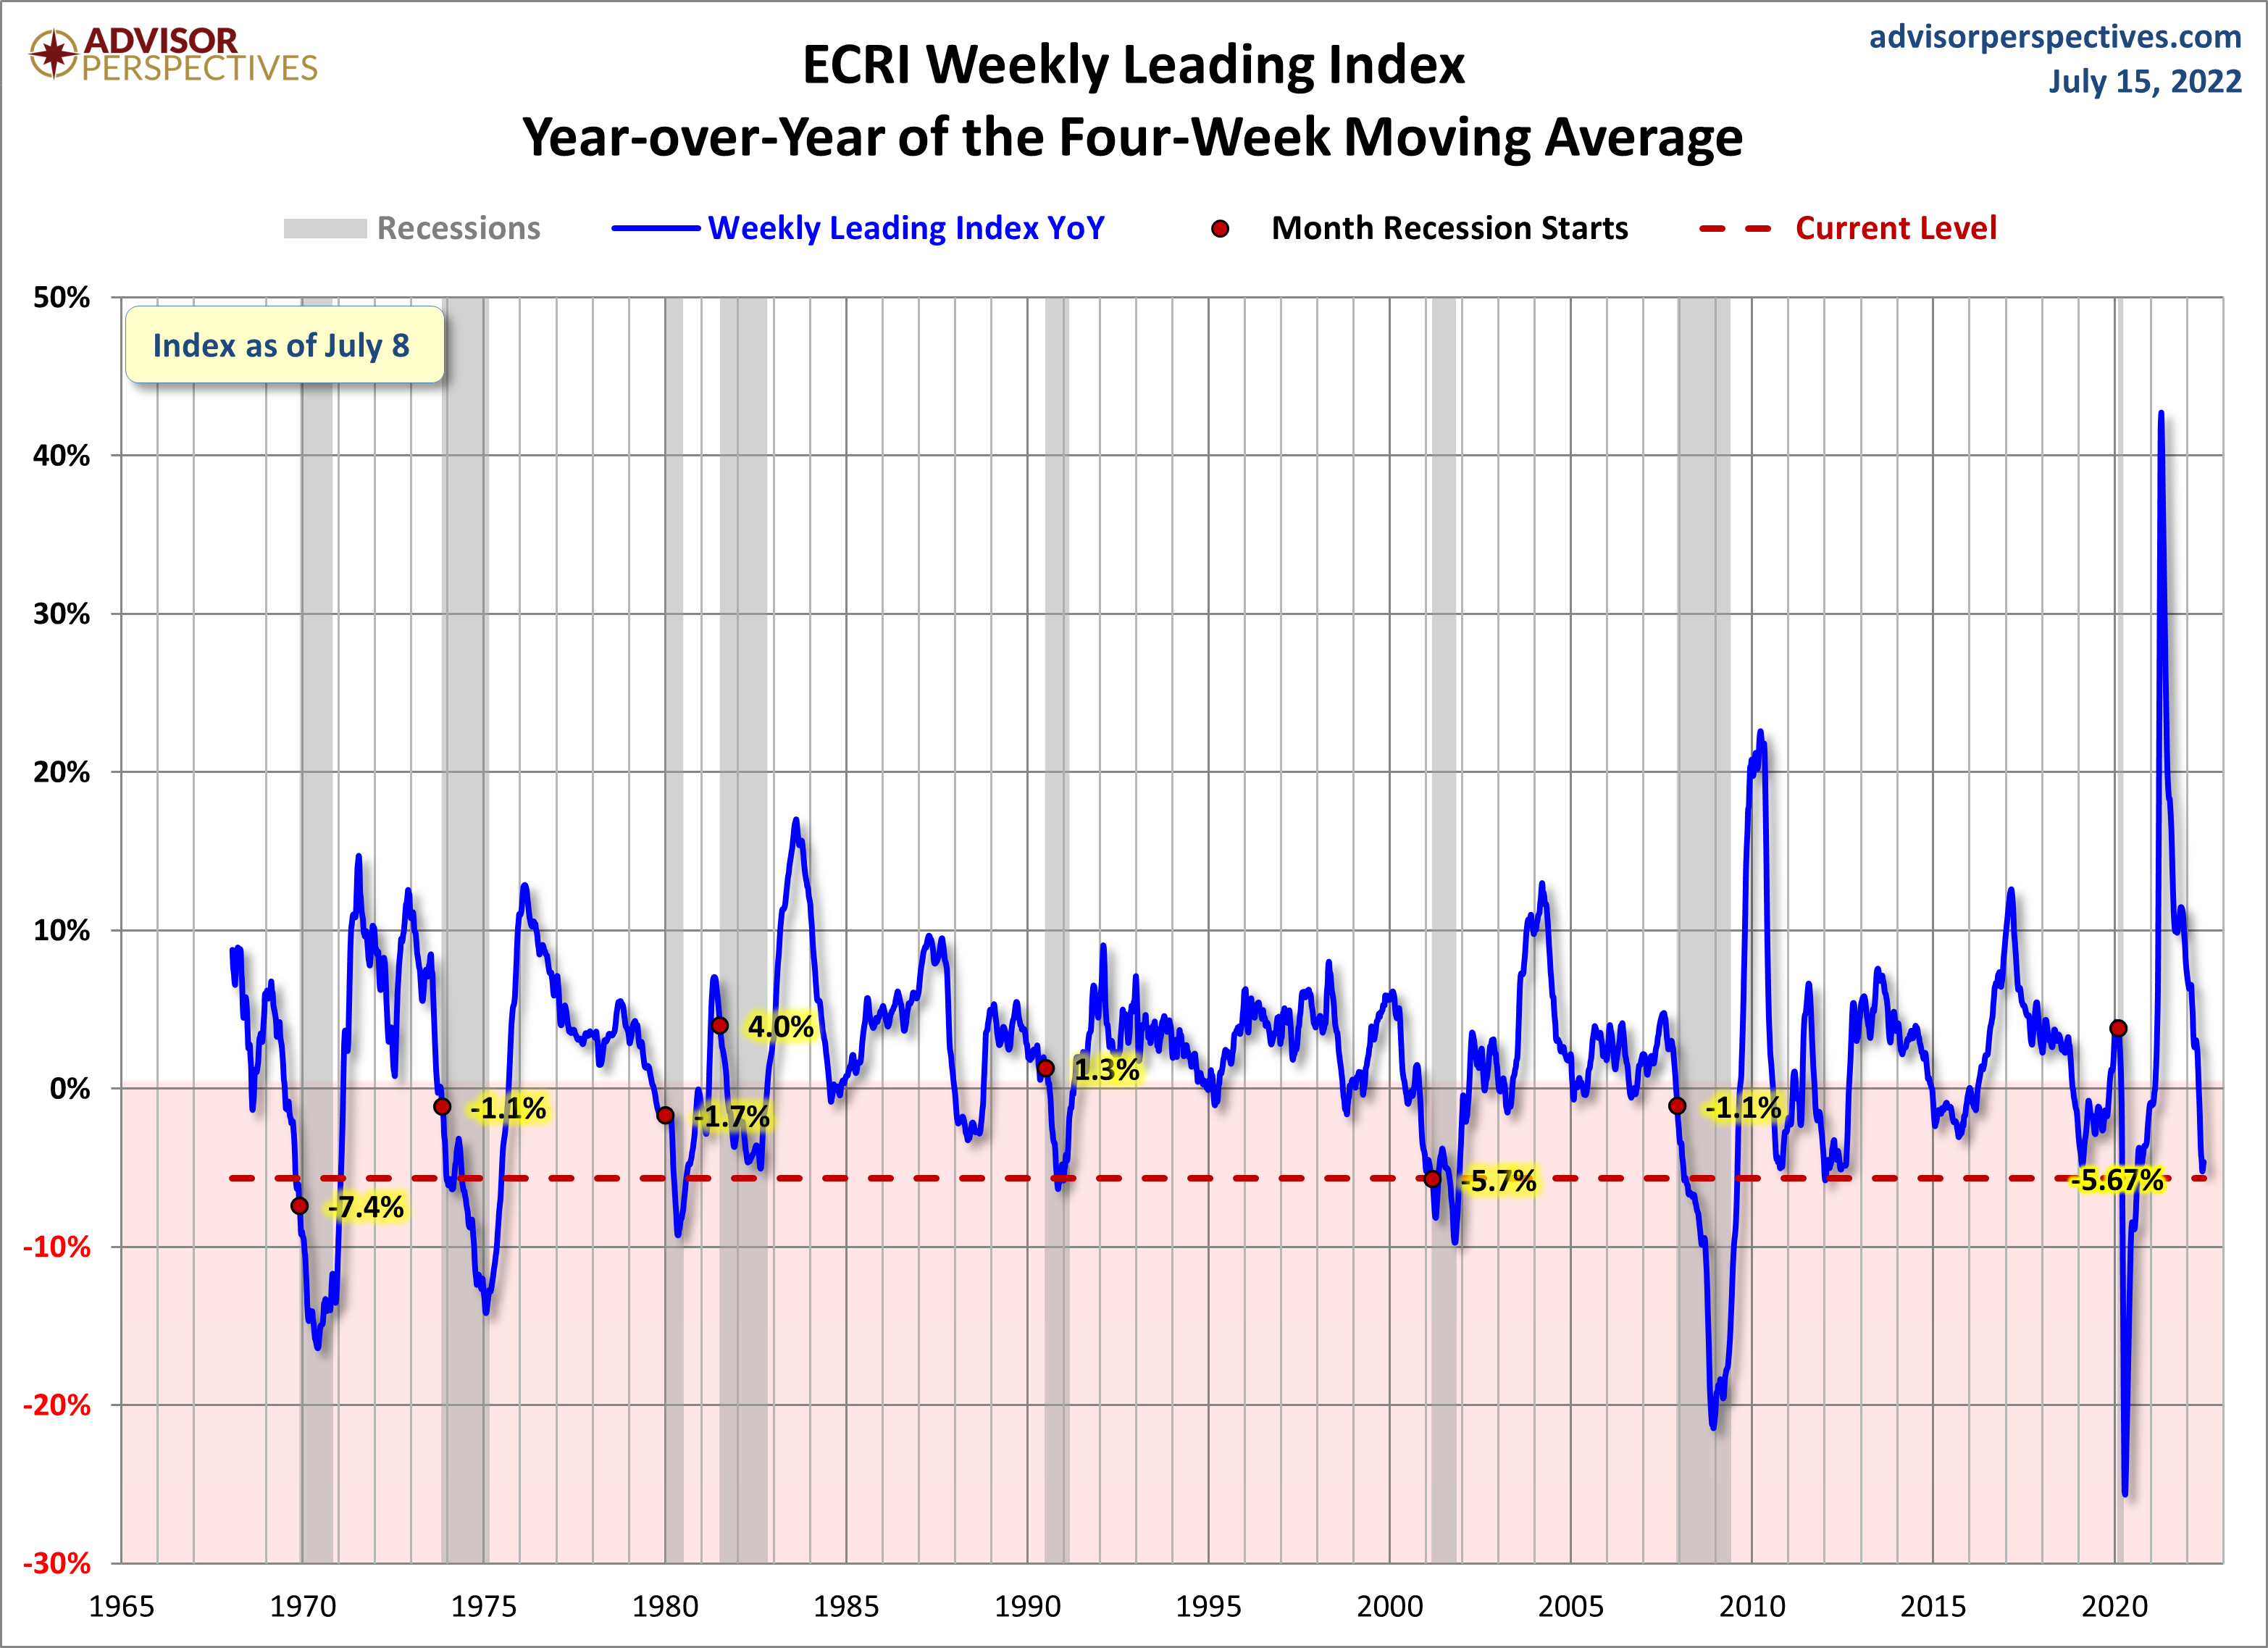
ECRI WLI YoY of the Four-Week Moving Average

–

This last chart depicts, on a long-term basis, the WLI, Gr.:

ECRI WLI,Gr. -9.1 Percent

_________

I post various economic indicators and indices because I believe they should be carefully monitored.  However, as those familiar with this site are aware, I do not necessarily agree with what they depict or imply.

_____

The Special Note summarizes my overall thoughts about our economic situation

SPX at 3854.95 as this post is written