Friday, October 21, 2022

Recession Probability Models – October 2022

There are a variety of economic models that are supposed to predict the probabilities of recession.

While I don’t agree with the methodologies employed or probabilities of impending economic weakness as depicted by the following two models, I think the results of these models should be monitored.

Please note that each of these models is updated regularly, and the results of these – as well as other recession models – can fluctuate significantly.

The first is the “Yield Curve as a Leading Indicator” from the New York Federal Reserve.  I wrote a post concerning this measure on March 1, 2010, titled “The Yield Curve as a Leading Indicator.”

Currently (last updated October 21, 2022 using data through September 2022) this “Yield Curve” model shows a 23.0673% probability of a recession in the United States twelve months ahead.  For comparison purposes, it showed a 25.1495% probability through August 2022, and a chart going back to 1960 is seen at the “Probability Of U.S. Recession Predicted by Treasury Spread.” (pdf)

The second model is from Marcelle Chauvet and Jeremy Piger.  This model is described on the St. Louis Federal Reserve site (FRED) as follows:

Smoothed recession probabilities for the United States are obtained from a dynamic-factor markov-switching model applied to four monthly coincident variables: non-farm payroll employment, the index of industrial production, real personal income excluding transfer payments, and real manufacturing and trade sales. This model was originally developed in Chauvet, M., “An Economic Characterization of Business Cycle Dynamics with Factor Structure and Regime Switching,” International Economic Review, 1998, 39, 969-996. (http://faculty.ucr.edu/~chauvet/ier.pdf)

Additional details and explanations can be seen on the “U.S. Recession Probabilities” page.

This model, last updated on October 3, 2022 currently shows a 1.22% probability using data through August 2022.

Here is the FRED chart (last updated October 3, 2022):
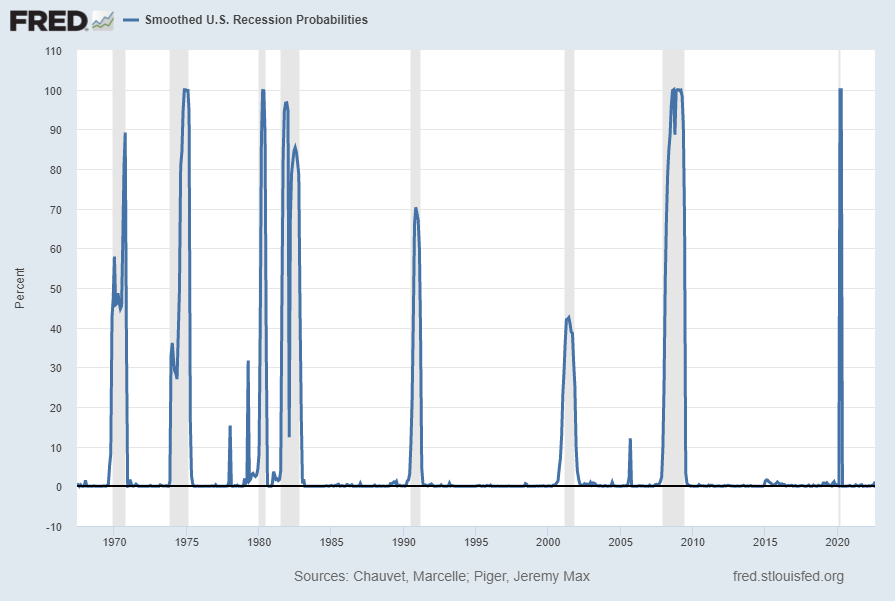
Smoothed U.S. Recession Probabilities

Data Source:  Piger, Jeremy Max and Chauvet, Marcelle, Smoothed U.S. Recession Probabilities [RECPROUSM156N], retrieved from FRED, Federal Reserve Bank of St. Louis, accessed October 21, 2022:  
http://research.stlouisfed.org/fred2/series/RECPROUSM156N

The two models featured above can be compared against measures seen in recent posts.  For instance, as seen in the October 16, 2022 post titled “The October 2022 Wall Street Journal Economic Forecast Survey“ economists surveyed averaged a 63% probability of a U.S. recession within the next 12 months.

_____

The Special Note summarizes my overall thoughts about our economic situation

SPX at 3753.99 as this post is written

Thursday, October 20, 2022

Chicago Fed National Financial Conditions Index (NFCI)

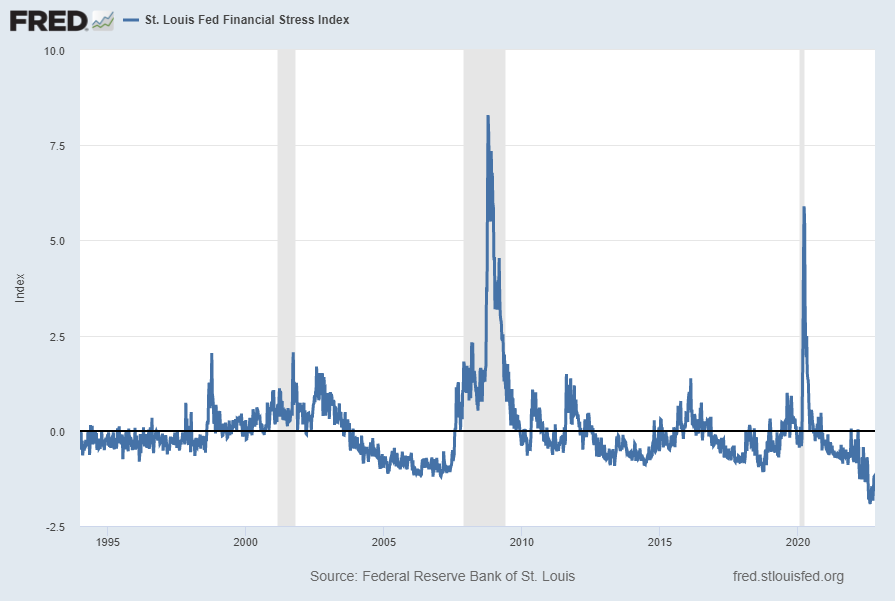
The St. Louis Fed’s Financial Stress Index (STLFSI3) is one index that is supposed to measure stress in the financial system. Its reading as of the October 20, 2022 update (reflecting data through October 14, 2022) is -1.4153:

STLFSI3

source: Federal Reserve Bank of St. Louis, St. Louis Fed Financial Stress Index [STLFSI3], retrieved from FRED, Federal Reserve Bank of St. Louis; accessed October 20, 2022: https://fred.stlouisfed.org/series/STLFSI3

Of course, there are a variety of other measures and indices that are supposed to measure financial stress and other related issues, both from the Federal Reserve as well as from private sources.

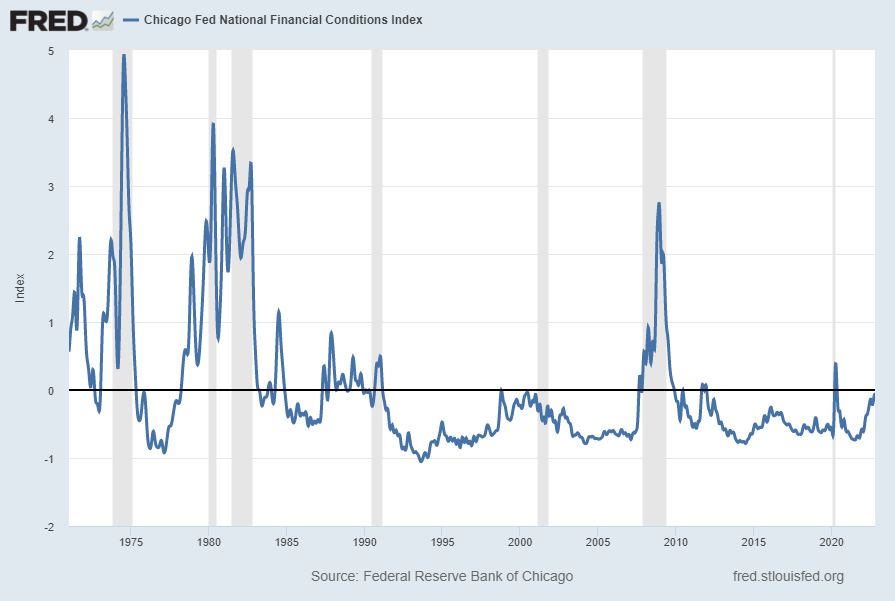
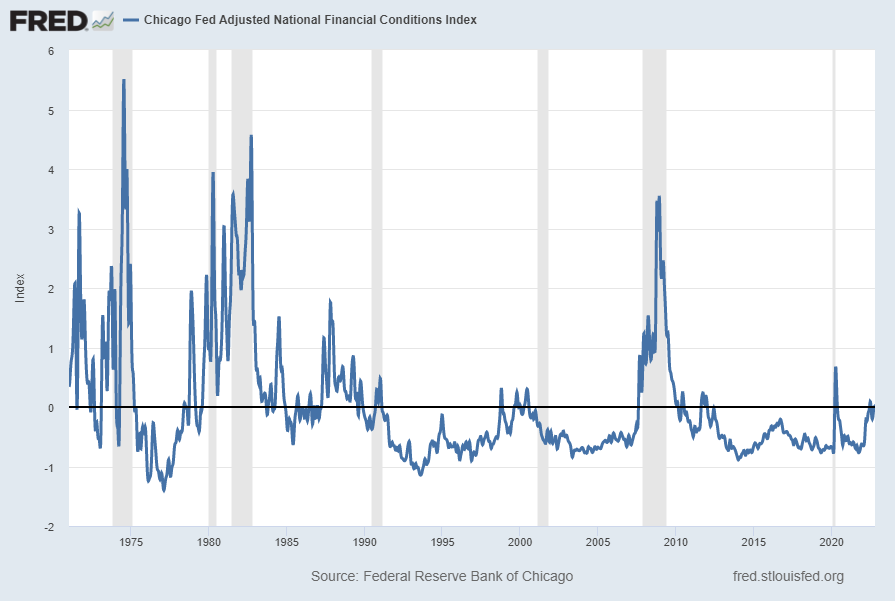
Two other indices that I regularly monitor include the Chicago Fed National Financial Conditions Index (NFCI) as well as the Chicago Fed Adjusted National Financial Conditions Index (ANFCI).

Here are summary descriptions of each, as seen in FRED:

The National Financial Conditions Index (NFCI) measures risk, liquidity and leverage in money markets and debt and equity markets as well as in the traditional and “shadow” banking systems. Positive values of the NFCI indicate financial conditions that are tighter than average, while negative values indicate financial conditions that are looser than average.

The adjusted NFCI (ANFCI). This index isolates a component of financial conditions uncorrelated with economic conditions to provide an update on how financial conditions compare with current economic conditions.

For further information, please visit the Federal Reserve Bank of Chicago’s web site:

http://www.chicagofed.org/webpages/publications/nfci/index.cfm

Below are the most recently updated charts of the NFCI and ANFCI, respectively.

The NFCI chart below was last updated on October 19, 2022 incorporating data from January 8, 1971 through October 14, 2022 on a weekly basis.  The October 14 value is -.006227:

NFCI

Data Source: FRED, Federal Reserve Economic Data, Federal Reserve Bank of St. Louis; accessed October 20, 2022:  
http://research.stlouisfed.org/fred2/series/NFCI

The ANFCI chart below was last updated on October 19, 2022 incorporating data from January 8, 1971 through October 14, 2022, on a weekly basis.  The October 14, 2022 value is -.02943:

ANFCI

Data Source: FRED, Federal Reserve Economic Data, Federal Reserve Bank of St. Louis; accessed October 20, 2022:  
http://research.stlouisfed.org/fred2/series/ANFCI

_________

I post various indicators and indices because I believe they should be carefully monitored.  However, as those familiar with this site are aware, I do not necessarily agree with what they depict or imply.

_____

The Special Note summarizes my overall thoughts about our economic situation

SPX at 3665.78 as this post is written
Tuesday, October 18, 2022

Trends Of S&P500 Earnings Forecasts

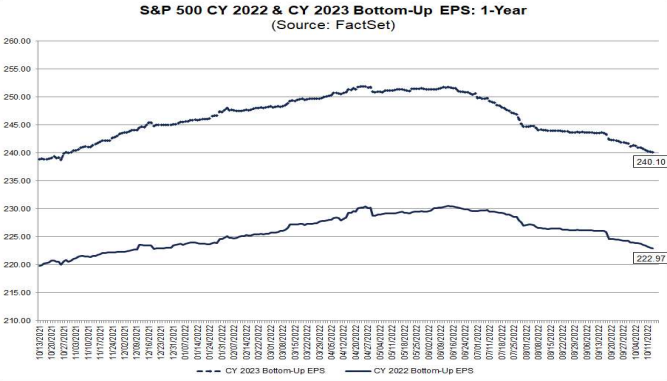
S&P500 earnings trends and estimates are a notably important topic, for a variety of reasons, at this point in time.

FactSet publishes a report titled “Earnings Insight” that contains a variety of information including the trends and expectations of S&P500 earnings.

For reference purposes, here are two charts as seen in the “Earnings Insight” report of October 14, 2022:

from page 26:

(click on charts to enlarge images)

S&P500 EPS estimates 2022 & 2023

from page 27:

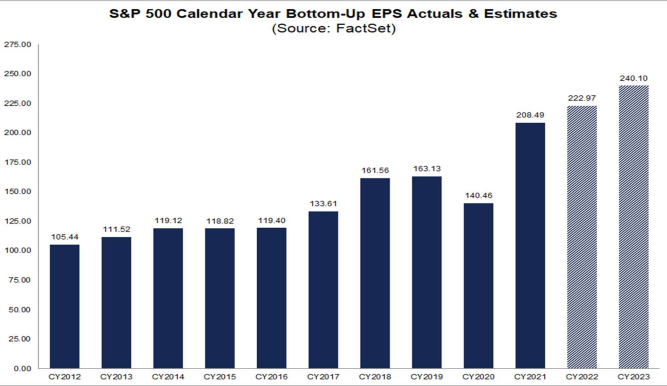
S&P500 EPS 2012-2023

_____

I post various economic forecasts because I believe they should be carefully monitored.  However, as those familiar with this site are aware, I do not agree with many of the consensus estimates and much of the commentary in these forecast surveys.

_____

The Special Note summarizes my overall thoughts about our economic situation

SPX at 3721.17 as this post is written
Monday, October 17, 2022

2022-2024 S&P500 EPS Estimates And Past Earnings

As many are aware, Refinitiv publishes earnings estimates for the S&P500.  (My other posts concerning S&P earnings estimates can be found under the S&P500 Earnings label)

The following estimates are from Exhibit 24 of the “S&P500 Earnings Scorecard” (pdf) of October 14, 2022, and represent an aggregation of individual S&P500 component “bottom up” analyst forecasts.  For reference, the Year 2014 value is $118.78/share; the Year 2015 value is $117.46/share; the Year 2016 value is $118.10/share; the Year 2017 value is $132.00/share; the Year 2018 value is $161.93/share; the Year 2019 value is $162.93/share; the Year 2020 value is $139.72/share; and the year 2021 value is $208.12:

Year 2022 estimate:

$222.58/share

Year 2023 estimate:

$239.80/share

Year 2024 estimate:

$259.12/share

_____

I post various economic forecasts because I believe they should be carefully monitored.  However, as those familiar with this site are aware, I do not agree with many of the consensus estimates and much of the commentary in these forecast surveys.

_____

The Special Note summarizes my overall thoughts about our economic situation

SPX at 3675.81 as this post is written

Standard & Poor’s S&P500 EPS Estimates 2022 – 2023 – October 7, 2022

As many are aware, Standard & Poor’s publishes earnings estimates for the S&P500.  (My posts concerning their estimates can be found under the S&P500 Earnings label)

For reference purposes, the most current estimates are reflected below, and are as of October 7, 2022:

Year 2022 estimates add to the following:

-From a “bottom up” perspective, operating earnings of $208.12/share

-From a “bottom up” perspective, “as reported” earnings of $186.95/share

Year 2023 estimates add to the following:

-From a “bottom up” perspective, operating earnings of $238.29/share

-From a “bottom up” perspective, “as reported” earnings of $209.29/share

_____

I post various economic forecasts because I believe they should be carefully monitored.  However, as those familiar with this site are aware, I do not agree with many of the consensus estimates and much of the commentary in these forecast surveys.

_____

The Special Note summarizes my overall thoughts about our economic situation

SPX at 3681.18 as this post is written

Sunday, October 16, 2022

The October 2022 Wall Street Journal Economic Forecast Survey

The October 2022 Wall Street Journal Economic Forecast Survey was published on October 16, 2022. The headline is “Economists Now Expect a Recession, Job Losses by Next Year.”

I found numerous items to be notable – although I don’t necessarily agree with them – both within the article and in the forecasts section.

Two excerpts:

Forecasters have ratcheted up their expectations for a recession because they increasingly doubt the Fed can keep raising rates to cool inflation without inducing higher unemployment and an economic downturn. Some 58.9% of economists said they think the Fed will raise interest rates too much and cause unnecessary economic weakness, up from 45.6% in July.

also:

Economists’ average forecasts suggest that they expect a recession to be relatively short-lived. Of the economists who see a greater than 50% chance of a recession in the next year, their average expectation for the length of a recession was eight months. The average postwar recession lasted 10.2 months.

As seen in the “Recession Probability” section, the average response as to whether the economy will be in a recession within the next 12 months was 63%. The individual estimates, of those who responded, ranged from 1% to 100%.  For reference, the average response in July’s survey [the previously published survey] was 49%.

As stated in the article, the survey’s 66 respondents were academic, financial and business economists.  The survey was conducted October 7 – October 11. Not every economist answered every question.

Economic Forecasts

The current average forecasts among economists polled include the following:

GDP:

full-year 2022:  .22%

full-year 2023:  .44%

full-year 2024:  1.82%

full-year 2025:  2.12%

Unemployment Rate:

December 2022: 3.70%

December 2023: 4.71%

December 2024: 4.64%

December 2025: 4.31%

10-Year Treasury Yield:

December 2022: 3.84%

December 2023: 3.45%

December 2024: 3.19%

December 2025: 3.20%

CPI:

December 2022:  7.18%

December 2023:  3.25%

December 2024:  2.42%

December 2025:  2.25%

Core PCE:

full-year 2022:  4.82%

full-year 2023:  3.19%

full-year 2024:  2.34%

full-year 2025:  2.13%

(note: I have highlighted this WSJ Economic Forecast survey each time it is published; it was published monthly until April 2021, after which the survey is conducted (at least) every three months; commentary on past surveys can be found under the “Economic Forecasts” label)

_____

I post various economic forecasts because I believe they should be carefully monitored.  However, as those familiar with this site are aware, I do not necessarily agree with many of the consensus estimates and much of the commentary in these forecast surveys.

_____

The Special Note summarizes my overall thoughts about our economic situation

SPX at 3583.07as this post is written

Friday, October 14, 2022

Disturbing Charts (Update 47)

The following is the latest update of 10 charts that depict various aspects of the U.S. economic and financial situation.

I find these charts portray disturbing long-term trends. These trends have been in effect for years.

These charts raise a lot of questions.  As well, they highlight the “atypical” nature of our economic situation from a long-term historical perspective.

All of these charts are from the Federal Reserve, and represent the most recently updated data.

(click on charts to enlarge images)

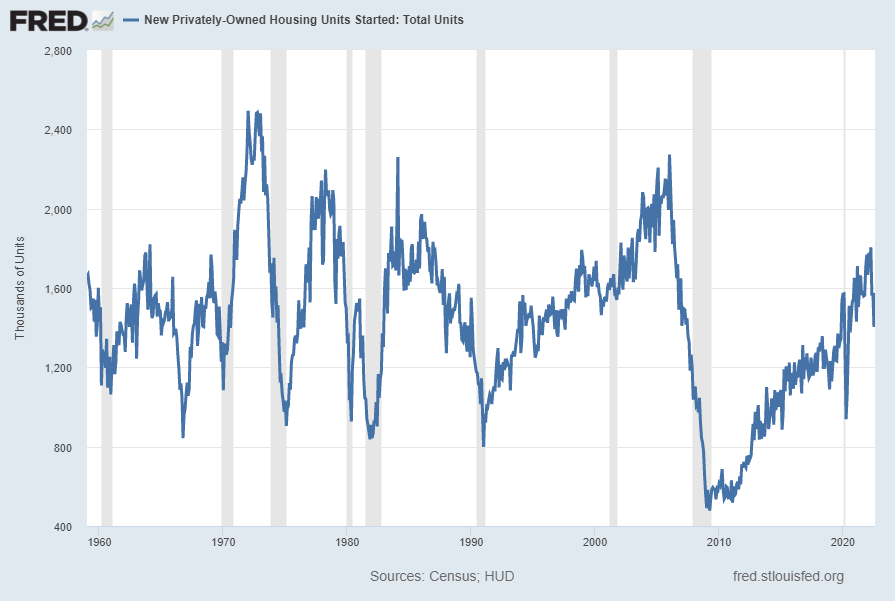
Housing starts (last update September 20, 2022):

HOUST 1575

U.S. Bureau of the Census, Housing Starts: Total: New Privately Owned Housing Units Started [HOUST], retrieved from FRED, Federal Reserve Bank of St. Louis https://research.stlouisfed.org/fred2/series/HOUST/, October 13, 2022.

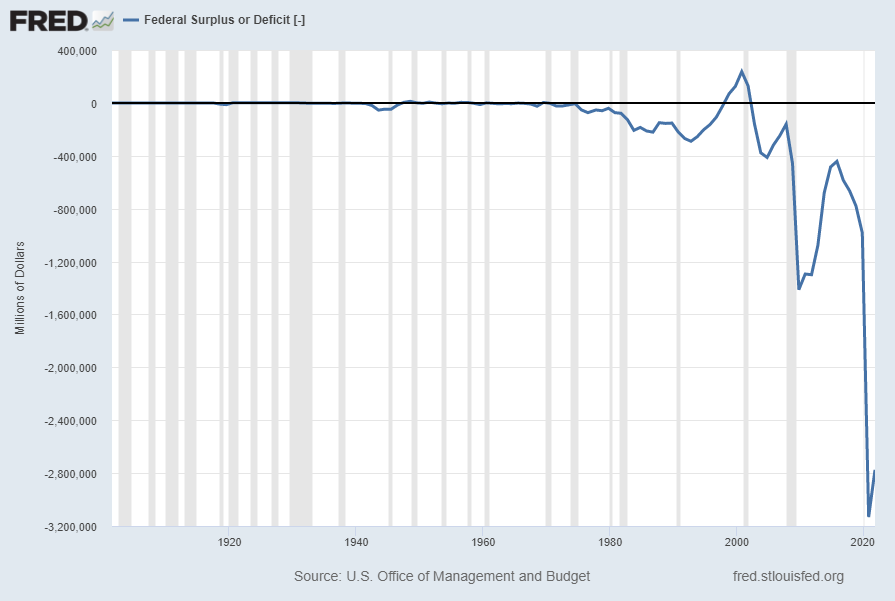
The Federal Deficit (last updated April 1, 2022):

Federal Deficit -2775337

U.S. Office of Management and Budget, Federal Surplus or Deficit [-] [FYFSD], retrieved from FRED, Federal Reserve Bank of St. Louis https://research.stlouisfed.org/fred2/series/FYFSD/, October 13, 2022.

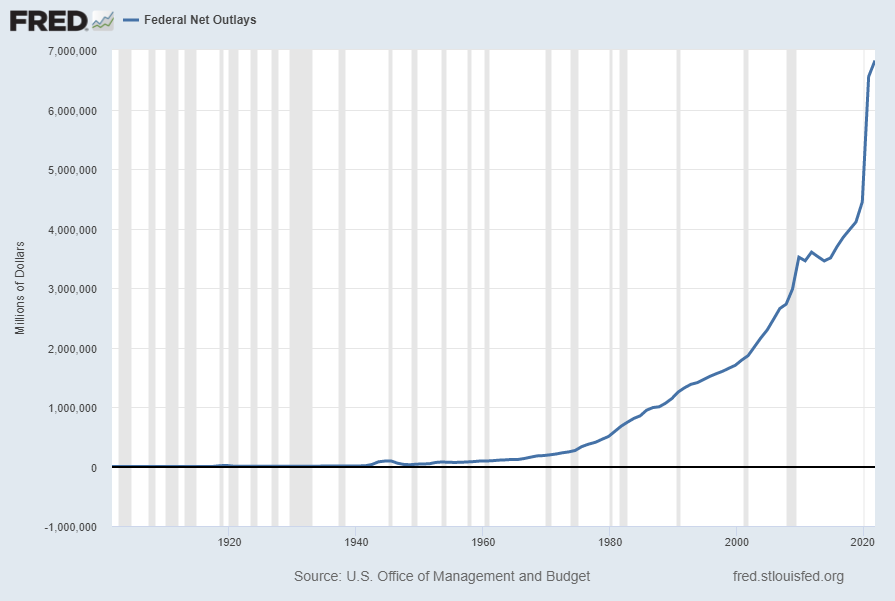
Federal Net Outlays (last updated April 1, 2022):

Federal Net Outlays 6822449

U.S. Office of Management and Budget, Federal Net Outlays [FYONET], retrieved from FRED, Federal Reserve Bank of St. Louis https://research.stlouisfed.org/fred2/series/FYONET/, October 13, 2022.

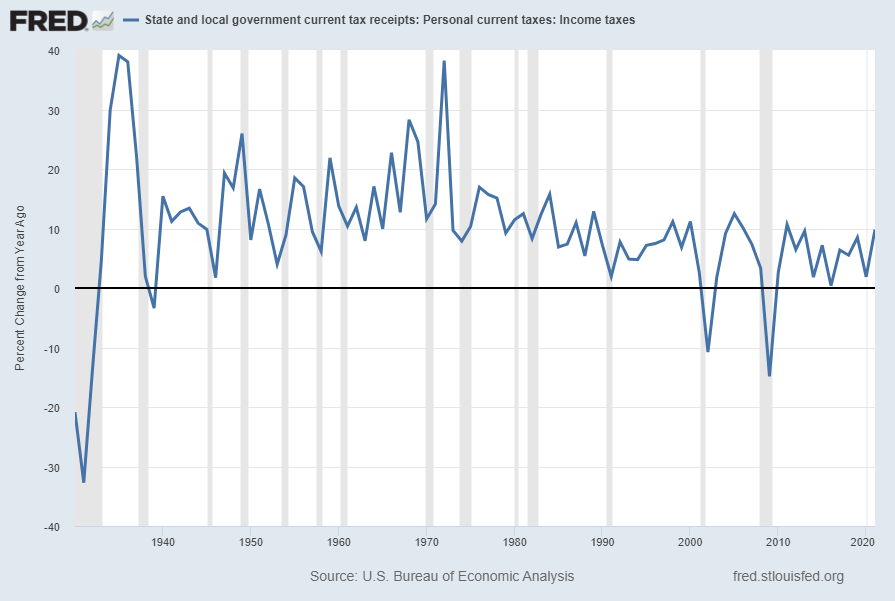
State & Local Personal Income Tax Receipts (% Change from Year Ago)(last updated September 29, 2022):

ASLPITAX 9.8 Percent Change From Year Ago

U.S. Bureau of Economic Analysis, State and local government current tax receipts: Personal current taxes: Income taxes [ASLPITAX], retrieved from FRED, Federal Reserve Bank of St. Louis https://research.stlouisfed.org/fred2/series/ASLPITAX/, October 13, 2022.

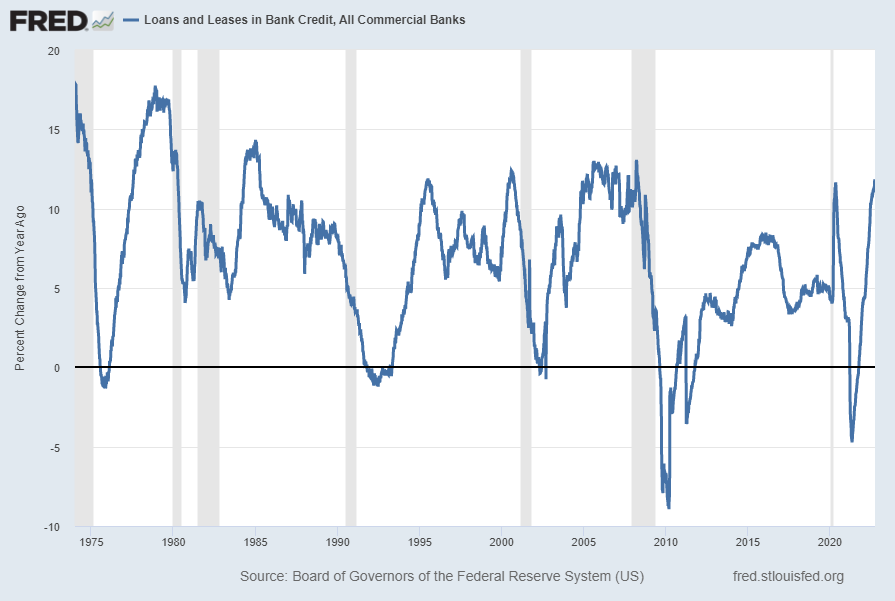
Total Loans and Leases of Commercial Banks (% Change from Year Ago)(last updated October 7, 2022):

TOTLL 11.7 Percent Change From Year Ago

Board of Governors of the Federal Reserve System (US), Loans and Leases in Bank Credit, All Commercial Banks [TOTLL], retrieved from FRED, Federal Reserve Bank of St. Louis https://research.stlouisfed.org/fred2/series/TOTLL/, October 13, 2022.

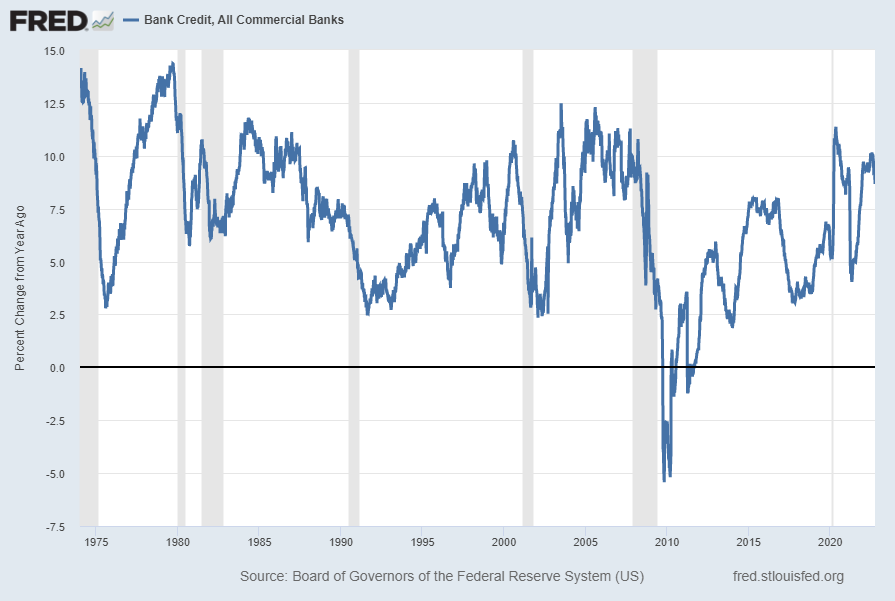
Bank Credit – All Commercial Banks (% Change from Year Ago)(last updated October 7, 2022):

TOTBKCR 8.7 Percent Change From Year Ago

Board of Governors of the Federal Reserve System (US), Bank Credit of All Commercial Banks [TOTBKCR], retrieved from FRED, Federal Reserve Bank of St. Louis https://research.stlouisfed.org/fred2/series/TOTBKCR/, October 13, 2022.

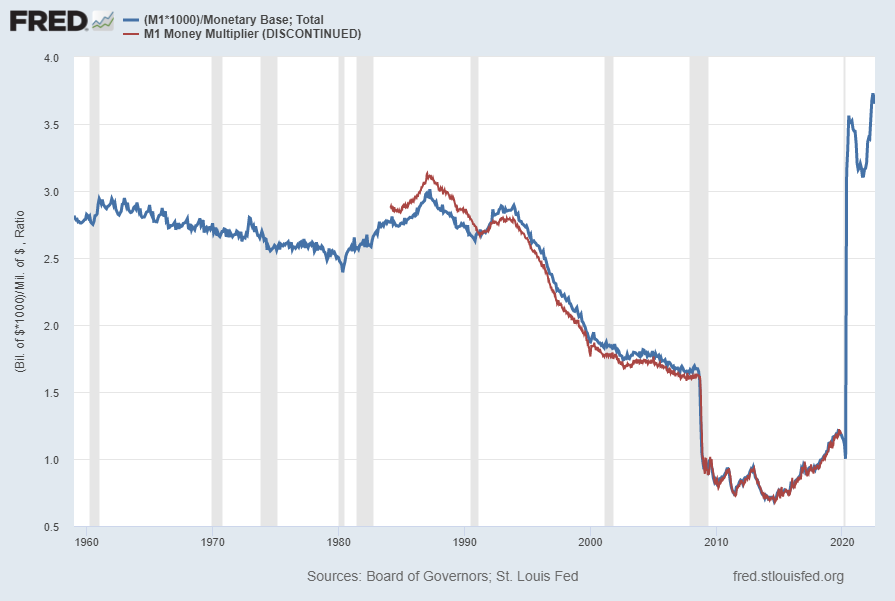
M1 Money Multiplier Proxy:

Money Multiplier Proxy 3.65086

Federal Reserve Bank of St. Louis, M1 Money Multiplier [MULT], retrieved from FRED, Federal Reserve Bank of St. Louis https://research.stlouisfed.org/fred2/series/MULT/, October 13, 2022.

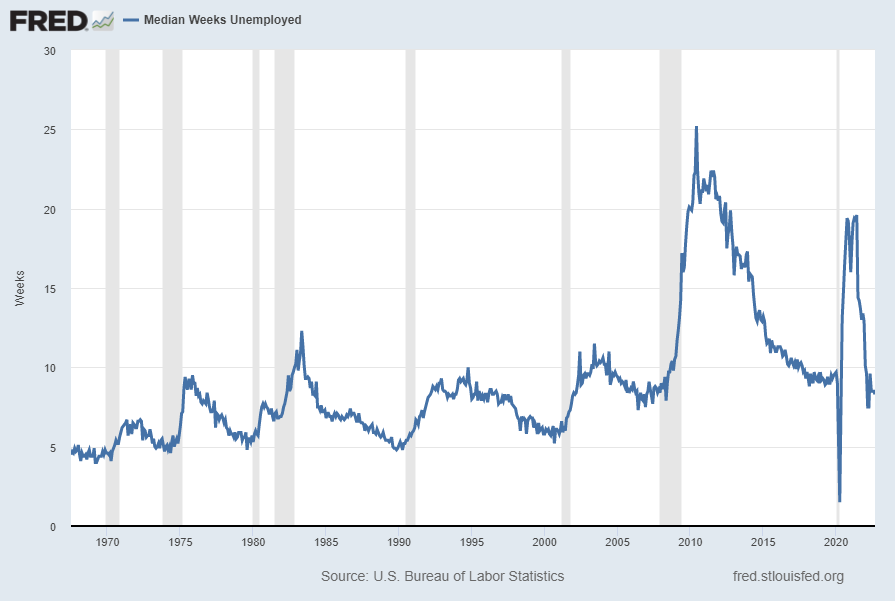
Median Duration of Unemployment (last updated October 7, 2022):

Median Duration of Unemployment 8.3 Weeks

U.S. Bureau of Labor Statistics, Median Duration of Unemployment [UEMPMED], retrieved from FRED, Federal Reserve Bank of St. Louis https://research.stlouisfed.org/fred2/series/UEMPMED/, October 13, 2022.

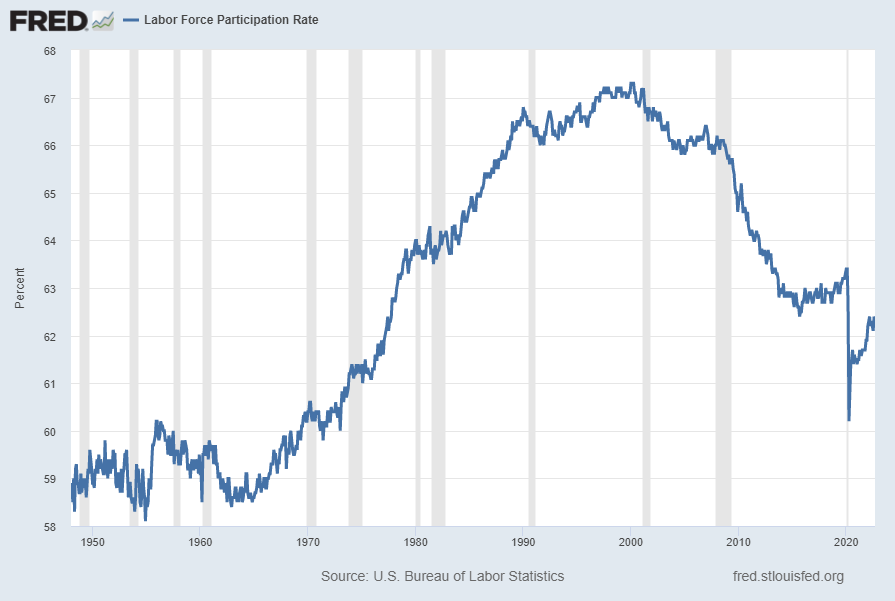
Labor Force Participation Rate (last updated October 7, 2022):

Labor Force Participation Rate 62.3 Percent

U.S. Bureau of Labor Statistics, Civilian Labor Force Participation Rate [CIVPART], retrieved from FRED, Federal Reserve Bank of St. Louis https://research.stlouisfed.org/fred2/series/CIVPART/, October 13, 2022.

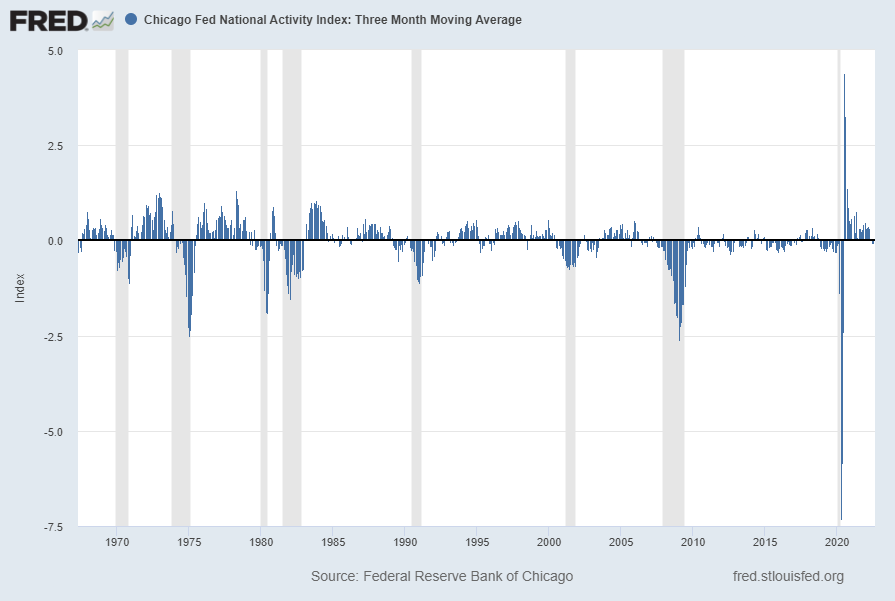
The Chicago Fed National Activity Index (CFNAI) Three Month Moving Average (CFNAI-MA3)(last updated September 26, 2022):

CFNAIMA3 .01

Federal Reserve Bank of Chicago, Chicago Fed National Activity Index: Three Month Moving Average [CFNAIMA3], retrieved from FRED, Federal Reserve Bank of St. Louis https://research.stlouisfed.org/fred2/series/CFNAIMA3/, October 13, 2022.

I will continue to update these charts on an intermittent basis as they deserve close monitoring…

_____

The Special Note summarizes my overall thoughts about our economic situation

SPX at 3602.15 as this post is written