This post provides an update to various past posts discussing deflation and "deflationary pressures." I have extensively written of “deflationary pressures” and deflation as I continue to believe that U.S. deflationary conditions are on the horizon, and that such deflationary conditions will cause, as well as accompany, inordinate economic hardship. [note: to clarify, for purposes of this discussion, when I mention “deflation” I am referring to the CPI going below zero. Also, I have been using the term “deflationary pressures” as a term to describe deflationary manifestations within an environment that is still overall inflationary but heading towards deflation.]
As one can see in the various professional economic forecasts mentioned in this site – as well as the continually negligible readings from the Federal Reserve Bank of Atlanta’s series titled “Deflation Probabilities” – economic forecasters continue to have virtually no expectation of U.S. deflation either in the near-term or for the next few years. However, at the same time, as the Wall Street Journal mentioned in a January 16 article, "The Fed has fallen short of its inflation goal for 2 1/2 years..."
I continue to believe that deflationary conditions will have serious direct and indirect adverse consequences, and would both accompany and cause severe economic hardship. As I wrote in the July 11, 2013 post titled "Would Deflation Be Beneficial?":
Also of note is various pernicious dynamics that would likely accompany deflation. While these, of course, would vary with the extent of deflation, many would be inimical to today’s U.S. economic and financial structure.
These dynamics are numerous and many are complex, and as such aren't suitably discussed in a brief manner. (For those interested, the Bloomberg article of January 21, 2015, titled "Why Falling Prices Are Actually a Really Bad Thing" does discuss various problems that arise with deflation, although I am not necessarily in total agreement with various aspects of the article, including its points and scope.)
For reference purposes, below are three charts showing the CPI, commodities, and inflation expectations:
Here is a chart of the CPI as seen in Doug Short’s update of January 16, 2015 titled “December Headline Consumer Price Index At Its Lowest Since October 2009” :
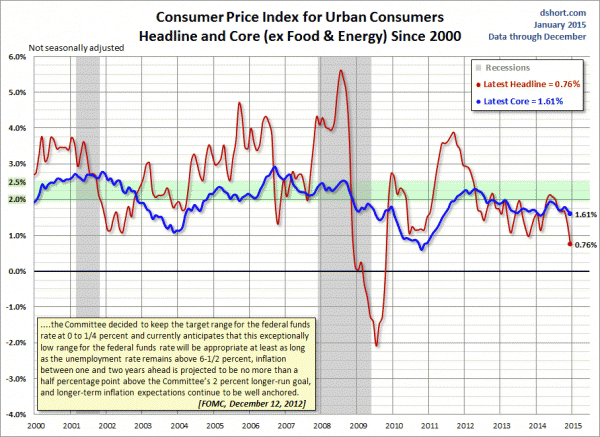
-
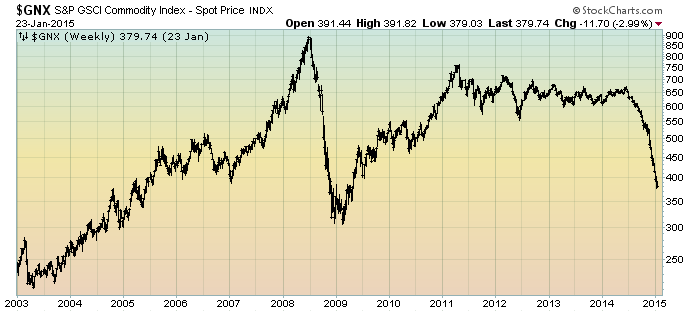
Here is a chart of the GSCI Commodity Index, shown on a weekly basis since 2003 on a LOG scale:
(chart courtesy of StockCharts.com; chart creation and annotation by the author)
-
Here is a chart of the 10-Year Breakeven Inflation Rate, with a last value of 1.61% as of the January 23, 2015 update (for those unaware of this measure, an excerpt from the FRED description: "The latest value implies what market participants expect inflation to be in the next 10 years, on average.")
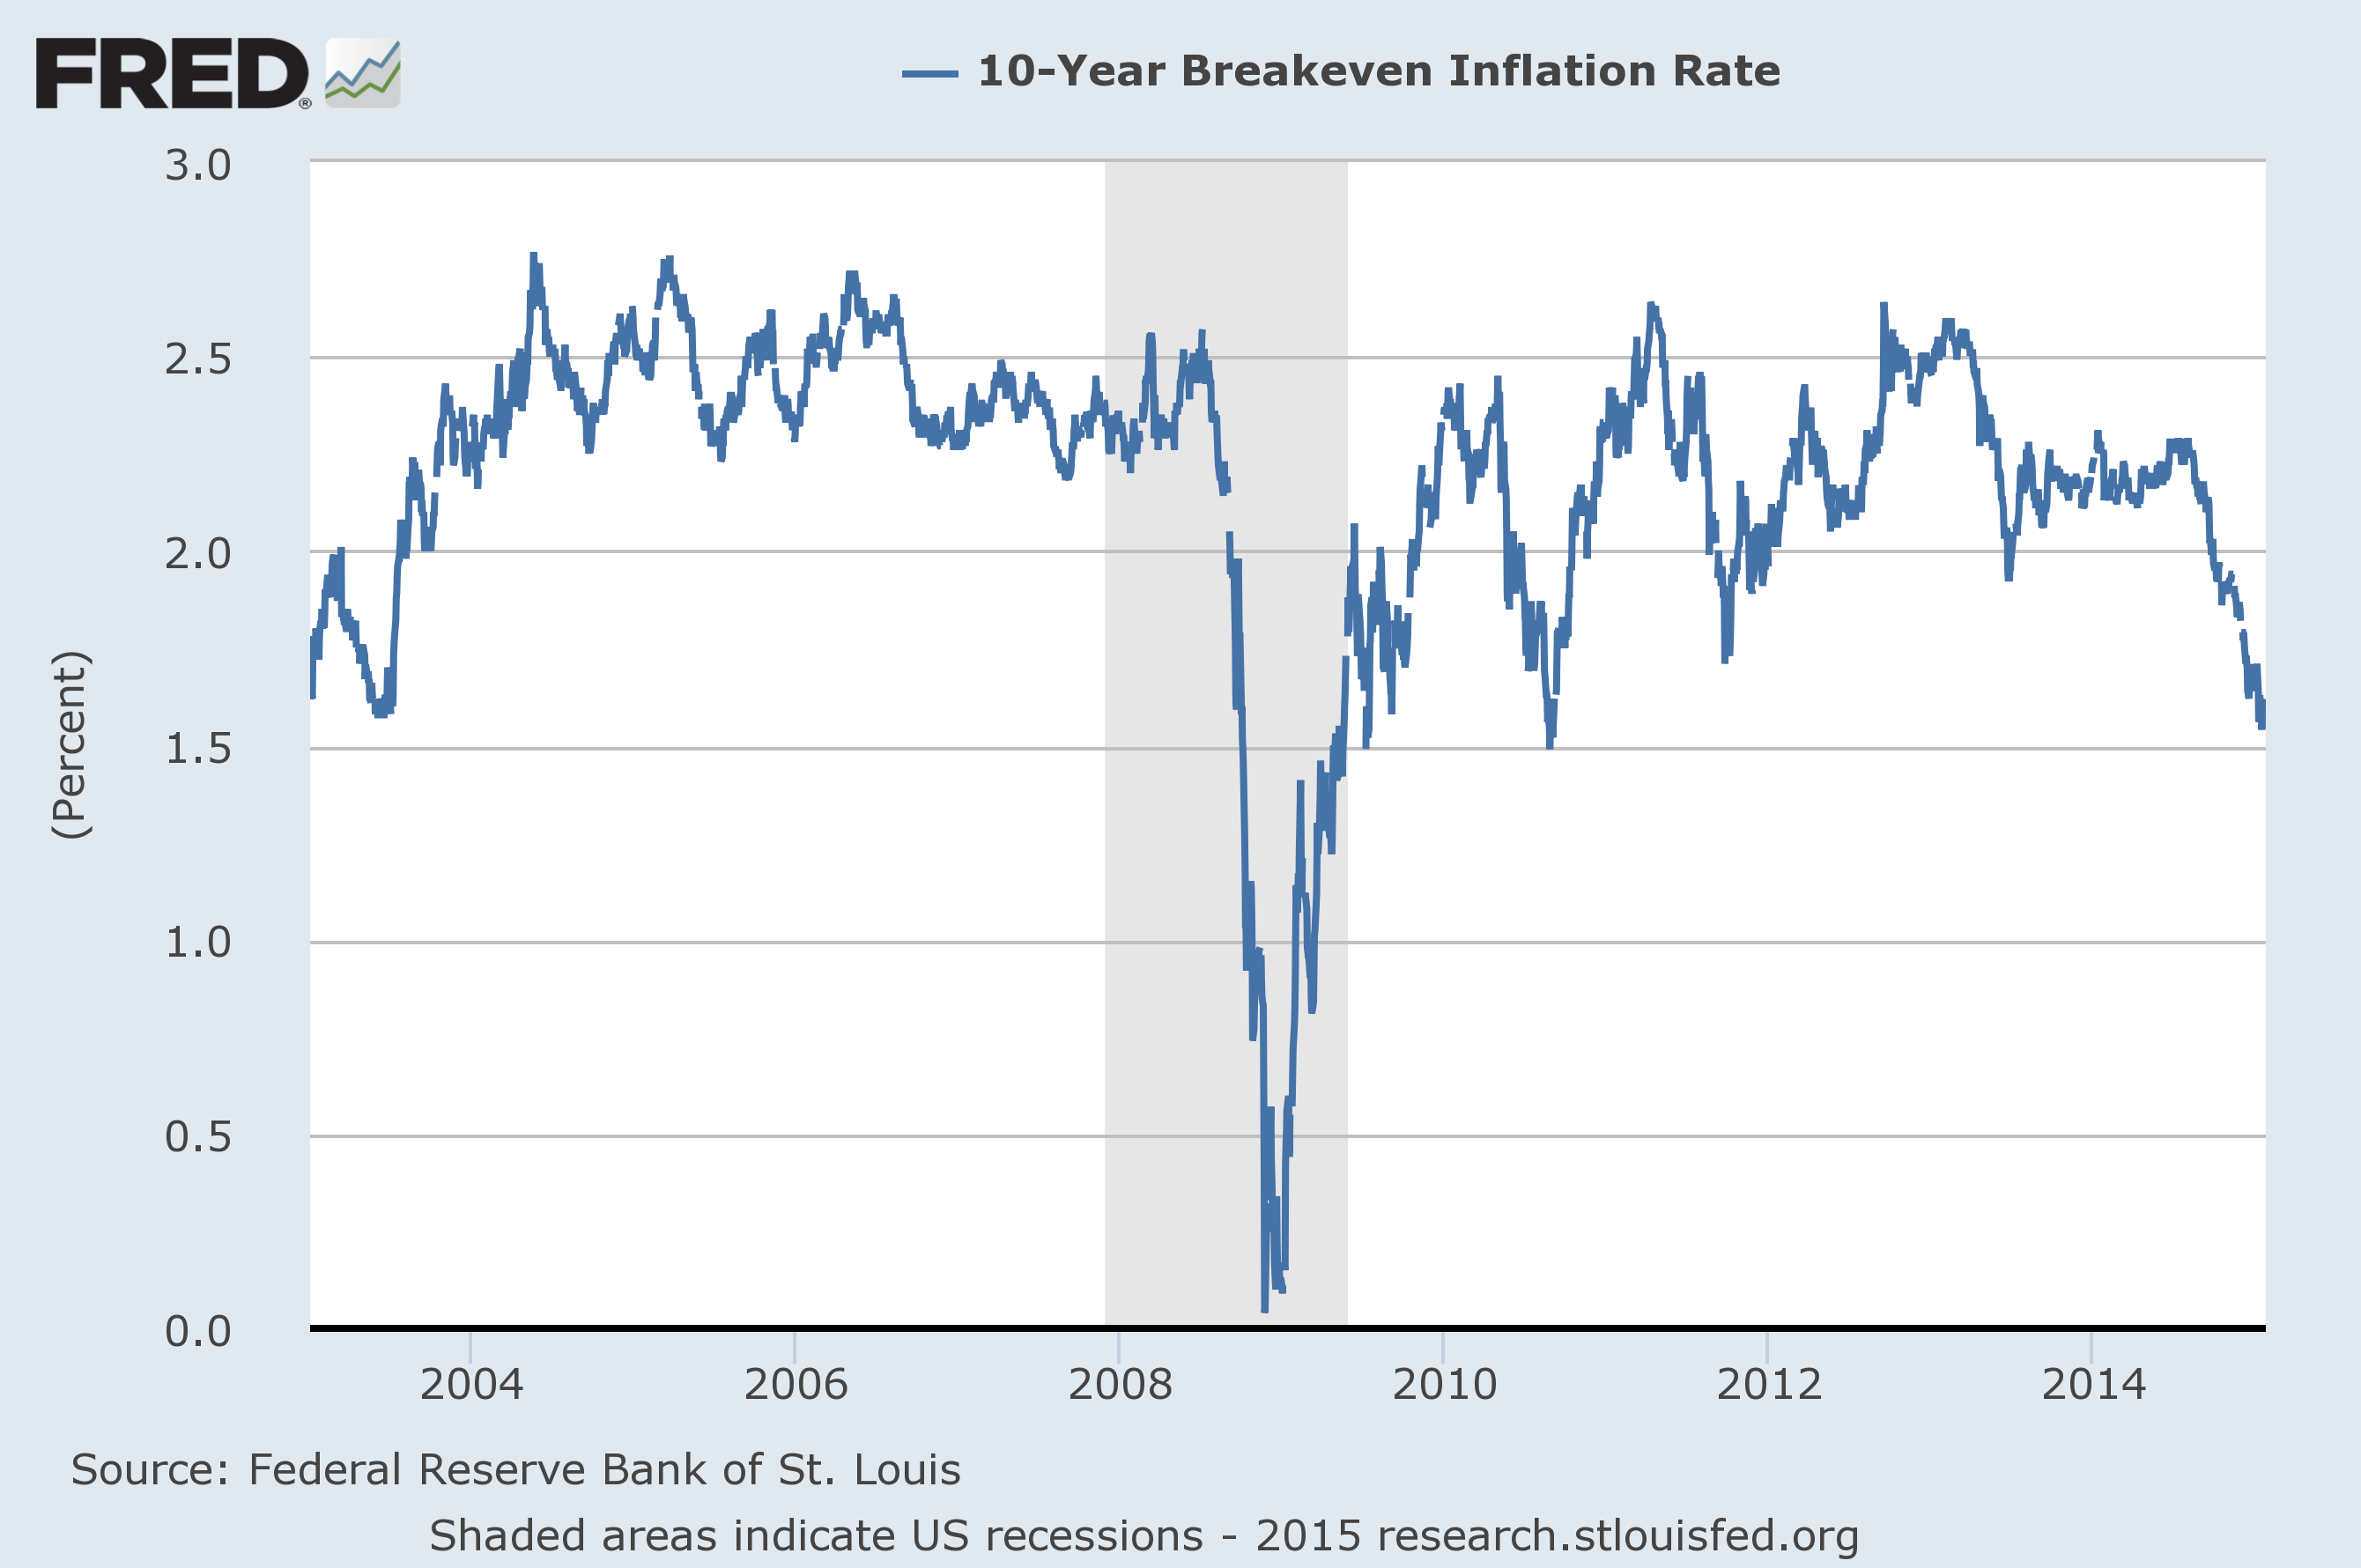
Source: Federal Reserve Bank of St. Louis, 10-Year Breakeven Inflation Rate [T10YIE], retrieved from FRED, Federal Reserve Bank of St. Louis:
https://research.stlouisfed.org/fred2/series/T10YIE/, January 25, 2015.
_____
The Special Note summarizes my overall thoughts about our economic situation
SPX at 2057.09 as this post is written
No comments:
Post a Comment