One notable aspect of the financial markets is the continuing sharp drop in crude oil prices. Other commodities have also been under selling pressure. I view these declines, as well as other aspects of the overall financial system, to be manifestations of "deflationary pressures," of which I have extensively written.
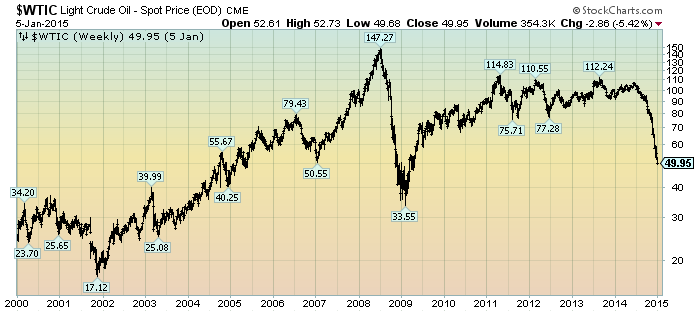
For reference purposes, here is a chart of (spot) Light Crude Oil, from the year 2000 to yesterday's closing price, depicted on a weekly basis using a LOG scale, with price labels:
(click on chart to enlarge image)(chart courtesy of StockCharts.com; chart creation and annotation by the author)
_____
The Special Note summarizes my overall thoughts about our economic situation
SPX at 2025.59 as this post is written
No comments:
Post a Comment