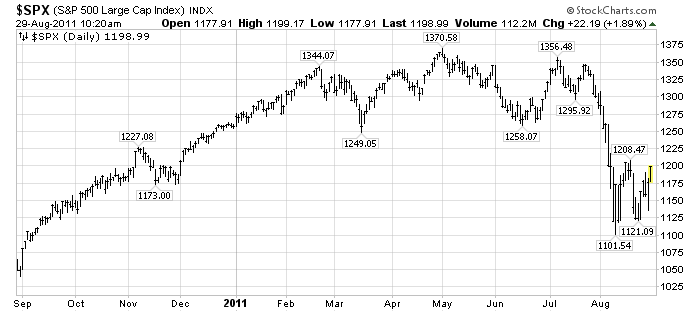
There seems to be consensus that the stock market, as represented by the S&P500, "bottomed" during its August 9th low at 1101.54. Here is the daily 1-year chart of the S&P500 for reference:
(click on chart to enlarge image)(chart courtesy of StockCharts.com)

-
Was that August 9 low a "true bottom" - i.e. one that will not be breached, at least in the short-term? I believe that the answer will be "no."
The decline from the May 2 top of 1370.58 has proven to be very "tricky" and difficult to predict. I wrote of a variety of problematical fundamental and technical issues during the decline. While the August 9 low did have the look of a "selling climax," based upon a variety of measures, a variety of technical and fundamental problems continue to exist, including market expectations concerning QE3 and the uncertainty regarding its implementation and timing.
One issue that I am very closely monitoring is that of the price of Gold and the significance of its current correction off of its highs, which I discussed in an August 25 post titled "Gold and Deflationary Pressures." As I stated in that post:
There are a variety of other major trends happening that lack recognition. I will be writing of these in future posts...I am very closely monitoring Gold as I believe a steep, abnormal correction could serve to (further) indicate deflationary pressures – which of course would have outsized impacts on financial markets, the economy, and economic policy (particularly QE3 or some other large intervention.)
_____
The Special Note summarizes my overall thoughts about our economic situation
SPX at 1196.88 as this post is written
Gold (December futures) at $1803.10/oz as this post is written
No comments:
Post a Comment