Shortly after each monthly employment report I have been posting a continual series titled “3 Critical Unemployment Charts.”
Of course, there are many other employment charts that can be displayed as well.
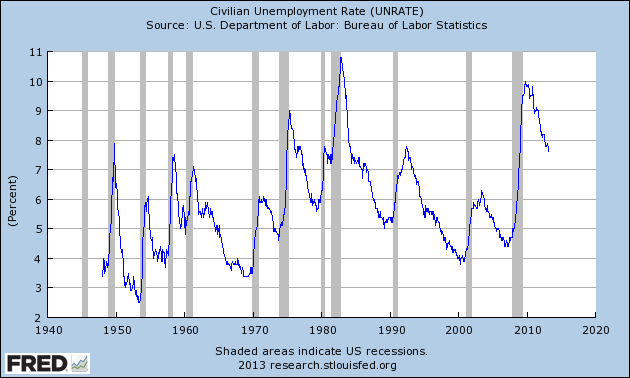
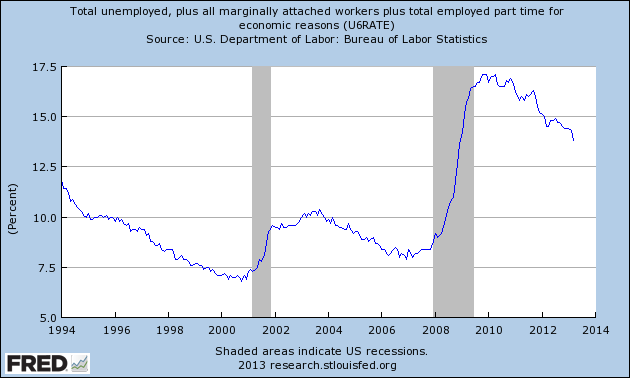
For reference purposes, below are the U-3 and U-6 Unemployment Rate charts from a long-term historical perspective. Both charts are from the St. Louis Fed site. The U-3 measure is what is commonly referred to as the official unemployment rate; whereas the U-6 rate is officially (per Bureau of Labor Statistics) defined as:
Total unemployed, plus all persons marginally attached to the labor force, plus total employed part time for economic reasons, as a percent of the civilian labor force plus all persons marginally attached to the labor force
Of note, many economic observers use the U-6 rate as a (closer) proxy of the actual unemployment rate rather than that depicted by the U-3 measure.
Here is the U-3 chart, currently showing a 7.6% unemployment rate:
(click on charts to enlarge images)(charts updated as of 4-5-13)
-
Here is the U-6 chart, currently showing a 13.8% unemployment rate:
_____
The Special Note summarizes my overall thoughts about our economic situation
SPX at 1553.28 as this post is written
We can't expect that unemployment rate will decrease with this economic crisis. If the government can solve this problem, surely this one will be a big news.
ReplyDeletefinancial system