Here is an update on various indicators that are supposed to predict and/or depict economic activity. These indicators have been discussed in previous blog posts:
The May Chicago Fed National Activity Index (CFNAI)(pdf) updated as of May 20, 2013:
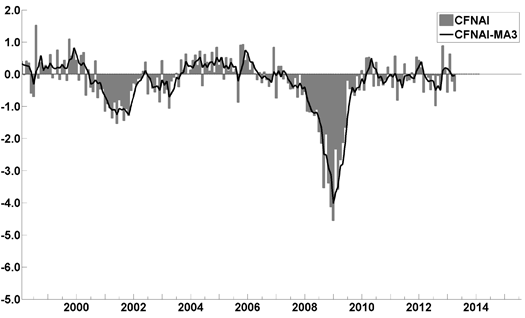
-
As of 5/17/13 (incorporating data through 5/10/13) the WLI was at 130.2 and the WLI, Gr. was at 7.0%.
A chart of the WLI, Gr. since 2000, from Doug Short’s blog of May 17 titled “Recession Watch: ECRI’s Weekly Leading Indicator Declines” :
-
Here is the latest chart, depicting 12-31-07 through 5-11-13:
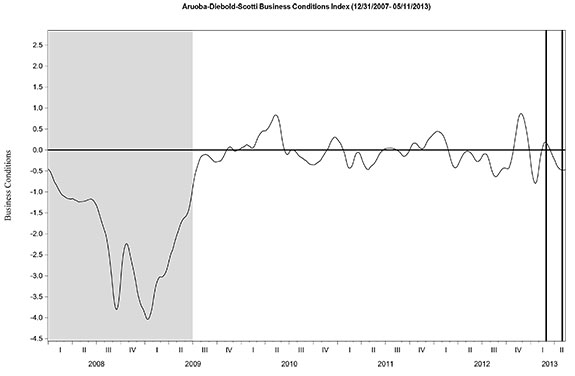
-
As per the May 17 press release, the LEI was at 95.0 and the CEI was at 105.6 in April.
An excerpt from the May 17 release:
Says Ataman Ozyildirim, economist at The Conference Board: “After a slight decline in March, the U.S. LEI rebounded in April, led by housing permits and the interest rate spread. Labor market conditions also contributed, although consumers’ outlook on the economy remains weak. In general, the LEI points to a continuing economic expansion with some upside potential. Meanwhile, the CEI, a measure of current conditions, has returned to a slow growth path, despite declining industrial production in April.”
Here is a chart of the LEI from Doug Short’s blog post of May 17 titled “Conference Board Leading Economic Index: April Rebound Suggests Continuing Economic Expansion" :
_________
I post various indicators and indices because I believe they should be carefully monitored. However, as those familiar with this blog are aware, I do not necessarily agree with what they depict or imply.
_____
The Special Note summarizes my overall thoughts about our economic situation
SPX at 1666.29 as this post is written
No comments:
Post a Comment