Shortly after each monthly employment report I have been posting a continual series titled “3 Critical Unemployment Charts.”
Of course, there are many other employment charts that can be displayed as well.
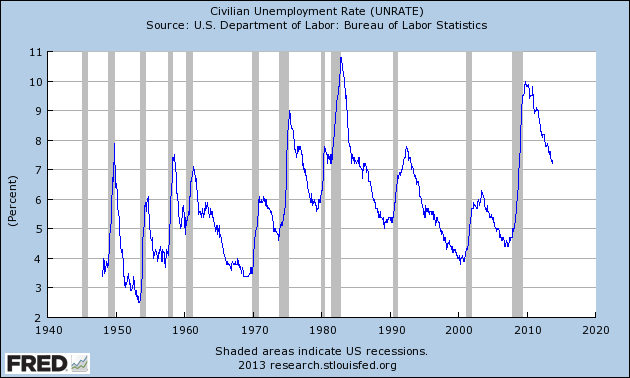
For reference purposes, below are the U-3 and U-6 Unemployment Rate charts from a long-term historical perspective. Both charts are from the St. Louis Fed site. The U-3 measure is what is commonly referred to as the official unemployment rate; whereas the U-6 rate is officially (per Bureau of Labor Statistics) defined as:
Total unemployed, plus all persons marginally attached to the labor force, plus total employed part time for economic reasons, as a percent of the civilian labor force plus all persons marginally attached to the labor force
Of note, many economic observers use the U-6 rate as a (closer) proxy of the actual unemployment rate rather than that depicted by the U-3 measure.
Here is the U-3 chart, currently showing a 7.3% unemployment rate:
(click on charts to enlarge images)(charts updated as of 11-8-13)
-
Here is the U-6 chart, currently showing a 13.8% unemployment rate:
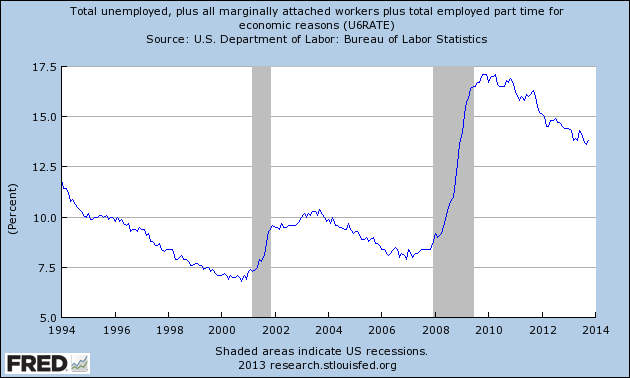
Data Source: FRED, Federal Reserve Economic Data, Federal Reserve Bank of St. Louis: Total unemployed, plus all marginally attached workers plus total employed part time for economic reasons [U6RATE] ; U.S. Department of Labor: Bureau of Labor Statistics; accessed November 8, 2013;
_____
The Special Note summarizes my overall thoughts about our economic situation
SPX at 1760.34 as this post is written
No comments:
Post a Comment