Here is an update of various indicators that are supposed to predict and/or depict economic activity. These indicators have been discussed in previous blog posts:
The July 2015 Chicago Fed National Activity Index (CFNAI) updated as of July 23, 2015:
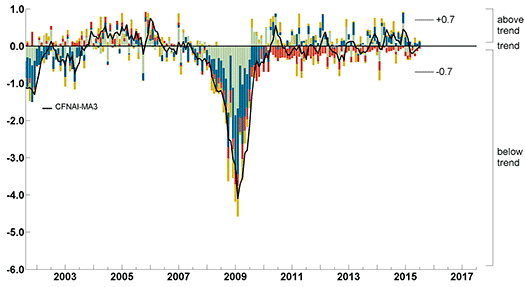
–
As of July 17, 2015 (incorporating data through July 10, 2015) the WLI was at 132.6 and the WLI, Gr. was at .6%.
A chart of the WLI,Gr., from Doug Short’s post of July 17, 2015, titled “ECRI Weekly Leading Index "Recoveries Remain Resilient“:
–
Here is the latest chart, depicting the ADS Index from December 31, 2007 through July 16, 2015:
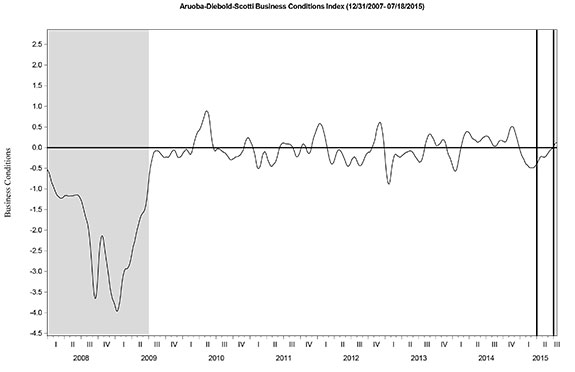
–
The Conference Board Leading (LEI) and Coincident (CEI) Economic Indexes:
As per the July 23, 2015 press release, titled “The Conference Board Leading Economic Index (LEI) for the U.S. Increased Again,” (pdf) the LEI was at 123.6 and the CEI was at 112.5 in June.
An excerpt from the July 23 release:
“The upward trend in the US LEI seems to be gaining more momentum with another large increase in June pointing to continued strength in the economic outlook for the remainder of the year,” said Ataman Ozyildirim, Director, Business Cycles and Growth Research, at The Conference Board. “Housing permits and the interest rate spread drove the latest gain in the LEI, while labor market indicators such as average workweek and initial claims remained unchanged.”
Here is a chart of the LEI from Doug Short’s blog post of July 23 titled “Conference Board Leading Economic Index Increased Again in June“:
_________
I post various indicators and indices because I believe they should be carefully monitored. However, as those familiar with this blog are aware, I do not necessarily agree with what they depict or imply.
_____
The Special Note summarizes my overall thoughts about our economic situation
SPX at 2104.52 as this post is written
No comments:
Post a Comment