Throughout this site there are many discussions of economic indicators. At this time, the readings of various indicators are especially notable. This post is the latest in a series of posts indicating U.S. economic weakness or a low growth rate.
While many U.S. economic indicators – including GDP – are indicating economic growth, others depict (or imply) various degrees of weak growth or economic contraction. The Gross Domestic Product Q3 2017 Second Estimate (pdf) of November 29, 2017 was 3.1%, and as seen in the November 2017 Wall Street Journal Economic Forecast Survey the consensus among various economists is for 2.5% GDP growth in 2017 & 2018. However, there are other broad-based economic indicators that seem to imply a weaker growth rate. As well, it should be remembered that GDP figures can be (substantially) revised.
Below are a small sampling of charts that depict greater degrees of weakness and/or other worrisome trends, and a brief comment for each:
–
Total Private Construction Spending
Various measures of construction continue to show weak growth and/or contraction.
Shown below is “Total Private Construction Spending,” through October with last value of $949,946 Million, displayed on a “Percent Change From Year Ago” basis with value 3.2%, last updated December 1, 2017:
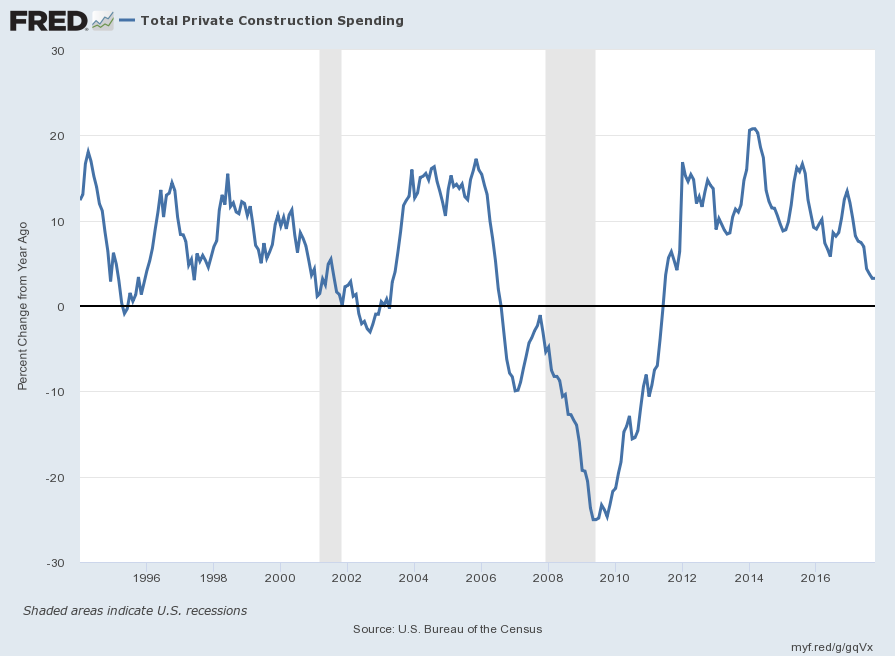
source: U.S. Bureau of the Census, Total Private Construction Spending [TLPRVCONS], retrieved from FRED, Federal Reserve Bank of St. Louis accessed December 6, 2017:
Total Federal Receipts
“Total Federal Receipts” growth continues to be intermittent in nature.
Shown below is “Total Federal Receipts,” through October with last value of $235,341 Million, displayed on a “Percent Change From Year Ago” basis with value 6.2%, last updated November 13, 2017:
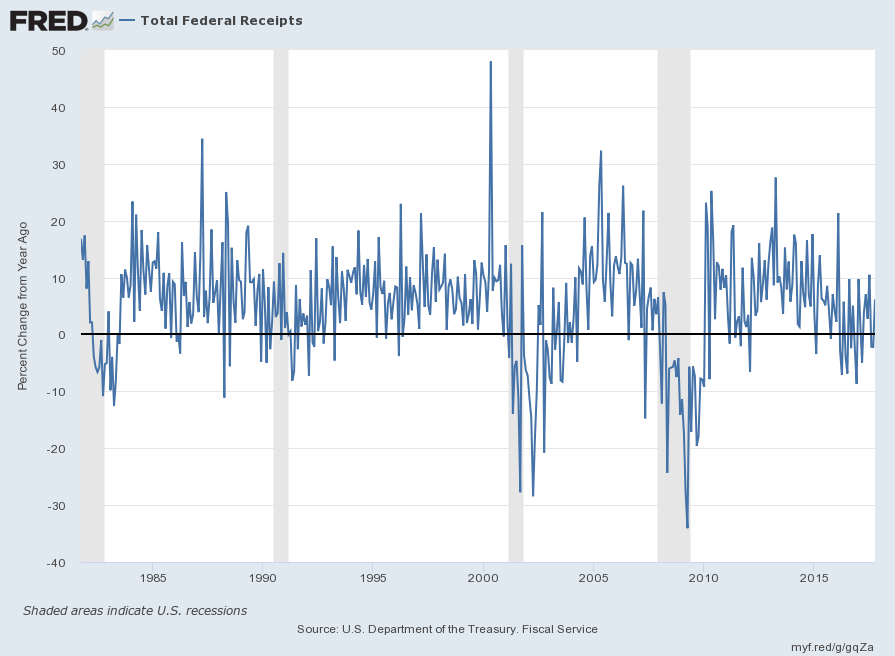
source: U.S. Department of the Treasury. Fiscal Service, Total Federal Receipts [MTSR133FMS], retrieved from FRED, Federal Reserve Bank of St. Louis December 6, 2017:
–
Manufacturer’s New Orders – Durable Goods
Shown below is “Manufacturer’s New Orders -Durable Goods,” through October with last value of $237,375 Million, displayed on a “Percent Change From Year Ago” basis with value 1.6%, last updated December 4, 2017:
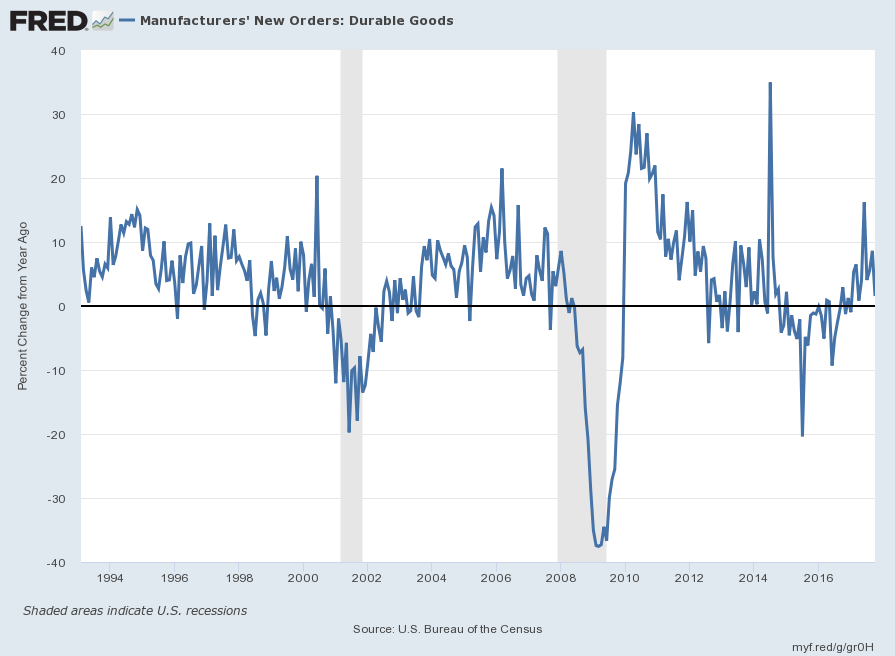
source: U.S. Bureau of the Census, Manufacturers’ New Orders: Durable Goods [DGORDER], retrieved from FRED, Federal Reserve Bank of St. Louis December 6, 2017:
–
Commercial And Industrial Loans, All Commercial Banks
Shown below is “Commercial And Industrial Loans, All Commercial Banks” through October with last value of $2,122.6193 Billion, displayed on a “Percent Change From Year Ago” basis with value of 1.2%, last updated December 1, 2017:
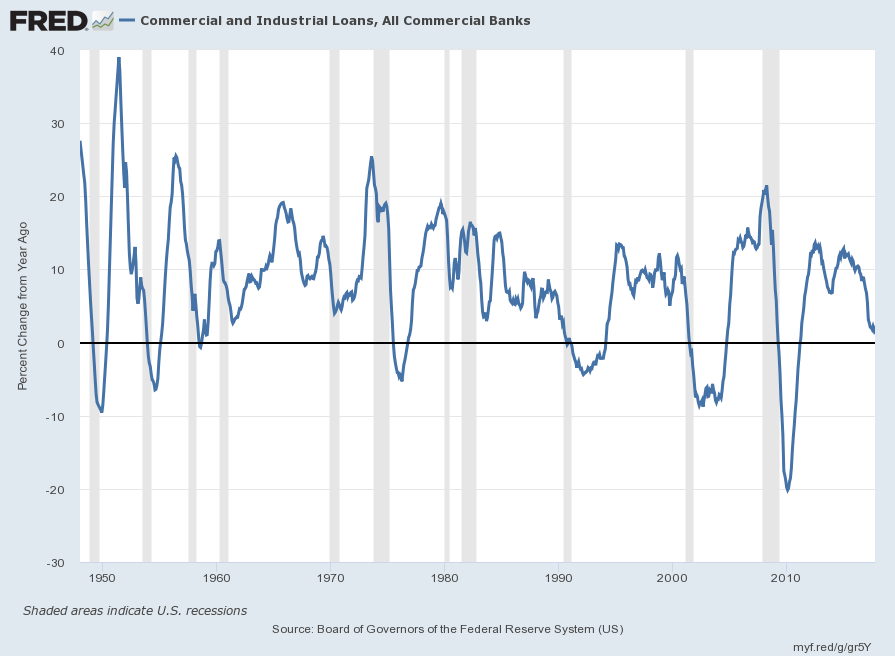
source: Board of Governors of the Federal Reserve System (US), Commercial and Industrial Loans, All Commercial Banks [BUSLOANS], retrieved from FRED, Federal Reserve Bank of St. Louis December 6, 2017:
–
The Yield Curve
Many people believe that the Yield Curve is a leading economic indicator for the United States economy.
On March 1, 2010, I wrote a post on the issue, titled “The Yield Curve As A Leading Economic Indicator.”
While I continue to have the above-stated reservations regarding the “yield curve” as an indicator, I do believe that it should be monitored.
Below is a yield-curve proxy chart showing the spread between the 10-Year Treasury and 2-Year Treasury using constant maturity securities. This daily chart is from June 1, 1976 through December 7, 2017, with recessionary periods shown in gray. This chart shows a value of .57%:
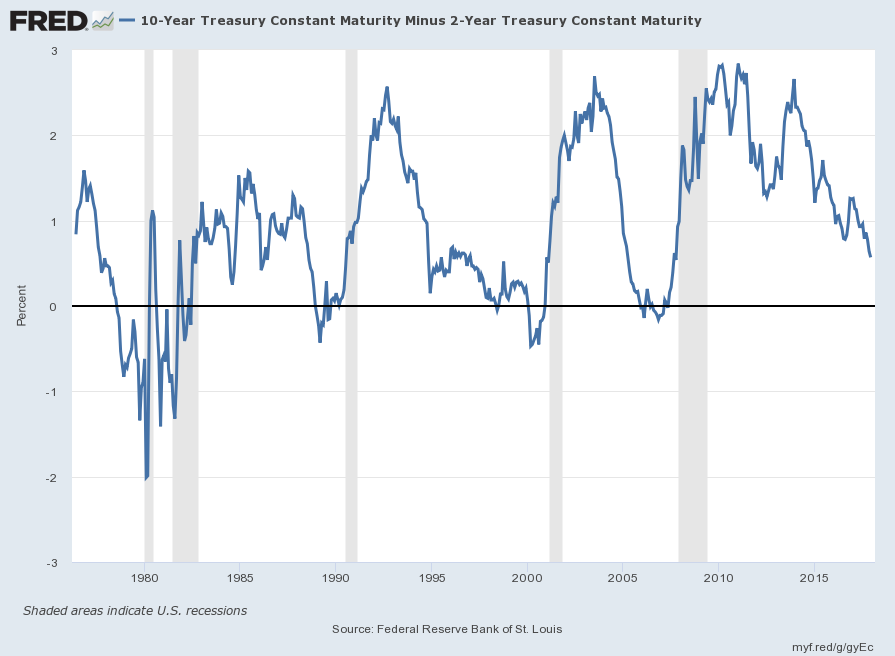
source: Federal Reserve Bank of St. Louis, 10-Year Treasury Constant Maturity Minus 2-Year Treasury Constant Maturity [T10Y2Y], retrieved from FRED, Federal Reserve Bank of St. Louis December 10, 2017:
–
Population Growth
Shown below is a long-term chart of population growth on a “Percent Change From A Year Ago” basis with value .7%. The declining nature of the growth rate is notable and may in itself deserve consideration as an economic indicator:
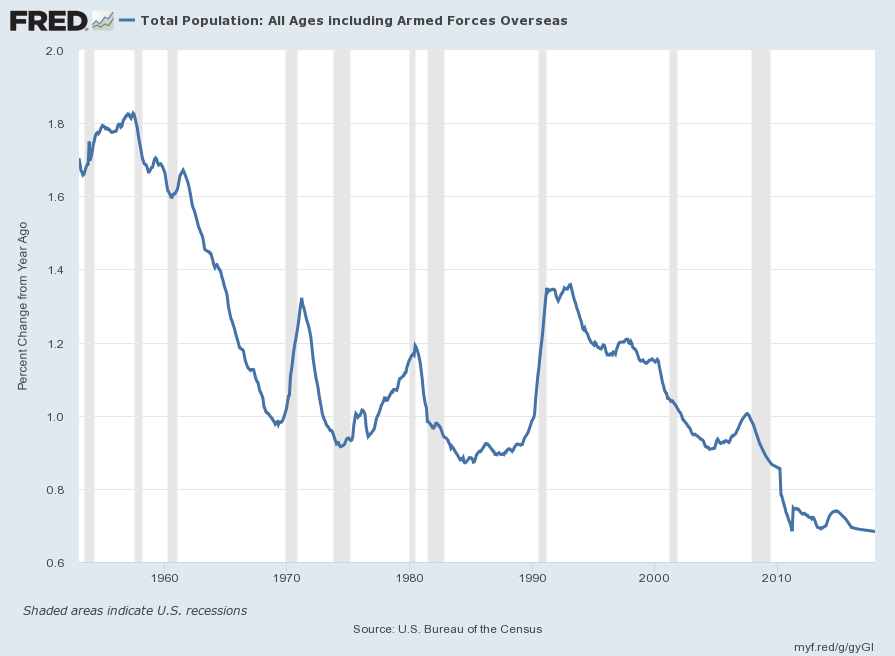
source: U.S. Bureau of the Census, Total Population: All Ages including Armed Forces Overseas [POP], retrieved from FRED, Federal Reserve Bank of St. Louis December 10, 2017:
_____
The Special Note summarizes my overall thoughts about our economic situation
SPX at 2659.99 as this post is written
No comments:
Post a Comment