U.S. Economic Indicators
Throughout this site there are many discussions of economic indicators. At this time, the readings of various indicators are especially notable. This post is the latest in a series of posts indicating U.S. economic weakness or a notably low growth rate.
While many U.S. economic indicators – including GDP – are indicating economic growth, others depict (or imply) various degrees of weak growth or economic contraction. The Gross Domestic Product Q4 2017 Advance Estimate (pdf) of January 26, 2018 was 2.6%, and as seen in the February 2018 Wall Street Journal Economic Forecast Survey the consensus among various economists is for 2.8% GDP growth in 2018. However, there are other broad-based economic indicators that seem to imply a weaker growth rate. As well, it should be remembered that GDP figures can be (substantially) revised.
Charts Indicating U.S. Economic Weakness
Below are a small sampling of charts that depict greater degrees of weakness and/or other worrisome trends, and a brief comment for each:
Total Private Construction Spending
Various measures of construction continue to show weak growth and/or contraction.
“Total Private Construction Spending” through December had a last value of $963,247 Million. Shown below is the measure displayed on a “Percent Change From Year Ago” basis with value 2.1%, last updated February 1, 2018:
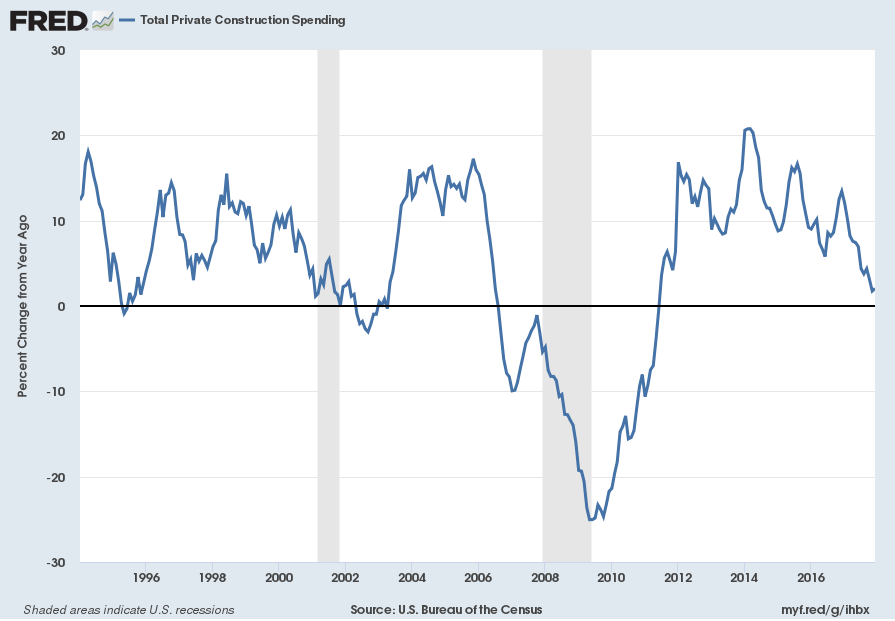
source: U.S. Bureau of the Census, Total Private Construction Spending [TLPRVCONS], retrieved from FRED, Federal Reserve Bank of St. Louis accessed February 9, 2018:
Total Federal Receipts
“Total Federal Receipts” growth continues to be intermittent in nature since 2015.
“Total Federal Receipts” through January had a last value of $361,038 Million. Shown below is displayed on a “Percent Change From Year Ago” basis with value 4.9%, last updated February 12, 2018:
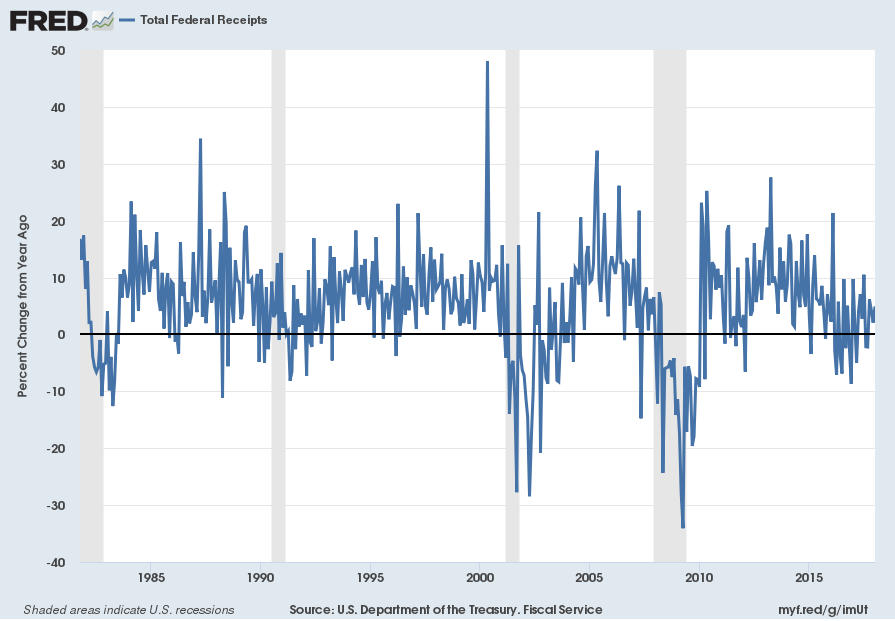
source: U.S. Department of the Treasury. Fiscal Service, Total Federal Receipts [MTSR133FMS], retrieved from FRED, Federal Reserve Bank of St. Louis February 12, 2018:
__
Commercial And Industrial Loans, All Commercial Banks
“Commercial And Industrial Loans, All Commercial Banks” through January had a last value of $2126.943 Billion. Shown below is the measure displayed on a “Percent Change From Year Ago” basis with value 1.2%, last updated February 9, 2018:
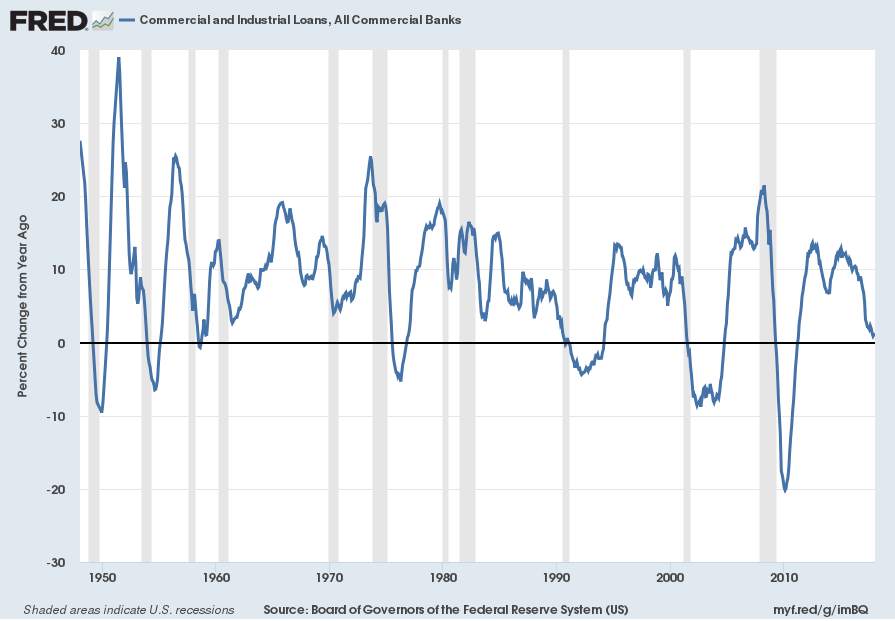
source: Board of Governors of the Federal Reserve System (US), Commercial and Industrial Loans, All Commercial Banks [BUSLOANS], retrieved from FRED, Federal Reserve Bank of St. Louis February 9, 2018:
__
Employment
I have written extensively concerning unemployment, as the current and future unemployment issue is of tremendous importance.
The consensus belief is that employment is robust, citing total nonfarm payroll growth and the current unemployment rate of 4.1%. However, my analyses continue to indicate that the conclusion that employment is strong is incorrect. Of particular note is the unemployment rate, which indicates that unemployment is (very) low. Closer examination indicates that this metric is, for a number of reasons, highly misleading.
My analyses indicate that the underlying dynamics of the unemployment situation remain exceedingly worrisome, especially with regard to the future. These dynamics are numerous and complex, and greatly lack recognition and understanding, especially as how from an “all-things-considered” standpoint they will progress in an economic and societal manner. I have recently written of the current and future U.S. employment situation on the “U.S. Employment Trends” page.
While there are many charts that can be shown, one that depicts a worrisome trend is the Civilian Labor Force Participation Rate for those with Bachelor’s Degrees and Higher, Ages 25 and Above. The current value as of the February 2, 2018 update (reflecting data through the January employment report) is 73.4%:
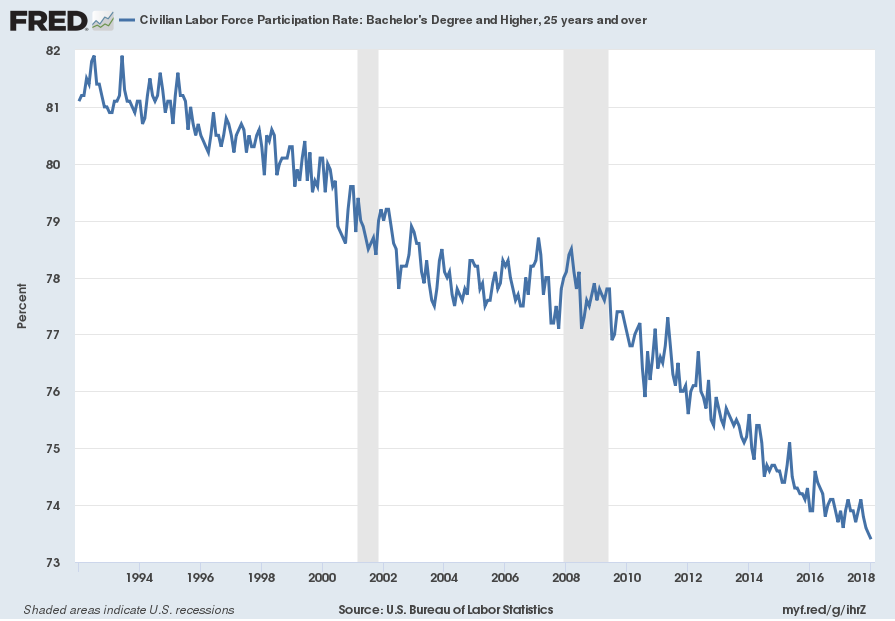
source: U.S. Bureau of Labor Statistics, Civilian Labor Force Participation Rate: Bachelor’s Degree and Higher, 25 years and over [LNS11327662], retrieved from FRED, Federal Reserve Bank of St. Louis, February 9, 2018:
__
Productivity Measures
While I have expressed concerns about the overall definitions and value of productivity measures in the past, I do find the current-era trends to be disconcerting.
One such chart that shows a subdued level of a productivity measure is that of “Manufacturing, Real Output Per Hour.” Through the fourth quarter the last value was 109.101. Shown below is the measure displayed on a “Percent Change From Year Ago” basis with value 1.1%, last updated February 1, 2018:
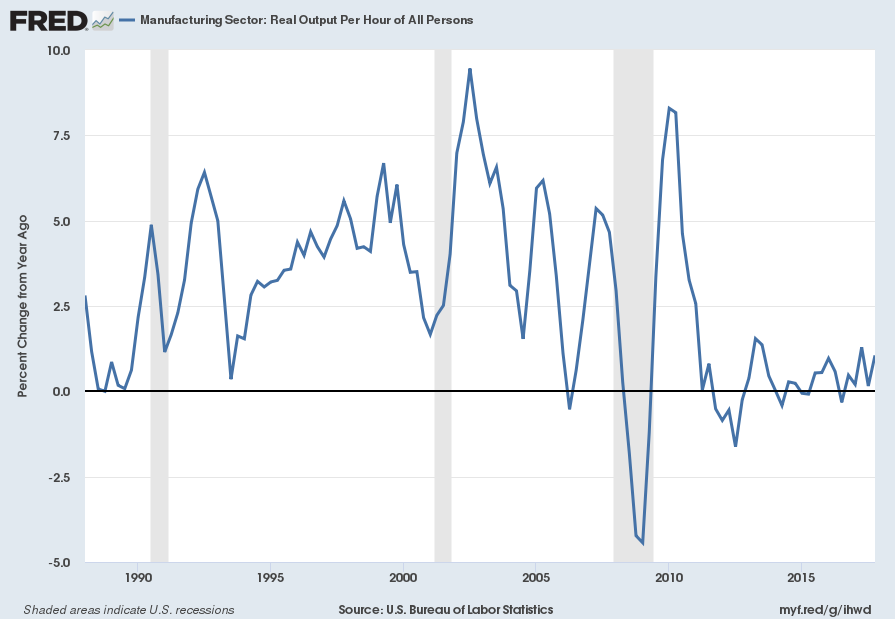
source: U.S. Bureau of Labor Statistics, Manufacturing Sector: Real Output Per Hour of All Persons [OPHMFG], retrieved from FRED, Federal Reserve Bank of St. Louis February 12, 2018:
__
Other Indicators
As mentioned previously, many other indicators discussed on this site indicate economic weakness or economic contraction, if not outright (gravely) problematical economic conditions.
_____
The Special Note summarizes my overall thoughts about our economic situation
SPX at 2656.00 as this post is written
No comments:
Post a Comment