Many people believe that the Yield Curve is an important economic indicator.
On March 1, 2010, I wrote a post on the issue, titled “The Yield Curve As A Leading Economic Indicator.”
An excerpt from that post:
On the NY Fed link above, they have posted numerous studies that support the theory that the yield curve is a leading indicator. My objections with using it as a leading indicator, especially now, are various. These objections include: I don’t think such a narrow measure is one that can be relied upon; both the yields at the short and long-end of the curve have been overtly and officially manipulated, thus distorting the curve; and, although the yield curve may have been an accurate leading indicator in the past, this period of economic weakness is inherently dissimilar in nature from past recessions and depressions in a multitude of ways – thus, historical yardsticks and metrics probably won’t (and have not) proven appropriate.
While I continue to have the above-stated reservations regarding the “yield curve” as an indicator, I do believe that it should be monitored.
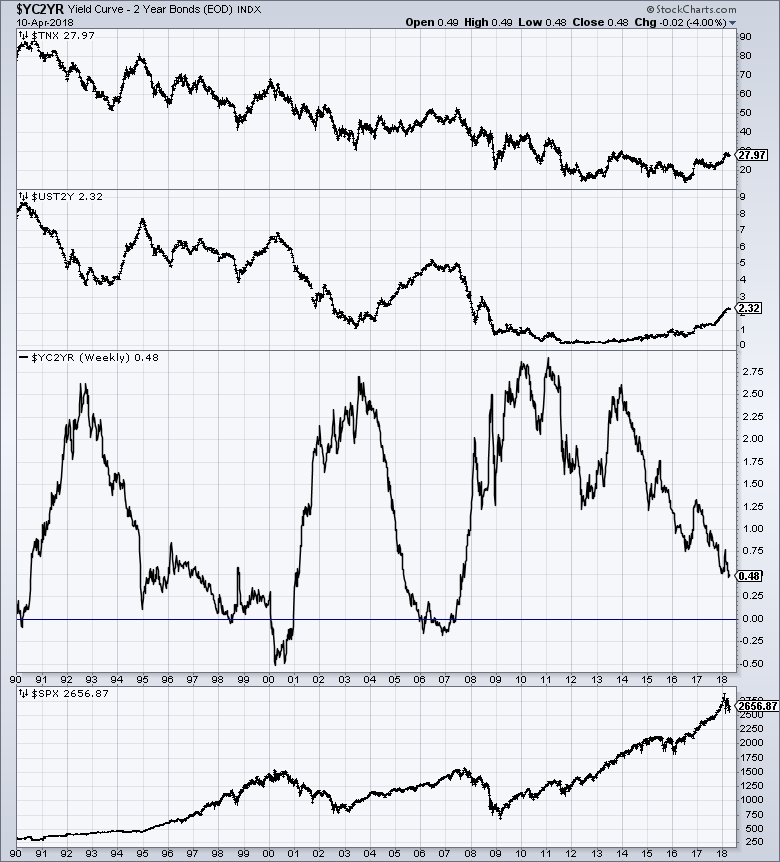
As an indication of the yield curve, below is a weekly chart from January 1, 1990 through April 10, 2018. The top two plots show the 10-Year Treasury and 2-Year Treasury yields. The third plot shows the (yield) spread between the 10-Year Treasury and 2-Year Treasury, with the April 10, 2018 closing value of .48%. The bottom plot shows the S&P500:
(click on chart to enlarge image)(chart courtesy of StockCharts.com; chart creation and annotation by the author)
Additionally, below is a chart showing the same spread between the 10-Year Treasury and 2-Year Treasury, albeit with a slightly different measurement, using constant maturity securities. This daily chart is from June 1, 1976 through April 9, 2018 (updated April 10, 2018) with recessionary periods shown in gray. This chart shows a value of .49%:
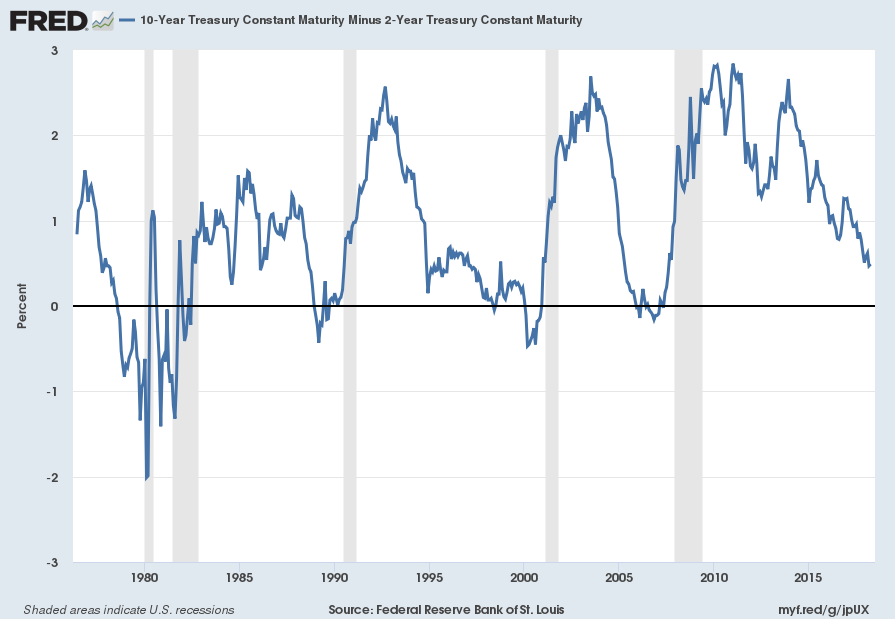
source: Federal Reserve Bank of St. Louis, 10-Year Treasury Constant Maturity Minus 2-Year Treasury Constant Maturity [T10Y2Y], retrieved from FRED, Federal Reserve Bank of St. Louis; accessed April 11, 2018:
_____
The Special Note summarizes my overall thoughts about our economic situation
SPX at 2656.87 as this post is written
No comments:
Post a Comment