U.S. Economic Indicators
Throughout this site there are many discussions of economic indicators. At this time, the readings of various indicators are especially notable. This post is the latest in a series of posts indicating U.S. economic weakness or a notably low growth rate.
While many U.S. economic indicators – including GDP – are indicating economic growth, others depict (or imply) various degrees of weak growth or economic contraction. As seen in the August 2018 Wall Street Journal Economic Forecast Survey the consensus (average estimate) among various economists is for 3.0% GDP growth in 2018 and 2.4% GDP growth in 2019. However, there are other broad-based economic indicators that seem to imply a weaker growth rate.
As well, it should be remembered that GDP figures can be (substantially) revised.
Charts Indicating U.S. Economic Weakness
Below are a small sampling of charts that depict weak growth or contraction, and a brief comment for each:
Total Federal Receipts
“Total Federal Receipts” growth continues to be intermittent in nature since 2015. As well, the level of growth does not seem congruent to the (recent) levels of economic growth as seen in aggregate measures such as Real GDP.
“Total Federal Receipts” through July had a last value of $225,266 Million. Shown below is the measure displayed on a “Percent Change From Year Ago” basis with value -2.9%, last updated August 10, 2018:
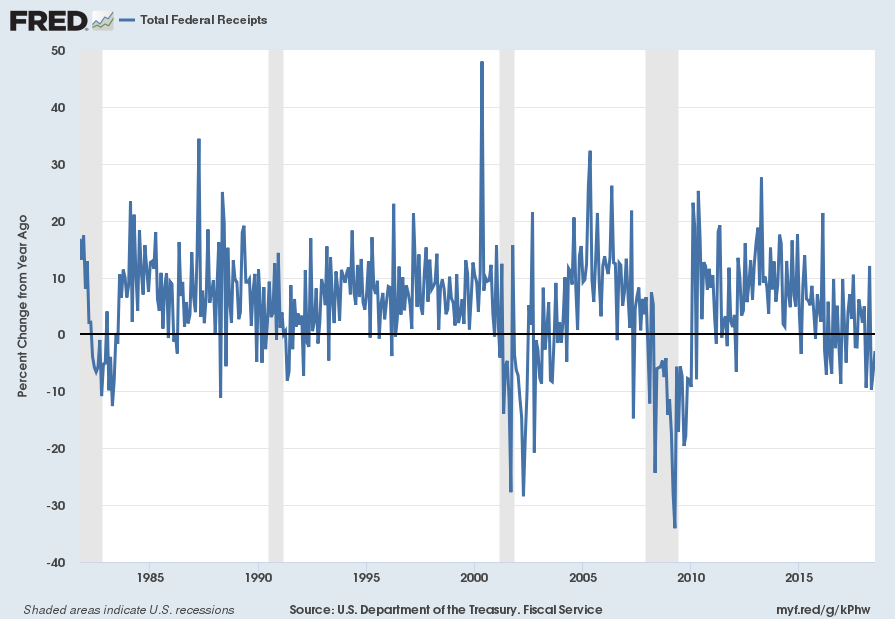
source: U.S. Department of the Treasury. Fiscal Service, Total Federal Receipts [MTSR133FMS], retrieved from FRED, Federal Reserve Bank of St. Louis, accessed August 11, 2018:
__
Taxes On Corporate Income
Another measure that depicts weakness is that of “Federal government current tax receipts: Taxes on corporate income.” Through the first quarter the value is $149.029 Billion. Shown below is the chart, last updated July 27, 2018:
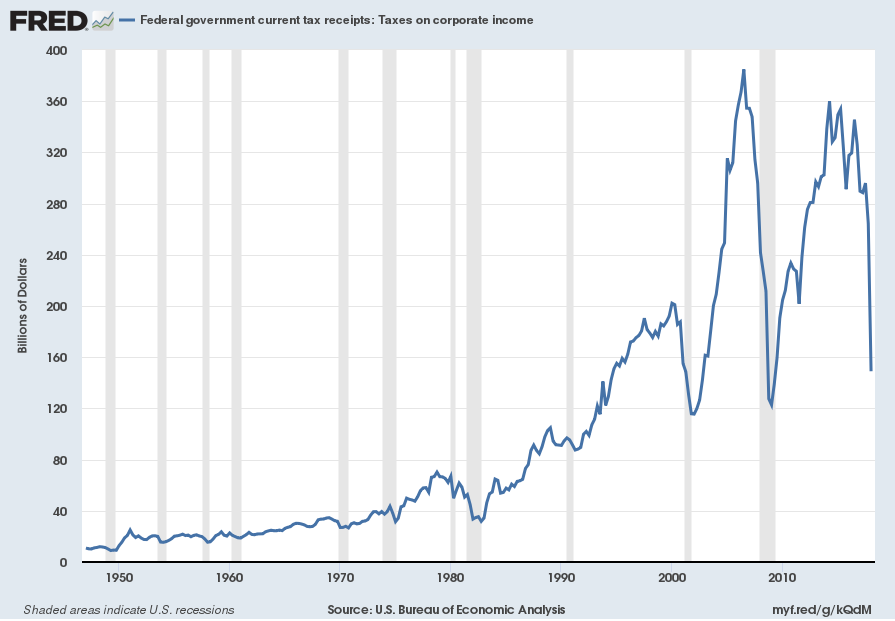
source: U.S. Bureau of Economic Analysis, Federal government current tax receipts: Taxes on corporate income [B075RC1Q027SBEA], retrieved from FRED, Federal Reserve Bank of St. Louis; accessed August 9, 2018:
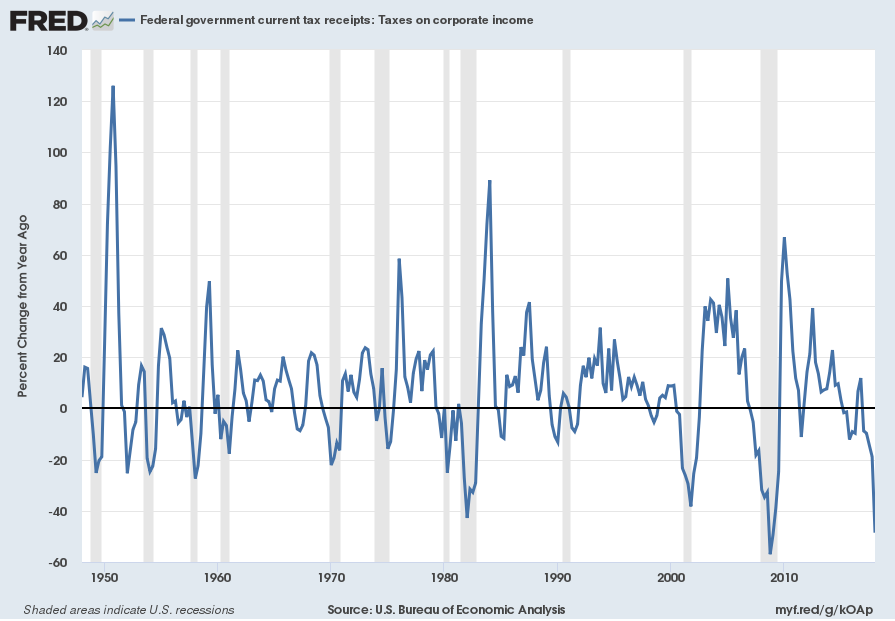
Here is a chart of the measure, on a “Percent Change From Year Ago” basis with value of -48.6%, through the first quarter, last updated July 27, 2018:
__
The Aruoba-Diebold-Scotti Business Conditions Index (ADS Index)
While the 2nd quarter GDP (Advance Estimate)(pdf) was 4.1%, there are other broad-based economic indicators that seem to imply a weaker growth rate.
Among the broad-based economic indicators that imply weaker growth is that of the Aruoba-Diebold-Scotti Business Conditions Index (ADS Index.) Below is a two-year chart of the index through August 4, 2018, with a value of .047, as of the August 8 update:
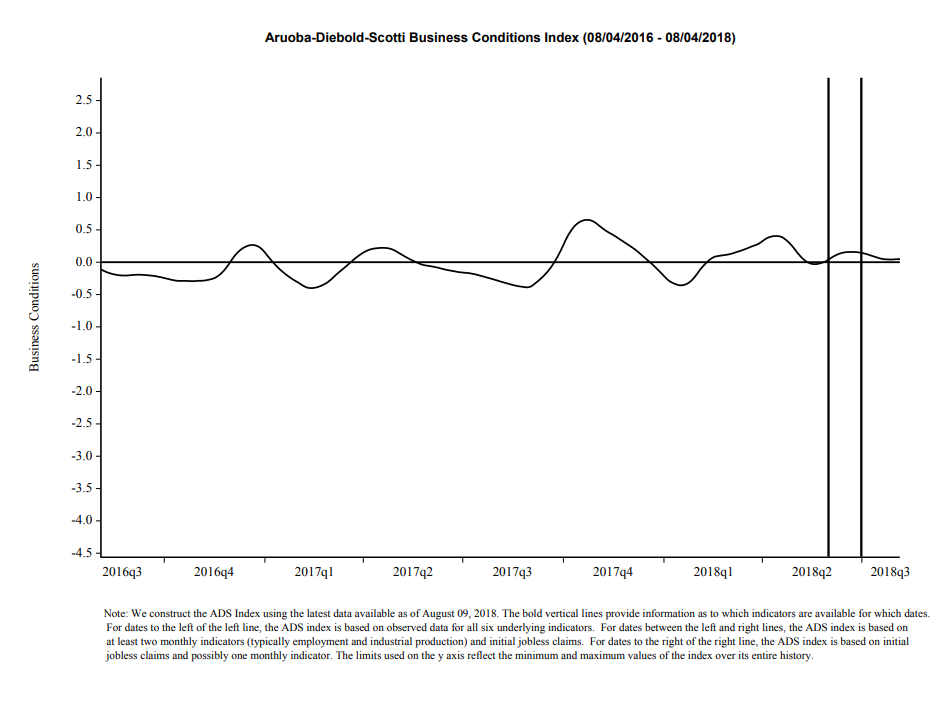
source: Federal Reserve Bank of Philadelphia, Aruoba-Diebold-Scotti Business Conditions Index(ADS Index)
__
Total Construction Spending: Commercial
“Total Construction Spending: Commercial” is a measure of construction exhibiting weak YoY growth. This measure through June had a last value of $90,991 Million. Shown below is the measure displayed on a “Percent Change From Year Ago” basis with a value of 1.1%, last updated August 1, 2018:
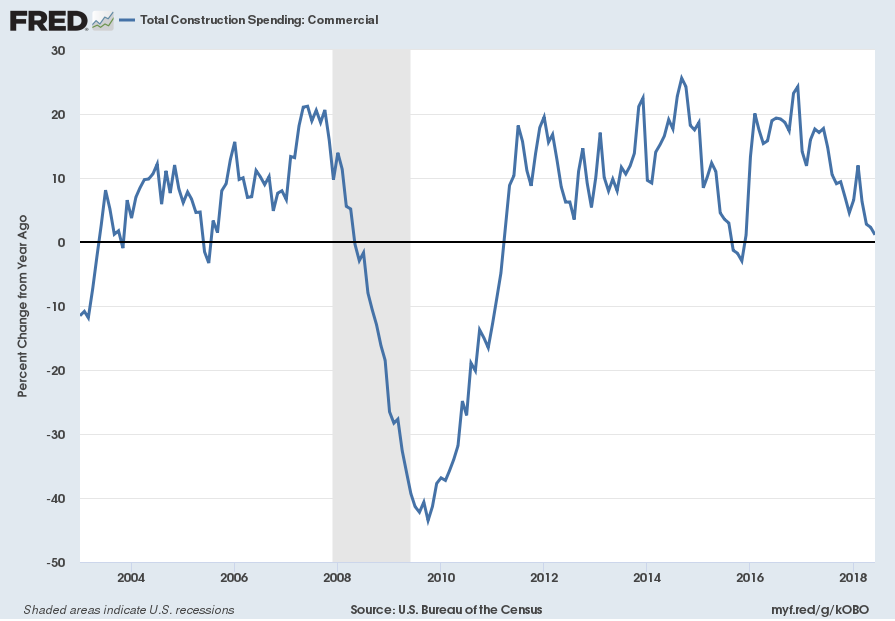
source: U.S. Bureau of the Census, Total Construction Spending: Commercial [TLCOMCONS], retrieved from FRED, Federal Reserve Bank of St. Louis, accessed August 9, 2018:
__
Real Hourly Earnings
The level and growth rates of wages and household earnings continues to be (highly) problematical. I have extensively discussed these worrisome trends in income and earnings.
As seen in many measures the problem is chronic (i.e long-term) in nature.
Shown below is a chart depicting the 12-month percent change in real average hourly and weekly earnings for private sector employees from June 2008 – June 2018. (July 2018 was unchanged from June 2018, and it decreased .2% YoY (i.e. compared to July 2017.)) As seen in the chart below, growth in this measure over the time period depicted has been intermittent, volatile, and, especially since 2017, weak:
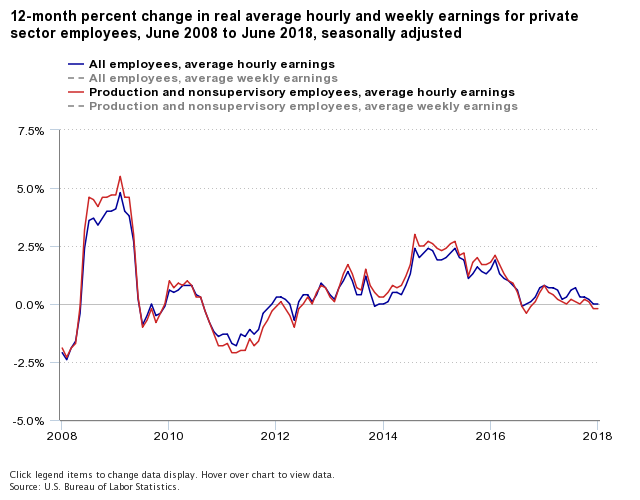
source: Bureau of Labor Statistics, U.S. Department of Labor, The Economics Daily, Real average hourly earnings unchanged from June 2017 to June 2018 on the Internet at https://www.bls.gov/opub/ted/2018/real-average-hourly-earnings-unchanged-from-june-2017-to-june-2018.htm(visited August 10, 2018).
__
Other Indicators
As mentioned previously, many other indicators discussed on this site indicate economic weakness or economic contraction, if not outright (gravely) problematical economic conditions.
_____
The Special Note summarizes my overall thoughts about our economic situation
SPX at 2833.28 as this post is written
No comments:
Post a Comment