U.S. Economic Indicators
Throughout this site there are many discussions of economic indicators. At this time, the readings of various indicators are especially notable. This post is the latest in a series of posts indicating U.S. economic weakness or a notably low growth rate.
While many U.S. economic indicators – including GDP – are indicating economic growth, others depict (or imply) various degrees of weak growth or economic contraction. As seen in the February 2019 Wall Street Journal Economic Forecast Survey the consensus (average estimate) among various economists is for 3.0% GDP growth in 2018 and 2.2% GDP growth in 2019. However, there are other broad-based economic indicators that seem to imply a weaker growth rate.
As well, it should be remembered that GDP figures can be (substantially) revised.
Charts Indicating U.S. Economic Weakness
Below are a small sampling of charts that depict weak growth or contraction, and a brief comment for each:
Total Federal Receipts
“Total Federal Receipts” growth continues to be intermittent in nature since 2015. As well, the level of growth does not seem congruent to the (recent) levels of economic growth as seen in aggregate measures such as Real GDP.
“Total Federal Receipts” through December had a last value of $312,584 Million. Shown below is the measure displayed on a “Percent Change From Year Ago” basis with value -4.1%, last updated February 13, 2019:
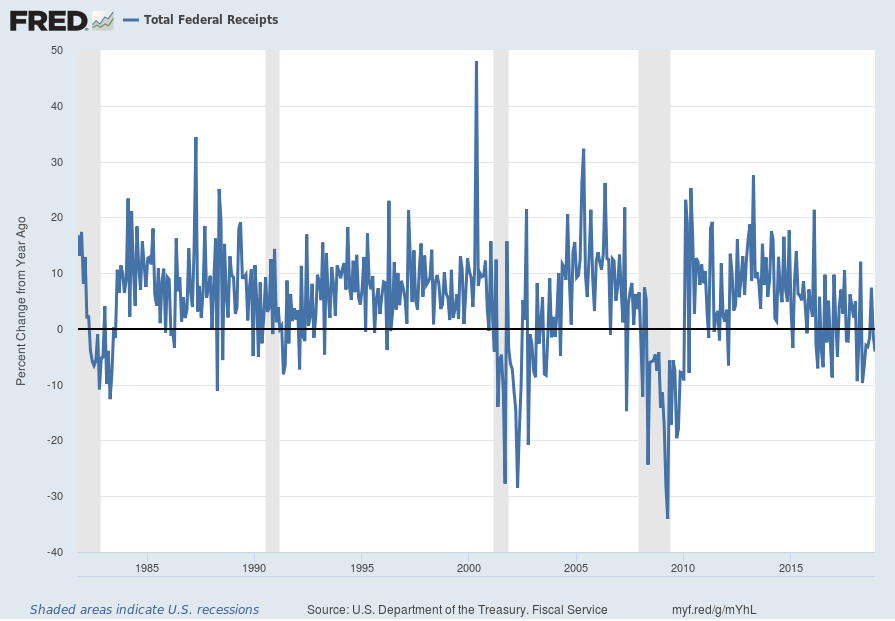
source: U.S. Department of the Treasury. Fiscal Service, Total Federal Receipts [MTSR133FMS], retrieved from FRED, Federal Reserve Bank of St. Louis, accessed February 13, 2019:
https://fred.stlouisfed.org/series/MTSR133FMS
https://fred.stlouisfed.org/series/MTSR133FMS
__
Loan Demand And Related Measures
As seen in previous updates, various aspects of lending growth and related measures have shown a contraction. Shown below is a measure, Net Percentage of Domestic Banks Reporting Stronger Demand for Credit Card Loans, that shows a decline. The current value is -17.4% as of the February 4, 2019 quarterly update:
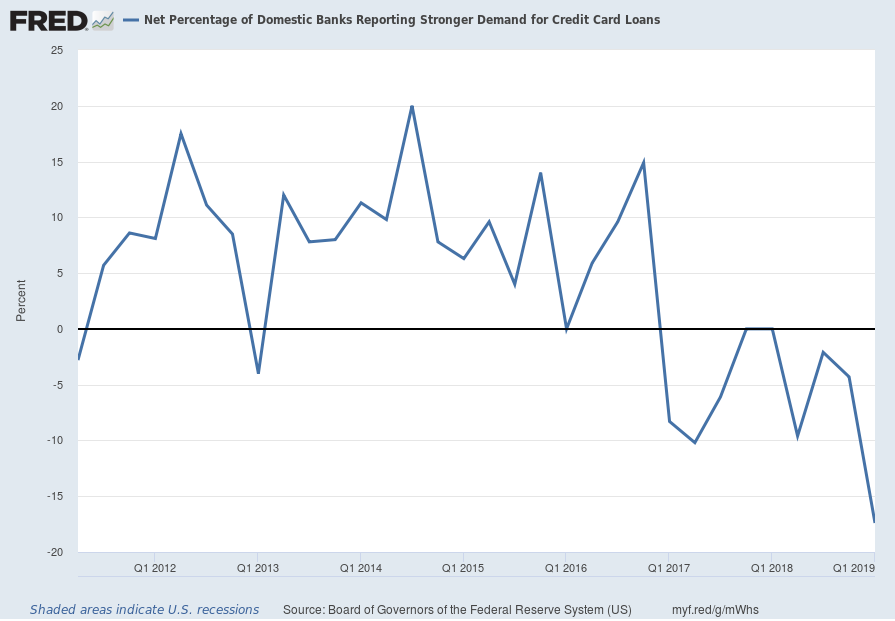
source: Board of Governors of the Federal Reserve System (US), Net Percentage of Domestic Banks Reporting Stronger Demand for Credit Card Loans [DEMCC], retrieved from FRED, Federal Reserve Bank of St. Louis; accessed February 11, 2019:
https://fred.stlouisfed.org/series/DEMCC
https://fred.stlouisfed.org/series/DEMCC
__
Vehicle Miles Traveled
I continue to find the flagging growth trend in the “Vehicle Miles Traveled” (NSA) measure since 2015 to be notable.
“Vehicle Miles Traveled” through November had a last value of 258,533 Million. Shown below is the measure displayed on a “Percent Change From Year Ago” basis with value .3%, last updated January 17, 2019:
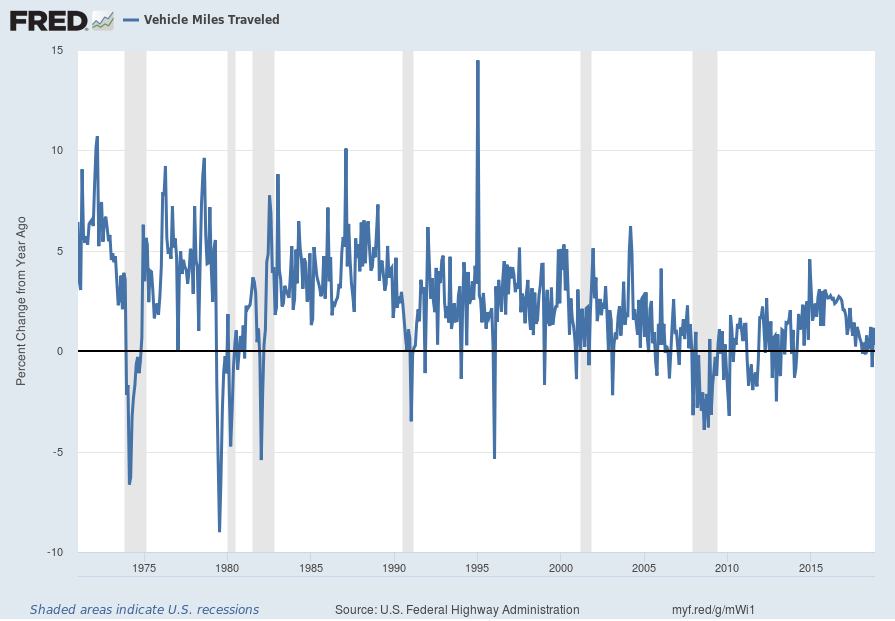
source: U.S. Federal Highway Administration, Vehicle Miles Traveled [TRFVOLUSM227NFWA], retrieved from FRED, Federal Reserve Bank of St. Louis; accessed February 11, 2019:https://fred.stlouisfed.org/series/TRFVOLUSM227NFWA
__
Total Construction Spending: Commercial
“Total Construction Spending: Commercial” is a measure of construction exhibiting a contraction on a “Percent Change From Year Ago” basis. This measure through November had a last value of $87,459 Million. Shown below is the measure displayed on a “Percent Change From Year Ago” basis with a value of -.4%, last updated February 5, 2019:
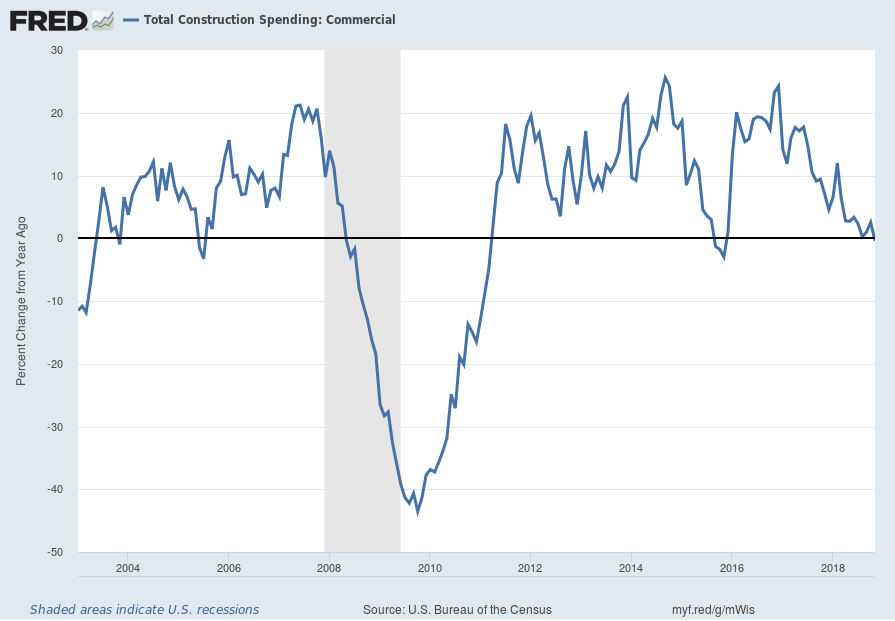
source: U.S. Bureau of the Census, Total Construction Spending: Commercial [TLCOMCONS], retrieved from FRED, Federal Reserve Bank of St. Louis, accessed February 11, 2019:https://fred.stlouisfed.org/series/TLCOMCONS
__
Rail Freight Carloads
“Rail Freight Carloads” continues to show a downward progression. Shown below is a chart with data through November (last value of 1,115,510, updated January 15, 2019):
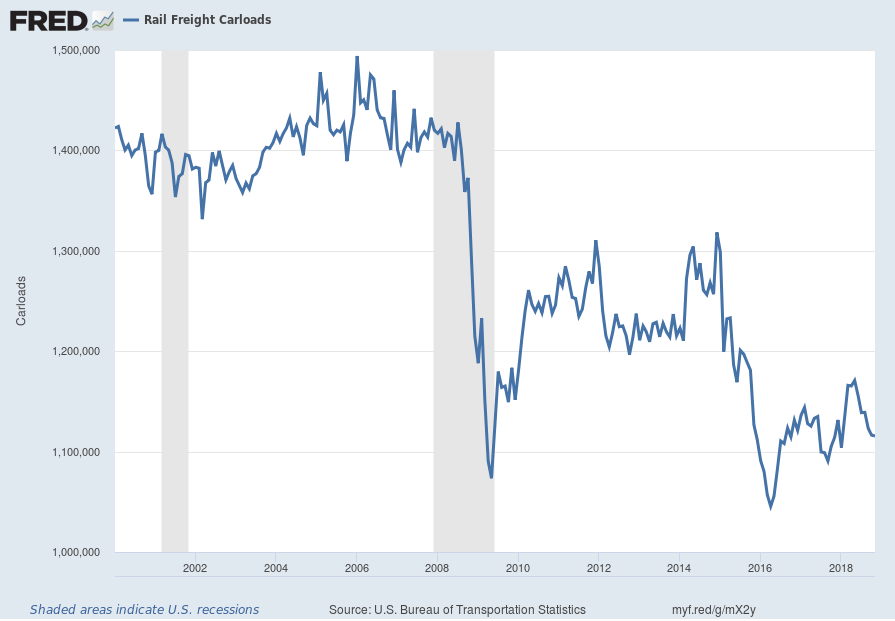
source: U.S. Bureau of Transportation Statistics, Rail Freight Carloads [RAILFRTCARLOADSD11], retrieved from FRED, Federal Reserve Bank of St. Louis; accessed February 12, 2019:https://fred.stlouisfed.org/series/RAILFRTCARLOADSD11
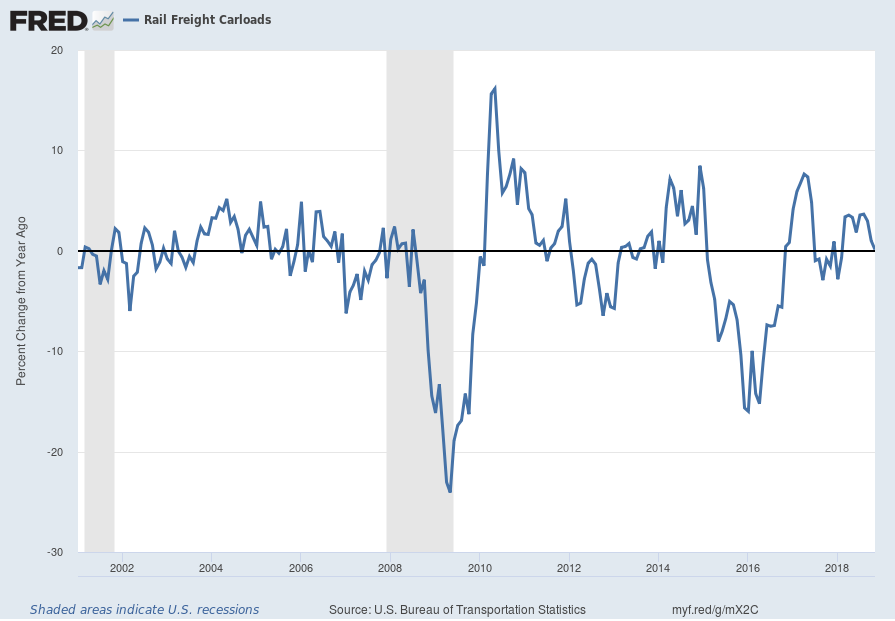
Here is the same measure on a “Percent Change From Year Ago” basis, with value .1%:
__
Other Indicators
As mentioned previously, many other indicators discussed on this site indicate weak economic growth or economic contraction, if not outright (gravely) problematical economic conditions.
_____
The Special Note summarizes my overall thoughts about our economic situation
SPX at 2753.03 as this post is written
No comments:
Post a Comment