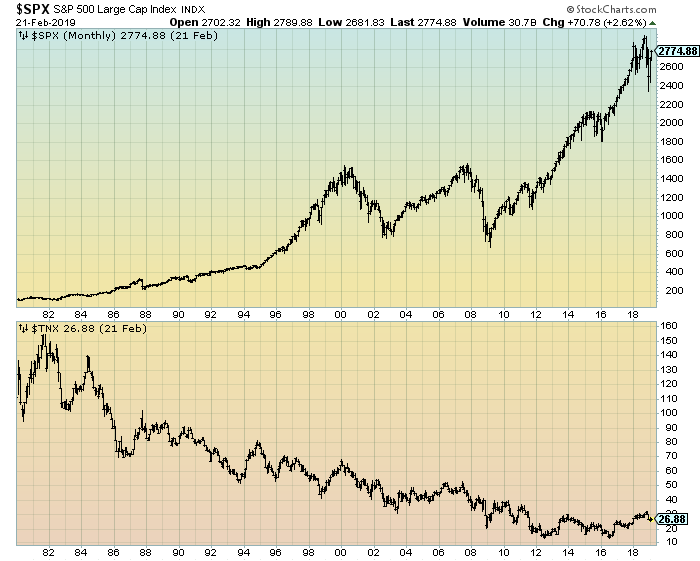
As reference, here is a long-term chart of the S&P500 (top plot) and 10-Year U.S. Treasury yield (bottom plot) since 1980, depicted on a monthly basis through the February 21, 2019 closing values:
(click on charts to enlarge images)(charts courtesy of StockCharts.com; chart creation and annotation by the author)
_____
The Special Note summarizes my overall thoughts about our economic situation
SPX at 2791.78 as this post is written
No comments:
Post a Comment