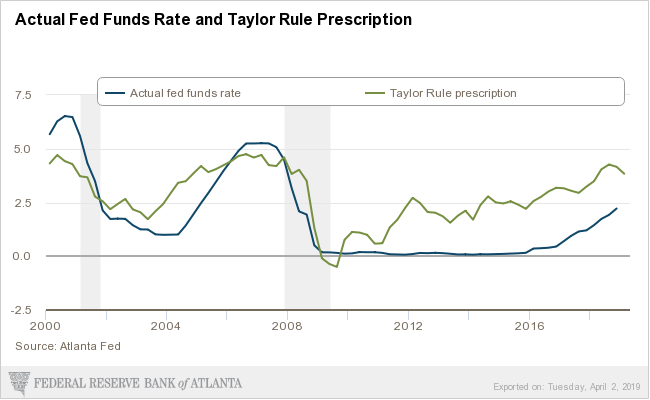
On January 9, 2017 I wrote a post (“Low Interest Rates And The Formation Of Asset Bubbles“) that mentioned the “Taylor Rule.” As discussed in that post – and for other reasons – the level of the Fed Funds rate – and whether its level is appropriate – has vast importance and far-reaching consequences with regard to many aspects of the economy and financial system.
For reference, below is an updated chart depicting the “Taylor Rule” prescription and the actual Fed Funds rate, provided by the Federal Reserve Bank of Atlanta, updated as of March 29, 2019:
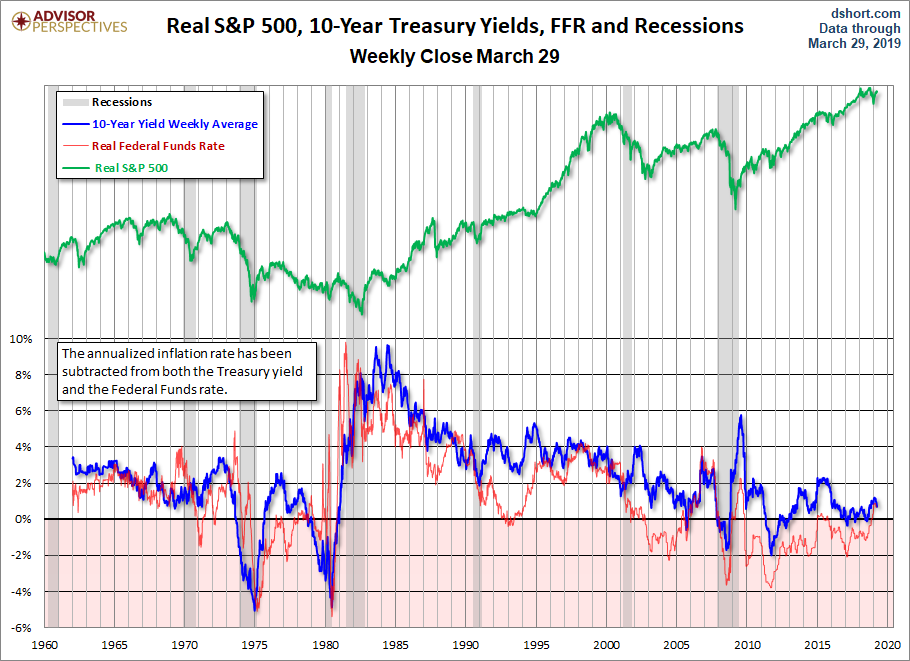
For additional reference, below is a long-term chart showing, among other measures, the Real Fed Funds rate. This chart is from the Doug Short site post of March 29, 2019 titled “Treasury Yields – A Long-Term Perspective.” Of particular note is the post-2000 persistently negative Real Fed Funds rate, which is shown in red:
_____
The Special Note summarizes my overall thoughts about our economic situation
SPX at 2867.24 as this post is written
No comments:
Post a Comment