U.S. Economic Indicators
Throughout this site there are many discussions of economic indicators. At this time, the readings of various indicators are especially notable. This post is the latest in a series of posts indicating U.S. economic weakness or a notably low growth rate.
While many U.S. economic indicators – including GDP – are indicating economic growth, others depict (or imply) various degrees of weak growth or economic contraction. As seen in the November 2019 Wall Street Journal Economic Forecast Survey the consensus (average estimate) among various economists is for 2.1% GDP growth in 2019 and 1.7% GDP growth in 2020. However, there are other broad-based economic indicators that seem to imply a weaker growth rate.
As well, it should be remembered that GDP figures can be (substantially) revised.
Charts Indicating U.S. Economic Weakness
Below are a small sampling of charts that depict weak growth or contraction, and a brief comment for each:
Total Federal Receipts
“Total Federal Receipts” growth continues to be intermittent in nature since 2015. As well, the level of growth does not seem congruent to the (recent) levels of economic growth as seen in aggregate measures such as Real GDP.
“Total Federal Receipts” through November had a last monthly value of $225,185 Million. Shown below is the measure displayed on a “Percent Change From Year Ago” basis with value 9.5%, last updated December 11, 2019:
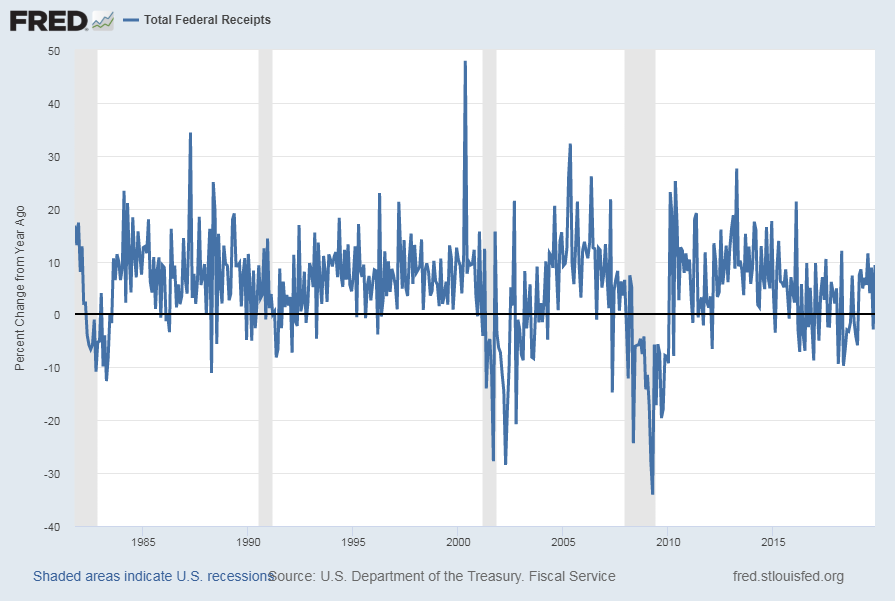
source: U.S. Department of the Treasury. Fiscal Service, Total Federal Receipts [MTSR133FMS], retrieved from FRED, Federal Reserve Bank of St. Louis; accessed December 11, 2019:
https://fred.stlouisfed.org/series/MTSR133FMS
https://fred.stlouisfed.org/series/MTSR133FMS
__
The Chicago Fed National Activity Index (CFNAI)
A broad-based economic indicator that has been implying weaker growth or mild contraction is the Chicago Fed National Activity Index (CFNAI).
The November 2019 Chicago Fed National Activity Index (CFNAI) updated as of November 25, 2019:
The CFNAI, with current reading of -.71:
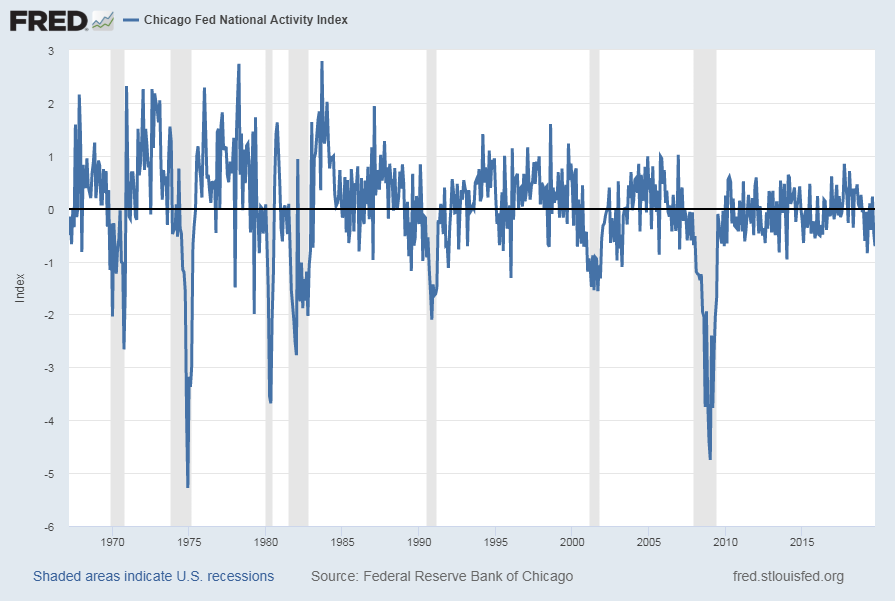
source: Federal Reserve Bank of Chicago, Chicago Fed National Activity Index [CFNAI], retrieved from FRED, Federal Reserve Bank of St. Louis, November 25, 2019;
https://fred.stlouisfed.org/series/CFNAI
https://fred.stlouisfed.org/series/CFNAI
The CFNAI-MA3, with current reading of -.31:
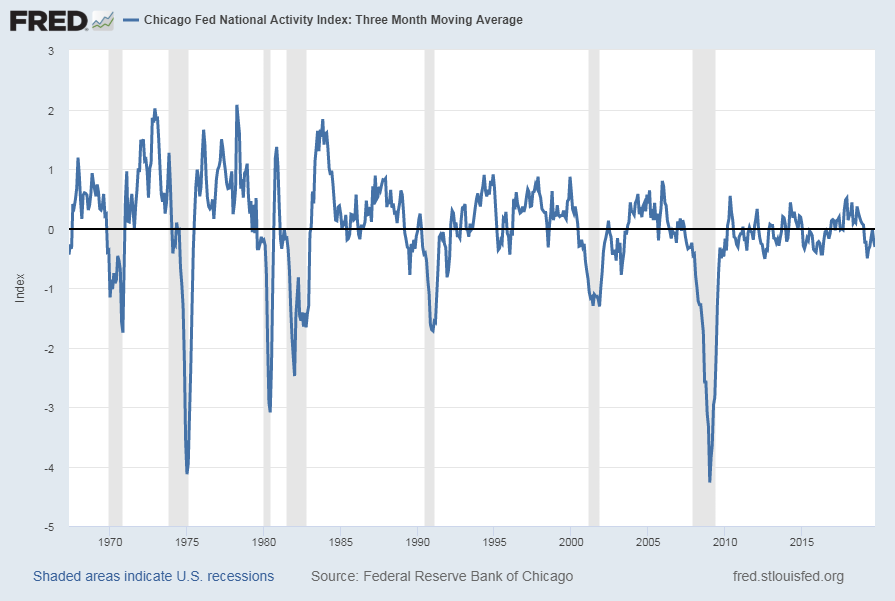
source: Federal Reserve Bank of Chicago, Chicago Fed National Activity Index: Three Month Moving Average [CFNAIMA3], retrieved from FRED, Federal Reserve Bank of St. Louis, November 25, 2019;
https://fred.stlouisfed.org/series/CFNAIMA3
https://fred.stlouisfed.org/series/CFNAIMA3
__
The Chicago Fed National Activity Index (CFNAI): Diffusion Index
A measure associated with the CFNAI is the CFNAI Diffusion Index. [This measure is defined in FRED at the following link: https://fred.stlouisfed.org/series/CFNAIDIFF]
Among notable aspects is how this measure’s post-2009 trend is different than that seen in previous economic expansions.
The CFNAIDIFF, with current reading of -.22:
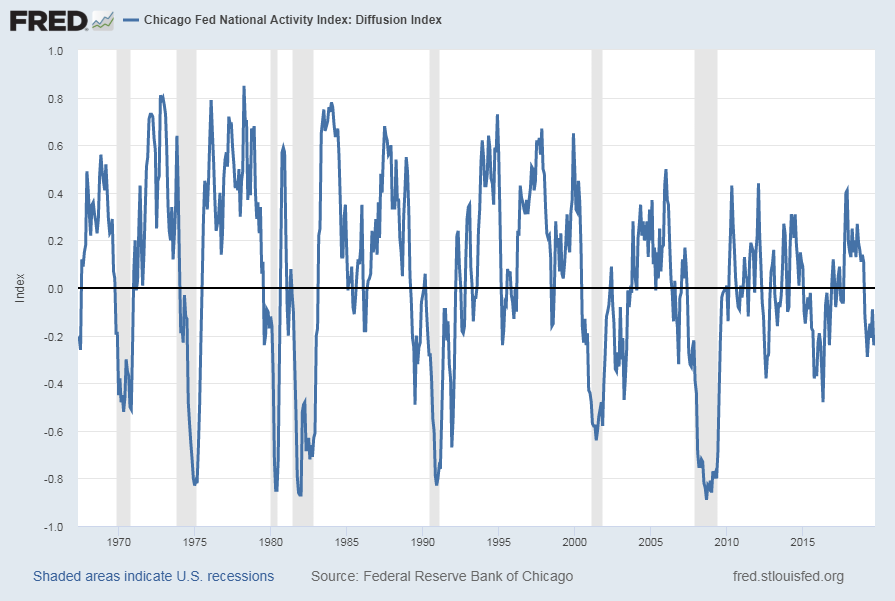
source: Federal Reserve Bank of Chicago, Chicago Fed National Activity Index: Diffusion Index [CFNAIDIFF], retrieved from FRED, Federal Reserve Bank of St. Louis, December 10, 2019;
https://fred.stlouisfed.org/series/CFNAIDIFF
https://fred.stlouisfed.org/series/CFNAIDIFF
__
The Aruoba-Diebold-Scotti Business Conditions Index (ADS Index)
Another broad-based economic indicator that seems to imply a weaker recent growth rate is the Aruoba-Diebold-Scotti Business Conditions Index (ADS Index.)
Below is a chart of the index from December 31, 2007 through December 7, 2019, with a value of -.2755, as of the December 12 update:
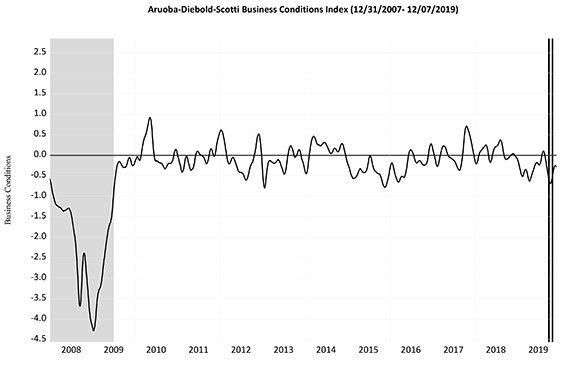
source: Federal Reserve Bank of Philadelphia, Aruoba-Diebold-Scotti Business Conditions Index (ADS Index)
__
Rail Freight Carloads
“Rail Freight Carloads” continues to show a generally downward progression from a longer-term perspective. Shown below is a chart with data through September (last value of 1,057,633, updated November 14, 2019):
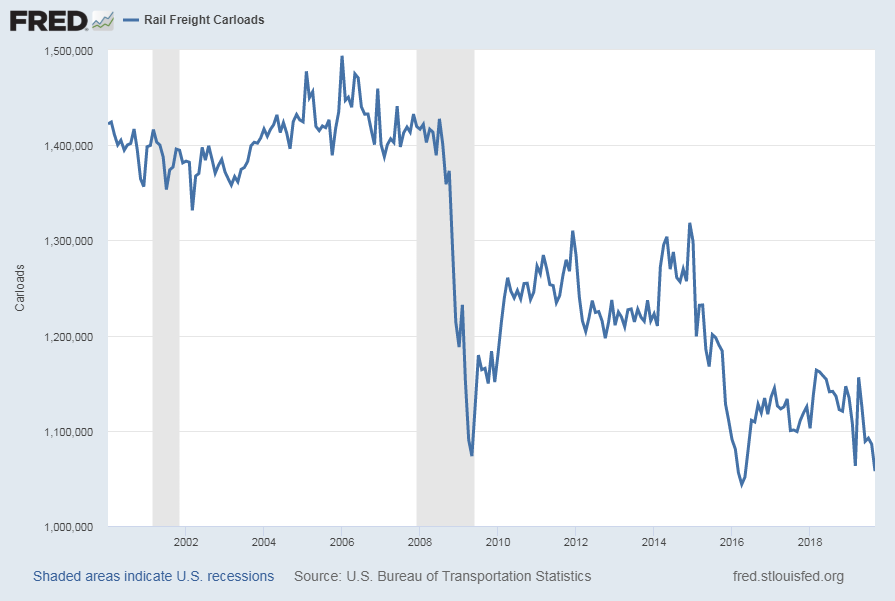
source: U.S. Bureau of Transportation Statistics, Rail Freight Carloads [RAILFRTCARLOADSD11], retrieved from FRED, Federal Reserve Bank of St. Louis; accessed December 11, 2019: https://fred.stlouisfed.org/series/RAILFRTCARLOADSD11
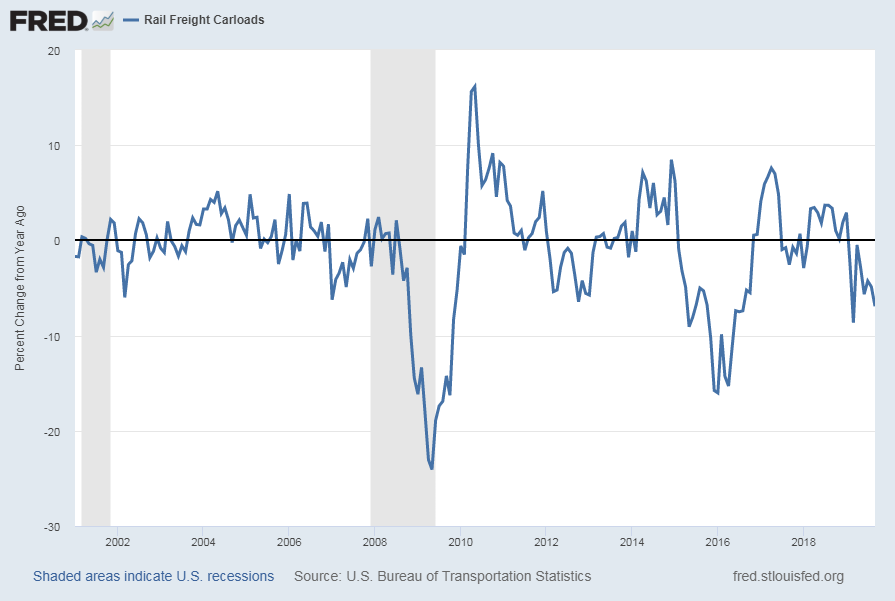
Here is the same measure on a “Percent Change From Year Ago” basis, with value -6.9%:
__
Other Indicators
As mentioned previously, many other indicators discussed on this site indicate economic weakness or economic contraction, if not outright (gravely) problematical economic conditions.
_____
The Special Note summarizes my overall thoughts about our economic situation
SPX at 3158.95 as this post is written
No comments:
Post a Comment