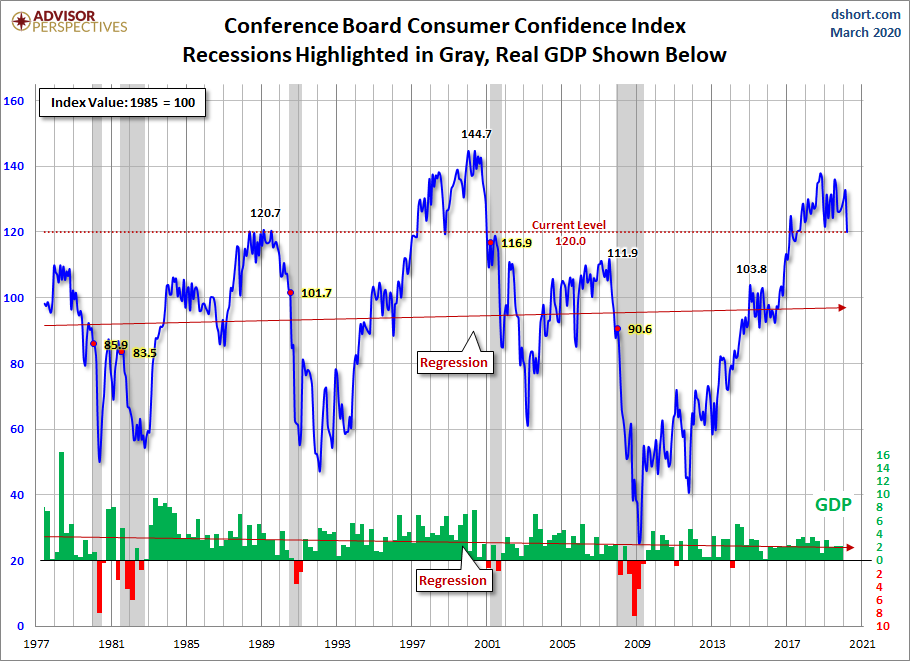
Advisor Perspectives had a post of March 31, 2020 (“Consumer Confidence ‘Declined Sharply in March’“) that displays the latest Conference Board Consumer Confidence and Thomson/Reuters University of Michigan Consumer Sentiment Index charts. They are presented below:
(click on charts to enlarge images)
–
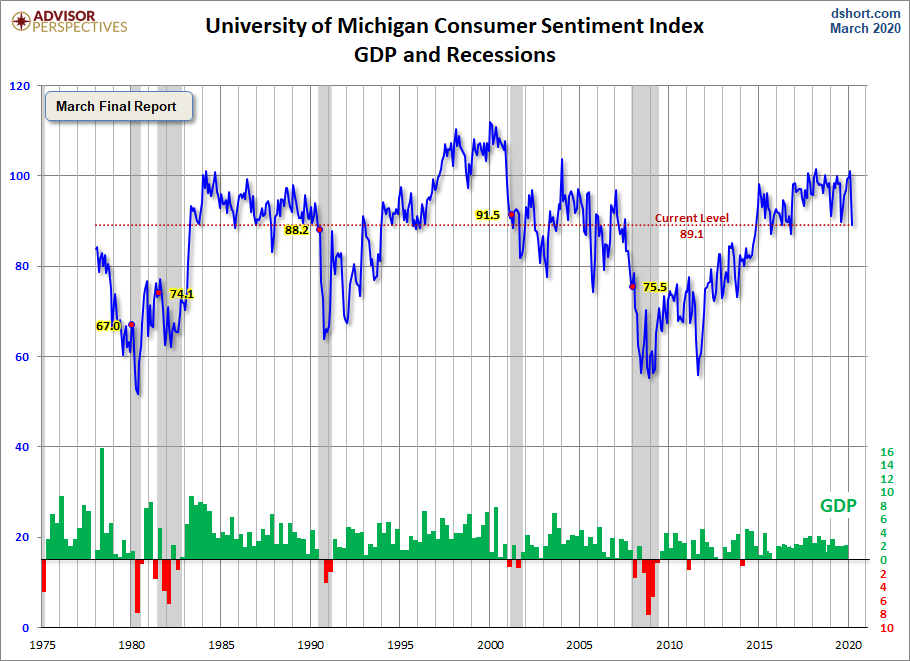
There are a few aspects of the above charts that I find highly noteworthy. Of course, until the sudden upswing in 2014, the continued subdued absolute levels of these two surveys was disconcerting.
Also, I find the “behavior” of these readings to be quite disparate as compared to the other post-recession periods, as shown in the charts between the gray shaded areas (the gray areas denote recessions as defined by the NBER.)
While I don’t believe that confidence surveys should be overemphasized, I find these readings to be notable, especially in light of a variety of other highly disconcerting measures highlighted throughout this site.
_____
The Special Note summarizes my overall thoughts about our economic situation
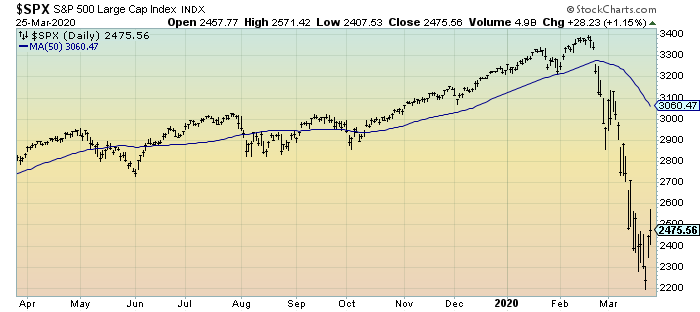
SPX at 2624.98 as this post is written