U.S. Economic Indicators
Throughout this site there are many discussions of economic indicators. At this time, the readings of various indicators are especially notable. This post is the latest in a series of posts indicating U.S. economic weakness or a notably low growth rate.
While many U.S. economic indicators – including GDP – are indicating economic growth, others depict (or imply) various degrees of weak growth or economic contraction. As seen in the February 2020 Wall Street Journal Economic Forecast Survey the consensus (average estimate) among various economists is for 1.9% GDP growth in 2020 and 1.9% GDP growth in 2021. However, there are other broad-based economic indicators that seem to imply a weaker growth rate.
As well, it should be remembered that GDP figures can be (substantially) revised.
Charts Indicating U.S. Economic Weakness
Below are a small sampling of charts that depict weak growth or contraction, and a brief comment for each:
Total Federal Receipts
“Total Federal Receipts” growth continues to be intermittent in nature since 2015. As well, the level of growth does not seem congruent to the (recent) levels of economic growth as seen in aggregate measures such as Real GDP.
“Total Federal Receipts” through February had a last monthly value of $187,951 Million. Shown below is the measure displayed on a “Percent Change From Year Ago” basis with value 12.4%, last updated March 11, 2020:
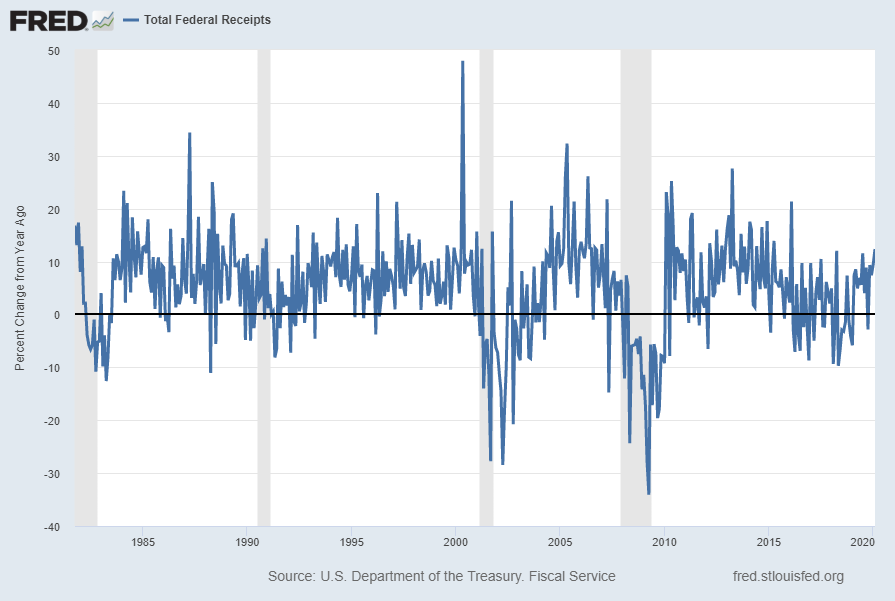
source: U.S. Department of the Treasury. Fiscal Service, Total Federal Receipts [MTSR133FMS], retrieved from FRED, Federal Reserve Bank of St. Louis; accessed March 11, 2020:
https://fred.stlouisfed.org/series/MTSR133FMS
https://fred.stlouisfed.org/series/MTSR133FMS
__
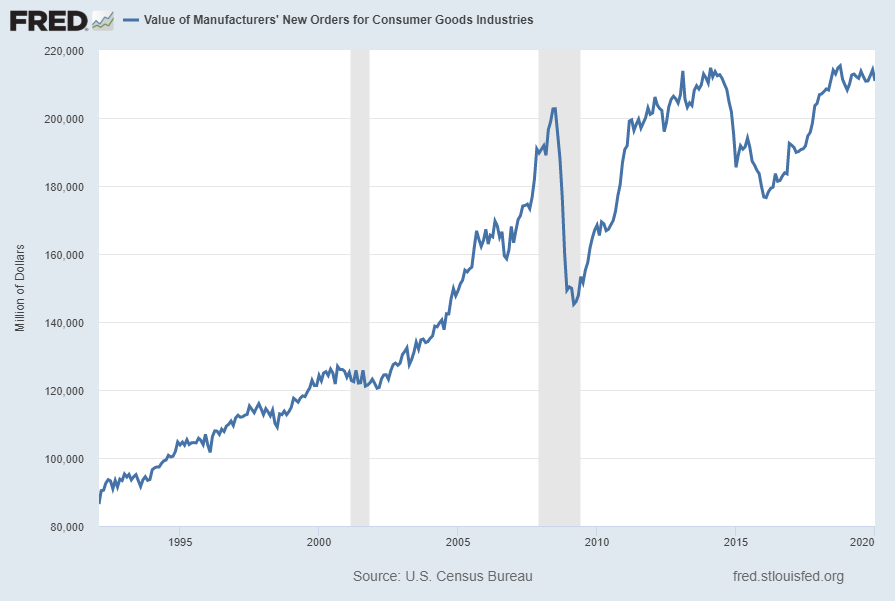
Value of Manufacturers’ New Orders for Consumer Goods Industries (ACOGNO)
A measure for consumer goods exhibiting a recent weakening (on a “Percent Change From Year Ago” basis) growth trend is the “Value of Manufacturers’ New Orders for Consumer Goods Industries” (ACOGNO). Shown below is this measure with last value of $210,911 Million through January 2020 (last updated March 5, 2020):
Displayed below is this same ACOGNO measure on a “Percent Change From Year Ago” basis with value 1.3%, last updated March 5, 2020:
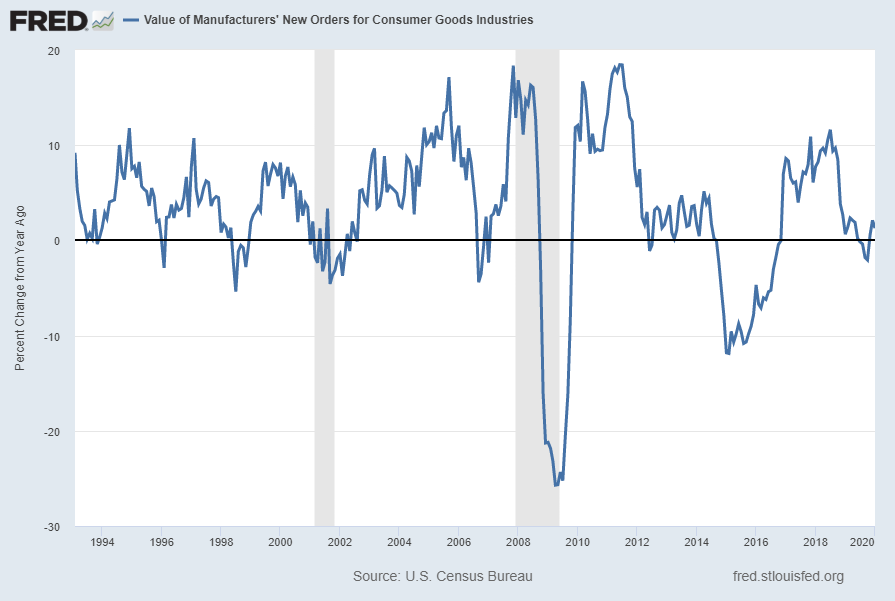
source: U.S. Census Bureau, Value of Manufacturers’ New Orders for Consumer Goods Industries [ACOGNO], retrieved from FRED, Federal Reserve Bank of St. Louis; accessed March 11, 2020: https://fred.stlouisfed.org/series/ACOGNO
__
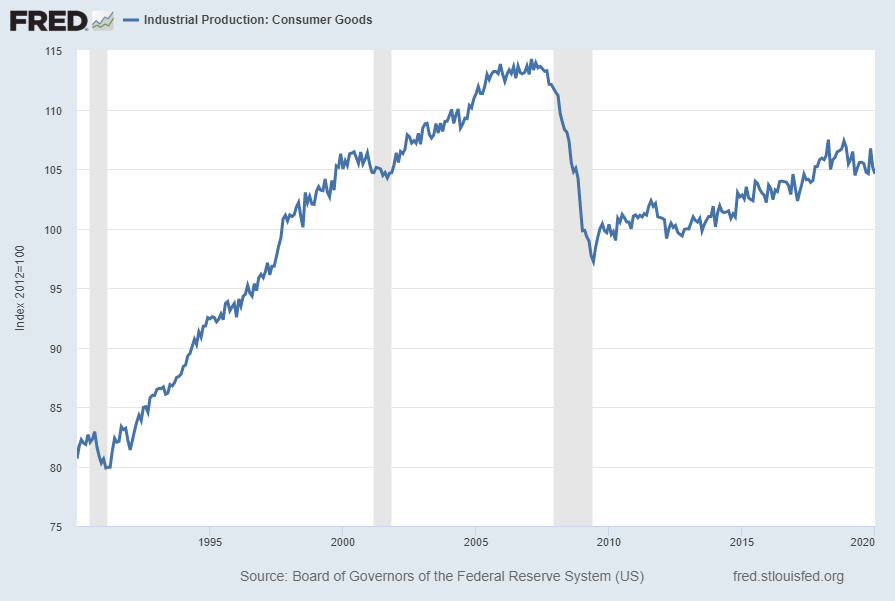
Industrial Production: Consumer Goods (IPCONGD)
The “Industrial Production: Consumer Goods” measure is currently exhibiting (on a “Percent Change From Year Ago” basis) contraction. Shown below is this measure displayed from 1990, with last value of 104.5870 through January 2020, last updated February 14, 2020:
Displayed below is this same IPCONGD measure on a “Percent Change From Year Ago” basis with value -.8%:
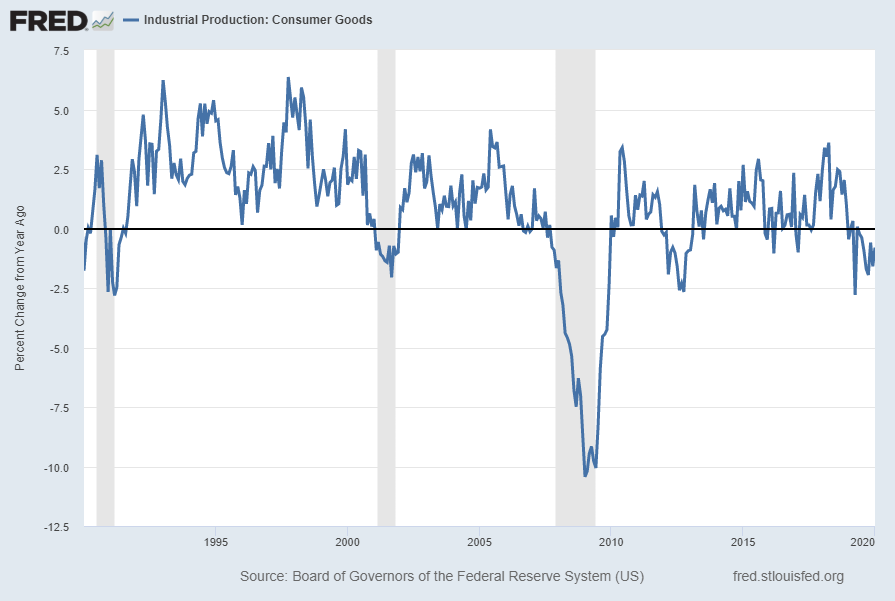
source: Board of Governors of the Federal Reserve System (US), Industrial Production: Consumer Goods [IPCONGD], retrieved from FRED, Federal Reserve Bank of St. Louis; accessed March 11, 2020: https://fred.stlouisfed.org/series/IPCONGD
__
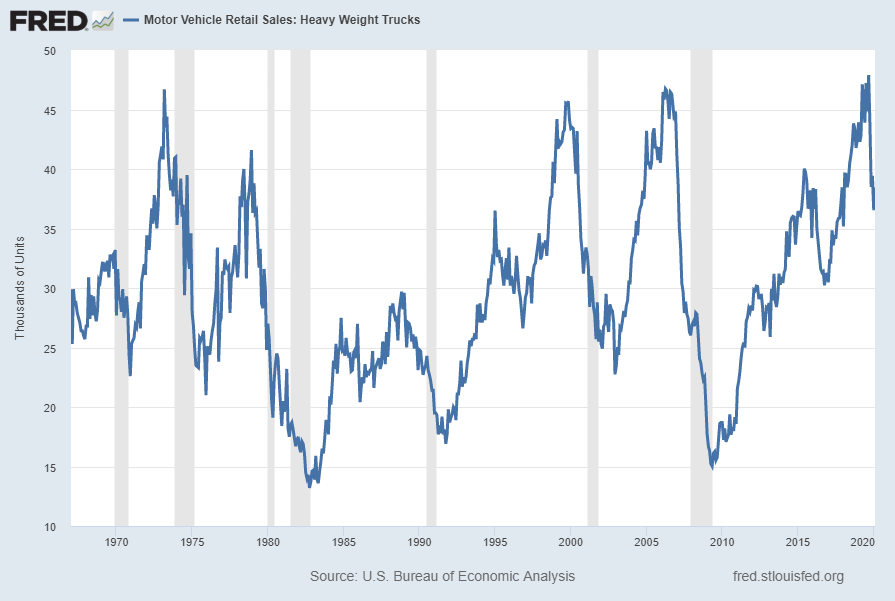
Motor Vehicle Retail Sales: Heavy Weight Trucks (HTRUCKSSA)
Sales of “Heavy Weight Trucks” (HTRUCKSSA) are once again contracting on a “Percent Change From Year Ago” basis. Shown below is this measure with last value of 38.473 Thousand through February 2020, last updated March 6, 2020:
Below is this measure displayed on a “Percent Change From Year Ago” basis with value -9.0%:
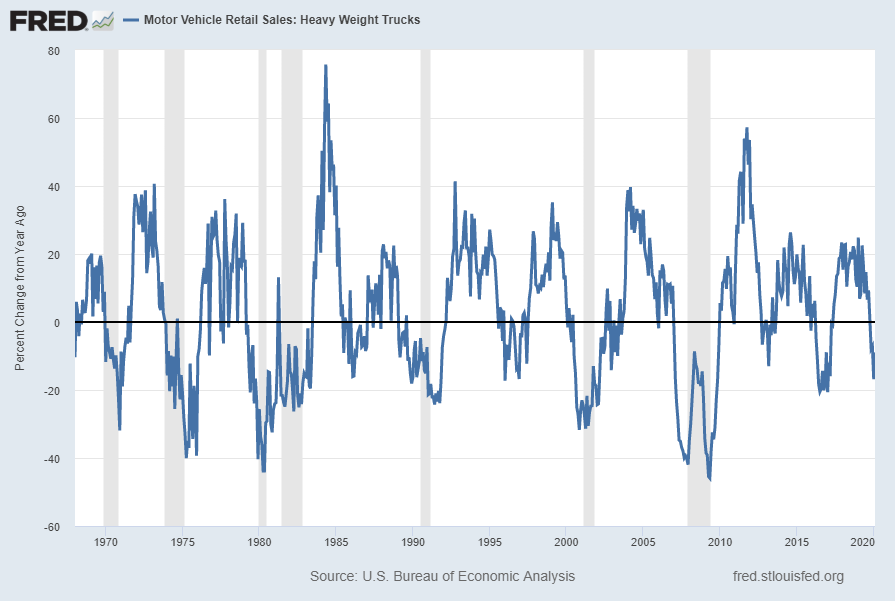
source: U.S. Bureau of Economic Analysis, Motor Vehicle Retail Sales: Heavy Weight Trucks [HTRUCKSSA], retrieved from FRED, Federal Reserve Bank of St. Louis; accessed March 11, 2020: https://fred.stlouisfed.org/series/HTRUCKSSA
__
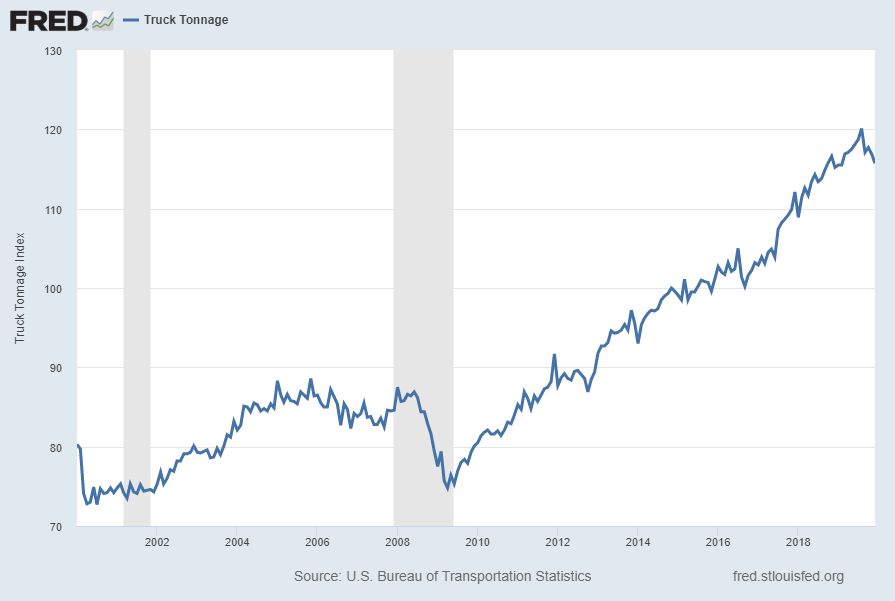
Truck Tonnage (TRUCKD11)
“Truck Tonnage” (TRUCKD11), like other transportation measures, is exhibiting recent weakness. Shown below is this measure with last value of 115.7 through December, last updated February 21, 2020:
Below is this measure displayed on a “Percent Change From Year Ago” basis with value .4%:
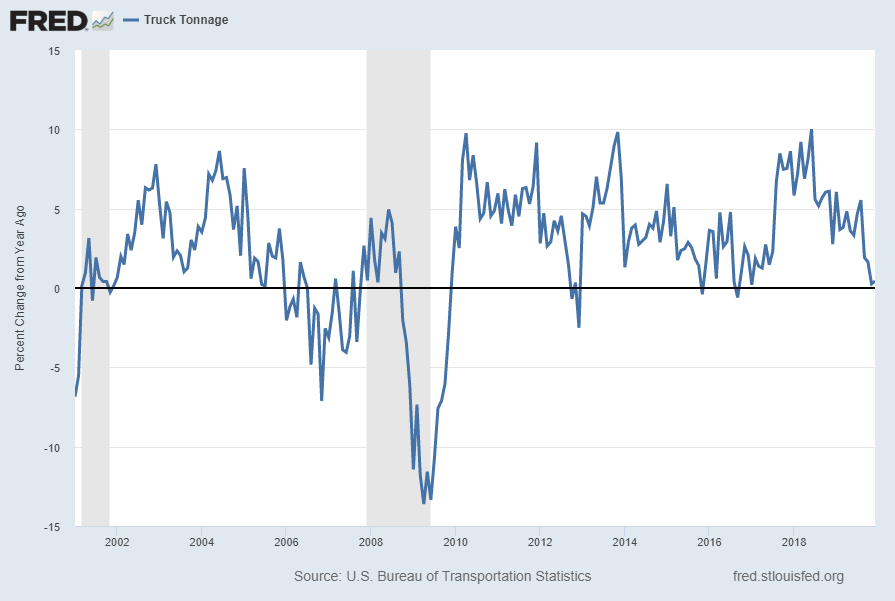
source: U.S. Bureau of Transportation Statistics, Truck Tonnage [TRUCKD11], retrieved from FRED, Federal Reserve Bank of St. Louis; accessed March 11, 2020: https://fred.stlouisfed.org/series/TRUCKD11
__
Other Indicators
As mentioned previously, many other indicators discussed on this site indicate economic weakness or economic contraction, if not outright (gravely) problematical economic conditions.
_____
The Special Note summarizes my overall thoughts about our economic situation
SPX at 2741.38 as this post is written
No comments:
Post a Comment