The following is an update of various indicators that are supposed to predict and/or depict economic activity. These indicators have been discussed in previous blog posts:
The July 2020 Chicago Fed National Activity Index (CFNAI) updated as of July 21, 2020:
The CFNAI, with current reading of 4.11:
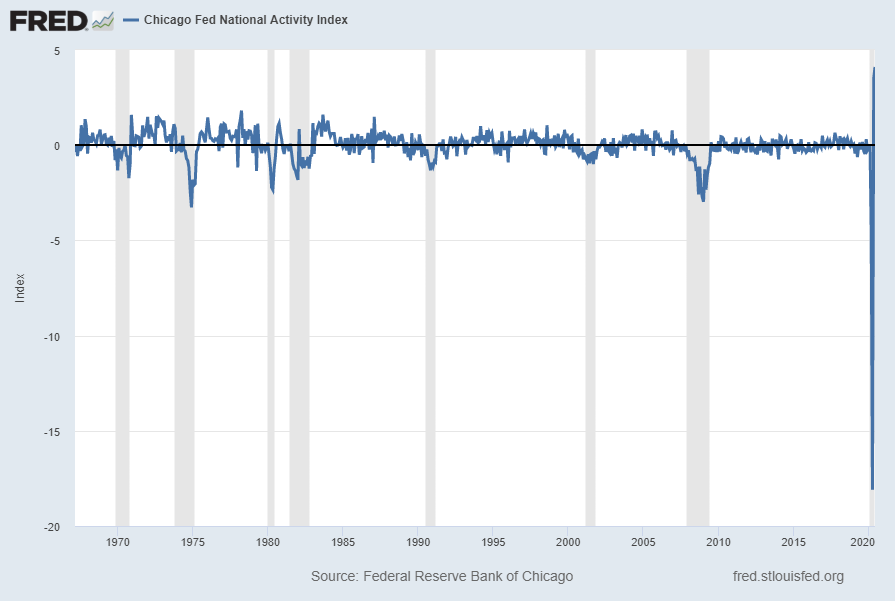
source: Federal Reserve Bank of Chicago, Chicago Fed National Activity Index [CFNAI], retrieved from FRED, Federal Reserve Bank of St. Louis, July 21, 2020;
https://fred.stlouisfed.org/series/CFNAI
https://fred.stlouisfed.org/series/CFNAI
The CFNAI-MA3, with current reading of -3.49:
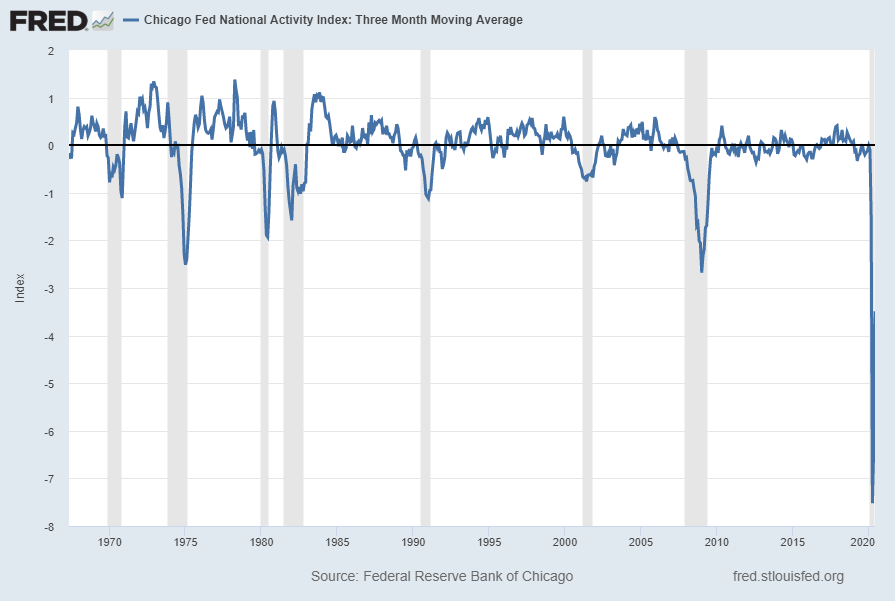
source: Federal Reserve Bank of Chicago, Chicago Fed National Activity Index: Three Month Moving Average [CFNAIMA3], retrieved from FRED, Federal Reserve Bank of St. Louis, July 21, 2020;
https://fred.stlouisfed.org/series/CFNAIMA3
https://fred.stlouisfed.org/series/CFNAIMA3
–
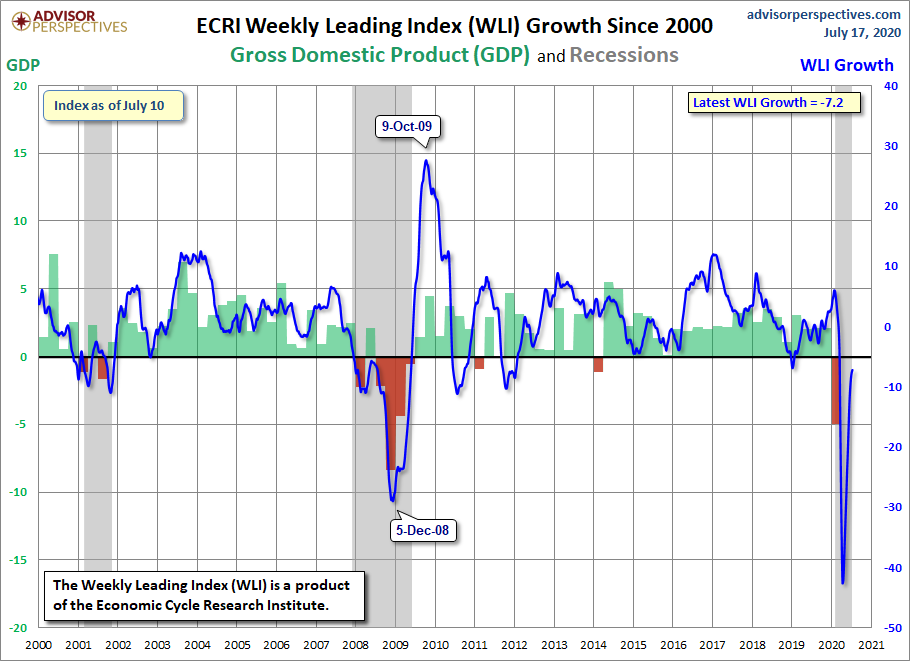
As of July 17, 2020 (incorporating data through July 10, 2020) the WLI was at 134.6 and the WLI, Gr. was at -7.2%.
A chart of the WLI,Gr., from the Advisor Perspectives’ ECRI update post of July 17, 2020:
–
–
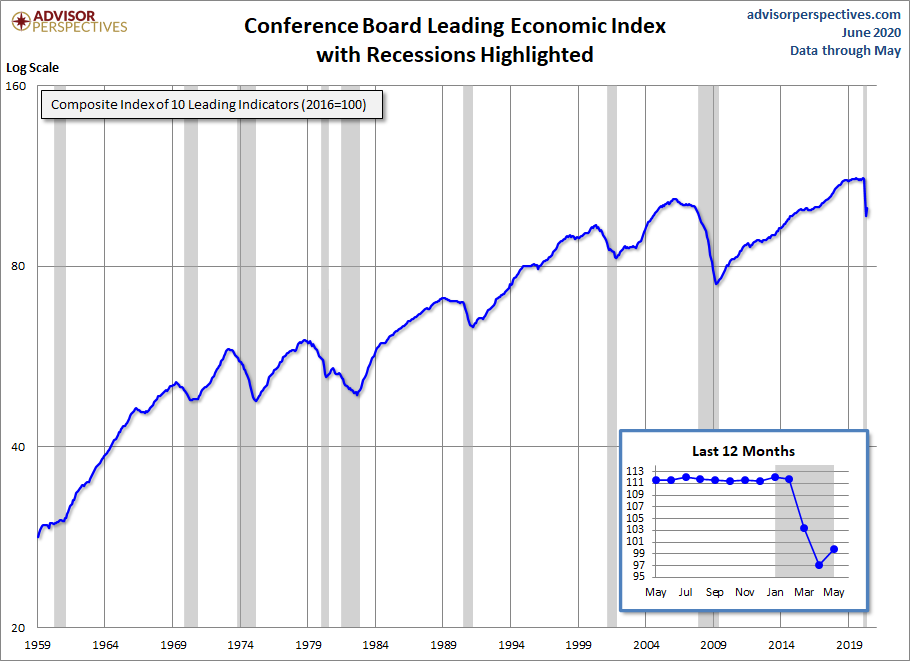
The Conference Board Leading (LEI), Coincident (CEI) Economic Indexes, and Lagging Economic Indicator (LAG):
As per the June 18, 2020 Conference Board press release, titled “The Conference Board Leading Economic Index (LEI) for the U.S. Improved in May” the LEI was at 99.8, the CEI was at 95.3, and the LAG was 111.4 in May.
An excerpt from the release:
“In May, the US LEI showed a partial recovery from its sharp decline over the previous three months, as economic activity began to pick up again,” said Ataman Ozyildirim, Senior Director of Economic Research at The Conference Board. “The relative improvement in unemployment insurance claims is responsible for about two-thirds of the gain in the index. The improvements in labor markets, housing permits, and stock prices also buoyed the LEI, but new orders in manufacturing, consumers’ outlook on the economy, and the Leading Credit Index™ still point to weak economic conditions. The breadth and depth of the decline in the LEI between February and April suggest the economy at large will remain in recession territory in the near term.”
Here is a chart of the LEI from the Advisor Perspectives’ Conference Board Leading Economic Index update of June 18, 2020:
_________
I post various indicators and indices because I believe they should be carefully monitored. However, as those familiar with this site are aware, I do not necessarily agree with what they depict or imply.
_____
The Special Note summarizes my overall thoughts about our economic situation
SPX at 3269.69 as this post is written
No comments:
Post a Comment