U.S. Economic Indicators
Throughout this site there are many discussions of economic indicators. This post is the latest in a series of posts indicating U.S. economic weakness or a notably low growth rate.
The level and trend of economic growth is especially notable at this time. As seen in various measures and near-term projections, the U.S. economy has undergone an outsized level of economic contraction. However, most people believe (and virtually all prominent economic forecasts indicate) that this historic level of contraction will be temporary in nature and that a sustainable economic rebound will have started in the third quarter of 2020.
As seen in the January 2021 Wall Street Journal Economic Forecast Survey the consensus (average estimate) among various economists is for -2.53% GDP growth in 2020, 4.26% GDP growth in 2021, and 3.03% GDP growth in 2022.
Charts Indicating U.S. Economic Weakness
Below are a small sampling of charts that depict weak growth or contraction, and a brief comment for each:
The Weekly Economic Index (WEI)
A recently-introduced indicator, the Weekly Economic Index, is an economic indicator that is a composite of 10 different weekly indicators. It is (purportedly) designed to provide a timely depiction of the U.S. economic trend. As seen below, it depicts the severity of the recent plunge in economic activity and subsequent (partial) rebound.
The Weekly Economic Index (WEI) with a value of -2.25, updated as of February 11, 2021 (incorporating data through February 6, 2021):
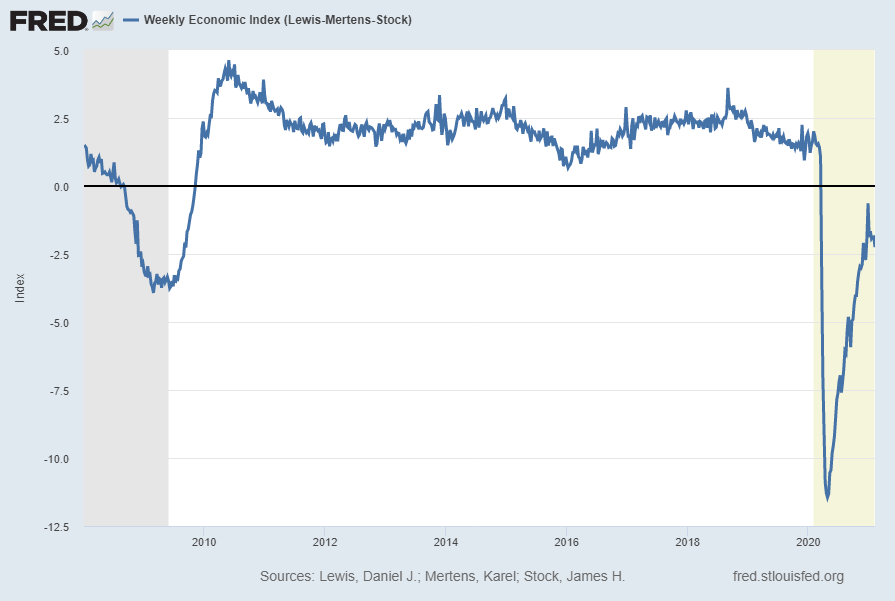
source: Lewis, Daniel J., Mertens, Karel and Stock, James H., Weekly Economic Index (Lewis-Mertens-Stock) [WEI], retrieved from FRED, Federal Reserve Bank of St. Louis; accessed February 11, 2021: https://fred.stlouisfed.org/series/WEI
__
Industrial Production: Consumer Goods (IPCONGD)
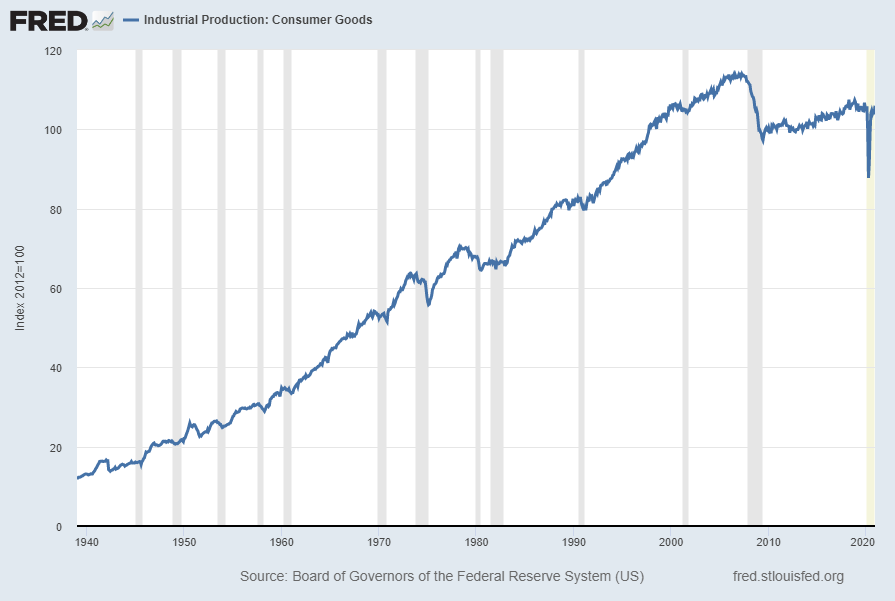
The “Industrial Production: Consumer Goods” measure is another measure exhibiting an outsized contraction followed by a (partial) rebound. Shown below is a long-term chart of this measure (displayed from 1939), with last value of 105.9516 through December 2020, last updated January 15, 2021:
Displayed below is this same IPCONGD measure on a “Percent Change From Year Ago” basis with value .4%:
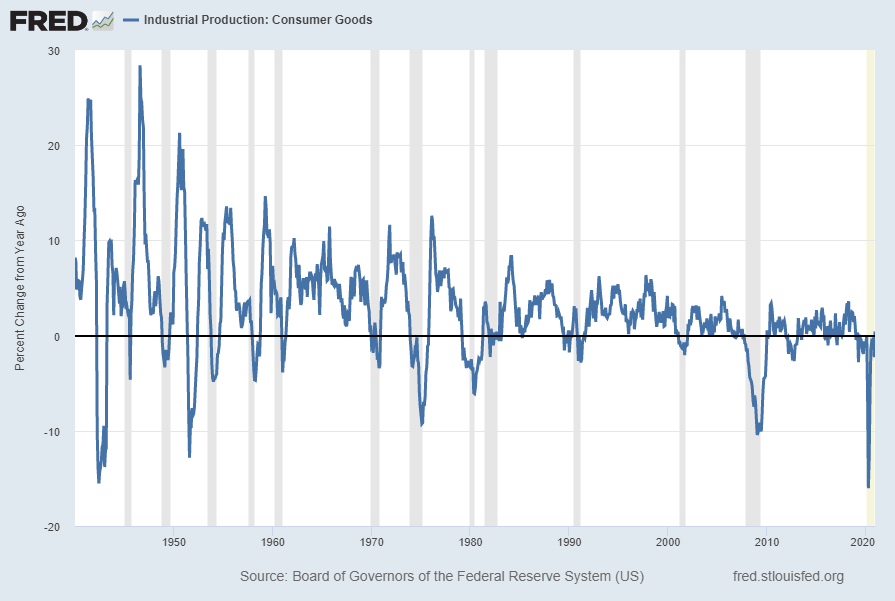
source: Board of Governors of the Federal Reserve System (US), Industrial Production: Consumer Goods [IPCONGD], retrieved from FRED, Federal Reserve Bank of St. Louis; accessed February 11, 2021: https://fred.stlouisfed.org/series/IPCONGD
__
Value of Manufacturers’ New Orders for Consumer Goods Industries (ACOGNO)
Another measure for consumer goods exhibiting a recent outsized weakening followed by a partial rebound is the “Value of Manufacturers’ New Orders for Consumer Goods Industries” (ACOGNO). Shown below is this measure with last value of $209,545 Million through December 2020 (last updated February 4, 2021):
![Value of Manufacturers’ New Orders for Consumer Goods Industries [ACOGNO]](https://www.economicgreenfield.com/wp-content/uploads/2021/02/ACOGNO_2-4-21-209545.png)
Displayed below is this same ACOGNO measure on a “Percent Change From Year Ago” basis with value -1.9%, last updated February 4, 2021:
![Value of Manufacturers’ New Orders for Consumer Goods Industries [ACOGNO] Percent Change From Year Ago](https://www.economicgreenfield.com/wp-content/uploads/2021/02/ACOGNO_2-4-21-209545-1.9-Percent-Change-From-Year-Ago.png)
source: U.S. Census Bureau, Value of Manufacturers’ New Orders for Consumer Goods Industries [ACOGNO], retrieved from FRED, Federal Reserve Bank of St. Louis; accessed February 10, 2021: https://fred.stlouisfed.org/series/ACOGNO
__
Freight Transportation Services Index (TSIFRGHT)
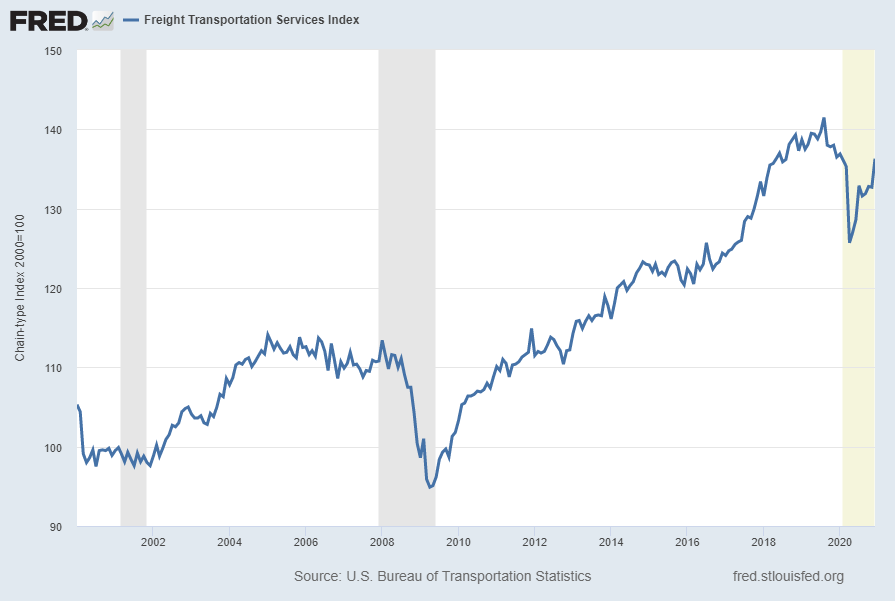
“Freight Transportation Services Index” (TSIFRGHT), like other transportation measures, is exhibiting recent substantial weakness. Shown below is this measure with last value of 136.3 through December, last updated February 10, 2021:
Below is this measure displayed on a “Percent Change From Year Ago” basis with value -.1%:
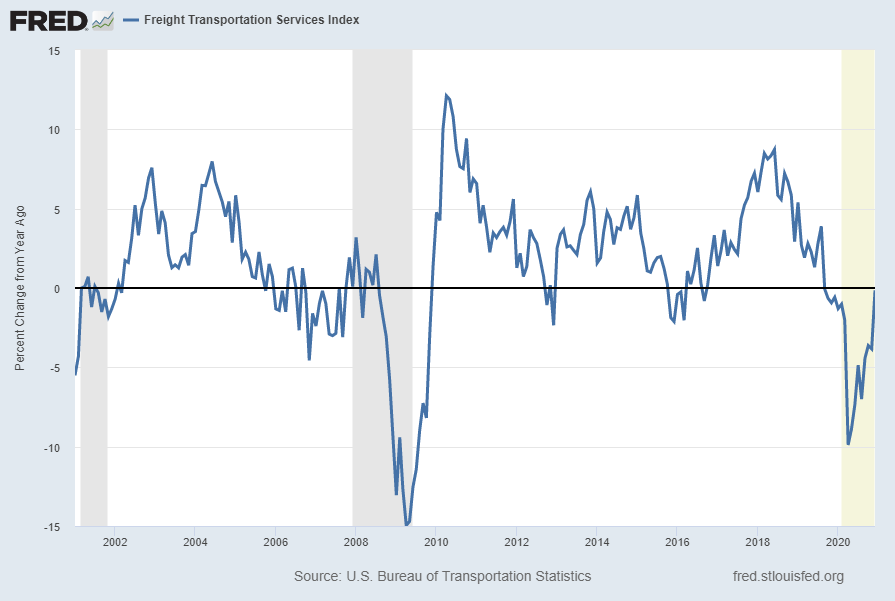
source: U.S. Bureau of Transportation Statistics, Freight Transportation Services Index [TSIFRGHT], retrieved from FRED, Federal Reserve Bank of St. Louis; accessed February 11, 2021; https://fred.stlouisfed.org/series/TSIFRGHT
__
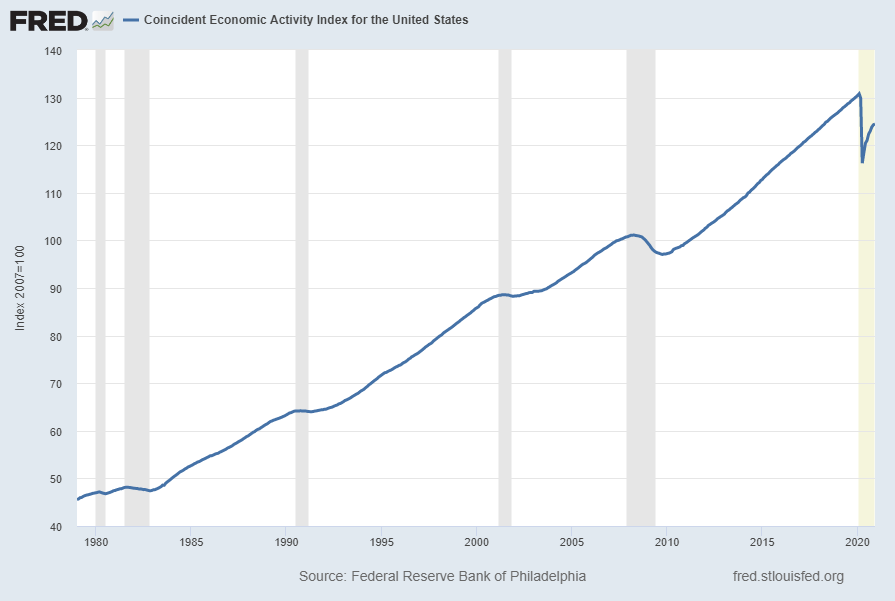
Coincident Economic Activity Index for the United States (USPHCI)
The Coincident Economic Activity Index for the United States (USPHCI) is described in FRED as the following:
The Coincident Economic Activity Index includes four indicators: nonfarm payroll employment, the unemployment rate, average hours worked in manufacturing and wages and salaries. The trend for each state’s index is set to match the trend for gross state product.
As seen in the long-term chart below, like many U.S. economic indicators the index appears to be attempting a rebound from the recent 2020 decline.
Shown below is a chart with data through December 2020 (last value of 124.44), last updated January 29, 2021:
Below is this measure displayed on a “Percent Change From Year Ago” basis with value -4.4%:
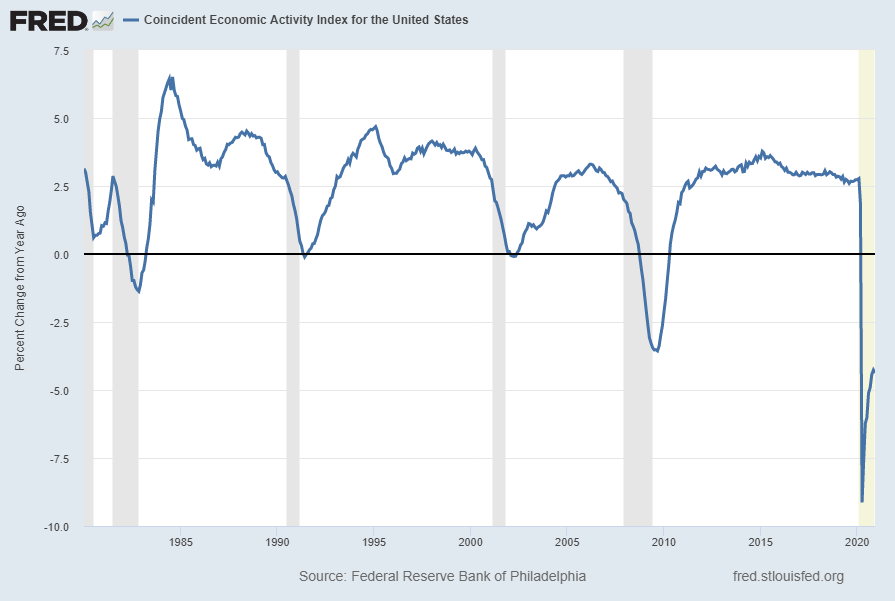
source: Federal Reserve Bank of Philadelphia, Coincident Economic Activity Index for the United States [USPHCI], retrieved from FRED, Federal Reserve Bank of St. Louis; accessed February 10, 2021: https://fred.stlouisfed.org/series/USPHCI
__
Other Indicators
As mentioned previously, many other indicators discussed on this site indicate slow economic growth or economic contraction, if not outright (gravely) problematical economic conditions.
_____
The Special Note summarizes my overall thoughts about our economic situation
SPX at 3916.28 as this post is written
No comments:
Post a Comment