U.S. Economic Indicators
Throughout this site there are many discussions of economic indicators. This post is the latest in a series of posts indicating U.S. economic weakness or a notably low growth rate.
The level and trend of economic growth is especially notable at this time. As seen in various measures and near-term projections, the U.S. economy had undergone an outsized level of economic contraction in 2020. However, most people believe (and virtually all prominent economic forecasts indicate) that this historic level of contraction will prove ephemeral in nature; i.e. a sustainable economic rebound will have started in the third quarter of 2020.
As seen in the March 2021 Wall Street Journal Economic Forecast Survey the consensus (average estimate) among various economists is for 5.95% GDP growth in 2021, 3.17% GDP growth in 2022, and 2.44% GDP growth in 2023.
Charts Indicating U.S. Economic Weakness
Below are a small sampling of charts that depict weak growth or contraction, and a brief comment for each:
The Weekly Economic Index (WEI)
A recently-introduced indicator, the Weekly Economic Index, is an economic indicator that is a composite of 10 different weekly indicators. It is (purportedly) designed to provide a timely depiction of the U.S. economic trend. As seen below, it depicts the severity of the recent plunge in economic activity and subsequent (partial) rebound.
The Weekly Economic Index (WEI) with a value of -1.57, updated as of March 11, 2021 (incorporating data through March 6, 2021):
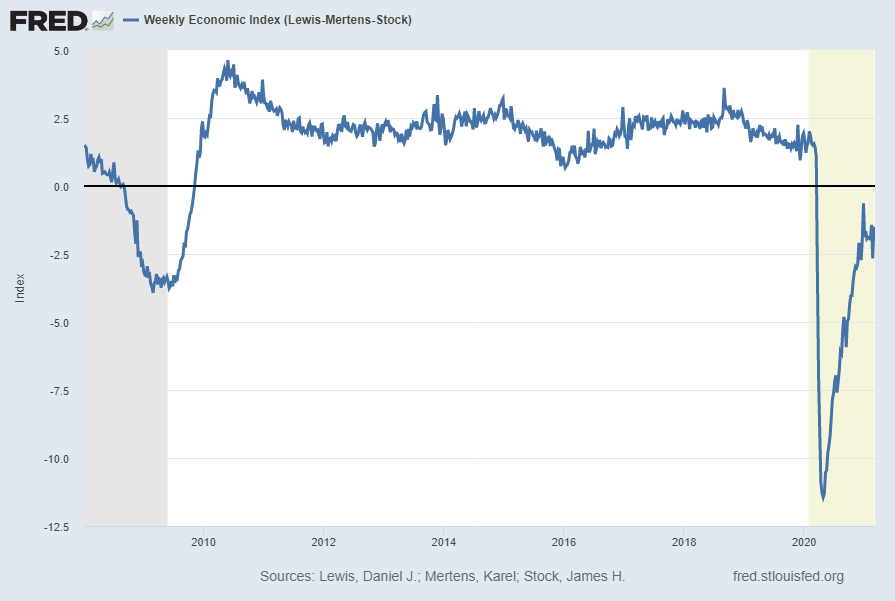
source: Lewis, Daniel J., Mertens, Karel and Stock, James H., Weekly Economic Index (Lewis-Mertens-Stock) [WEI], retrieved from FRED, Federal Reserve Bank of St. Louis; accessed March 11, 2021: https://fred.stlouisfed.org/series/WEI
__
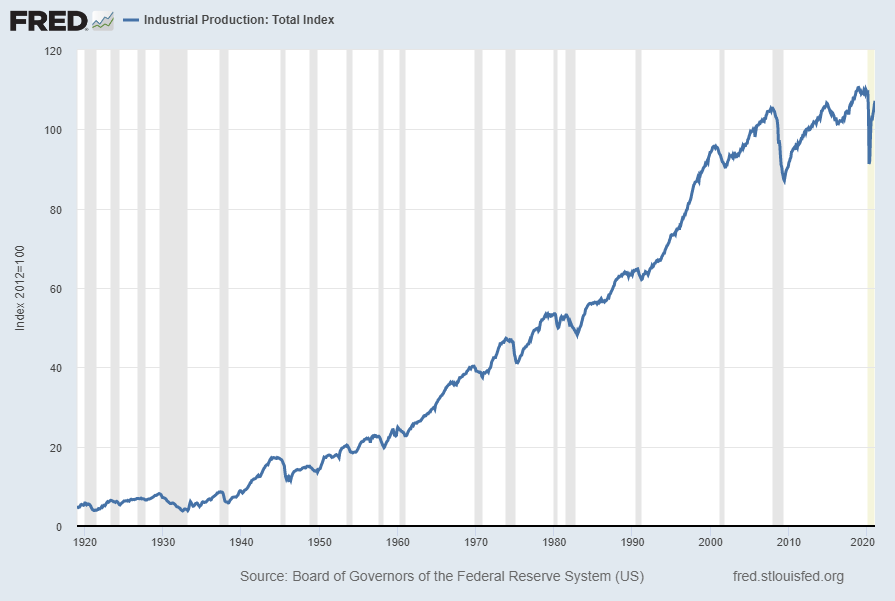
Industrial Production (INDPRO)
The “Industrial Production” measure is another measure exhibiting an outsized contraction followed by a (partial) rebound. Shown below is a long-term chart of this measure (displayed from 1919), with last value of 107.1843 through January 2021, last updated February 17, 2021:
Displayed below is this same INDPRO measure on a “Percent Change From Year Ago” basis with value -1.8%:

source: Board of Governors of the Federal Reserve System (US), Industrial Production [INDPRO], retrieved from FRED, Federal Reserve Bank of St. Louis; accessed March 11, 2021: https://fred.stlouisfed.org/series/IPCONGD
__
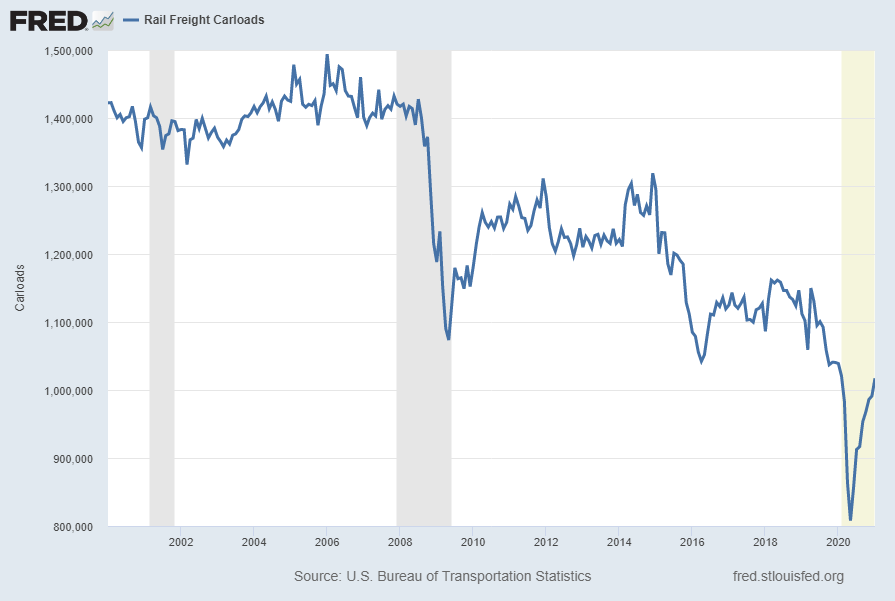
Rail Freight Carloads (RAILFRTCARLOADSD11)
“Rail Freight Carloads” continues to show a generally downward progression from a longer-term perspective. Shown below is a chart with data through January 2021 (last value of 1,017,290), last updated March 11, 2021:
Here is the same measure on a “Percent Change From Year Ago” basis, with value -2.1%:
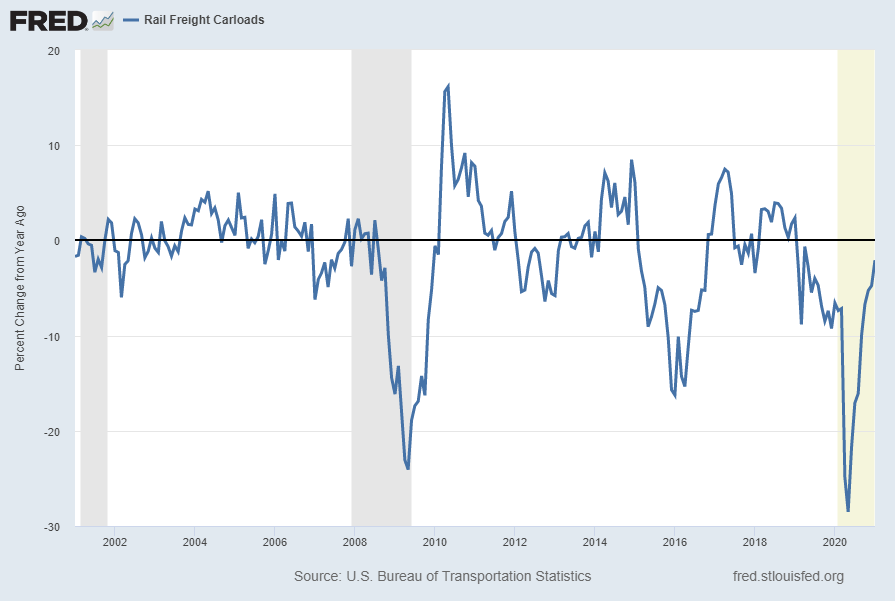
source: U.S. Bureau of Transportation Statistics, Rail Freight Carloads [RAILFRTCARLOADSD11], retrieved from FRED, Federal Reserve Bank of St. Louis; accessed March 11, 2021: https://fred.stlouisfed.org/series/RAILFRTCARLOADSD11
__
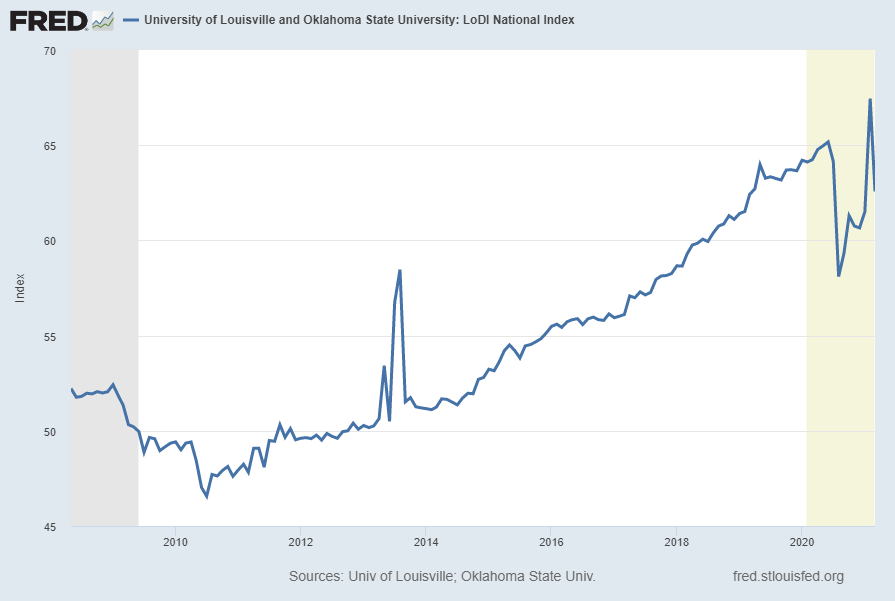
University of Louisville and Oklahoma State University: LoDI National Index (LODINIM066N)
The LoDI National Index is described in FRED as:
The LoDI Index uses linear regression analysis to combine cargo volume data from rail, barge, air, and truck transit, along with various economic factors. The resulting indicator is designed to predict upcoming changes in the level of logistics and distribution activity in the US and is represented by a value between 1 and 100. An index at or above 50 represents a healthy level of activity in the industry.
As seen in the long-term chart below, the index appears to be exhibiting volatility in its rebound from the recent 2020 decline.
Shown below is a chart with data through March 2021 (last value of 62.56928), last updated March 5, 2021:
Below is this measure displayed on a “Percent Change From Year Ago” basis with value -2.6%:
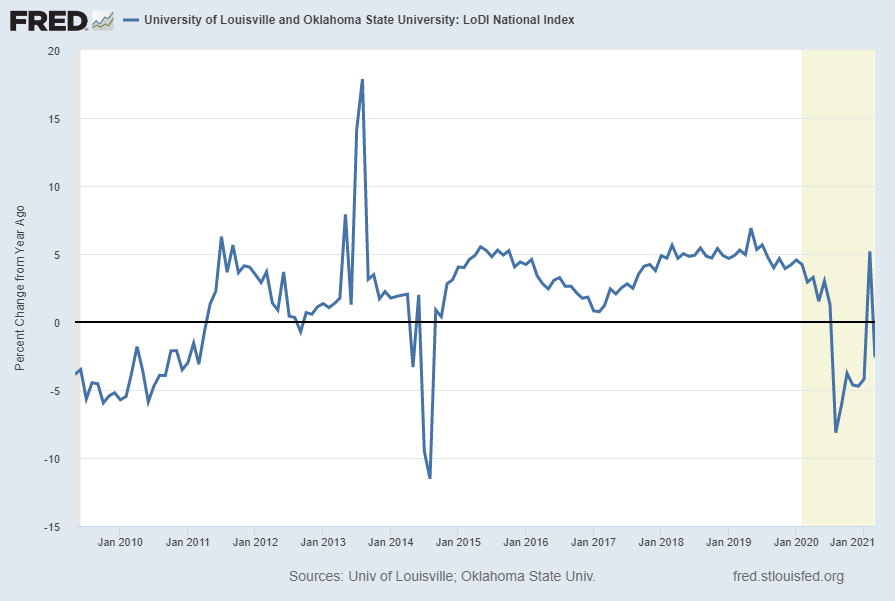
source: University of Louisville. Logistics and Distribution Institute and Oklahoma State University, University of Louisville and Oklahoma State University: LoDI National Index [LODINIM066N], retrieved from FRED, Federal Reserve Bank of St. Louis; accessed March 11, 2021: https://fred.stlouisfed.org/series/LODINIM066N
__
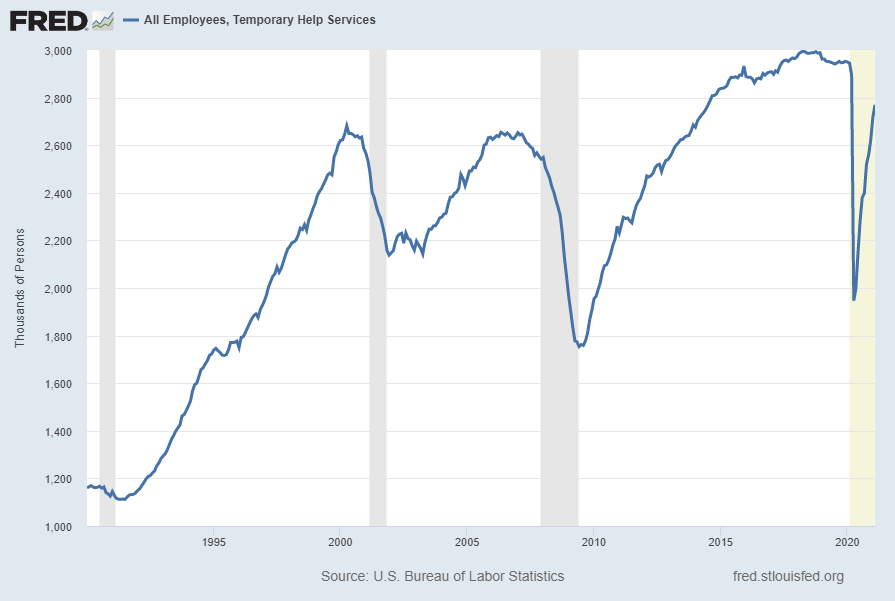
All Employees, Temporary Help Services (TEMPHELPS)
I have written extensively about many facets of employment and unemployment, as the current and future unemployment issue is of tremendous importance.
One theory regarding employment is that hiring cycles typically begin with an uptake in temporary employment.
Shown below is this measure with last value of 2,769.7 (Thousands) through February, last updated March 5, 2021:
Below is this measure displayed on a “Percent Change From Year Ago” basis with value -5.9%:
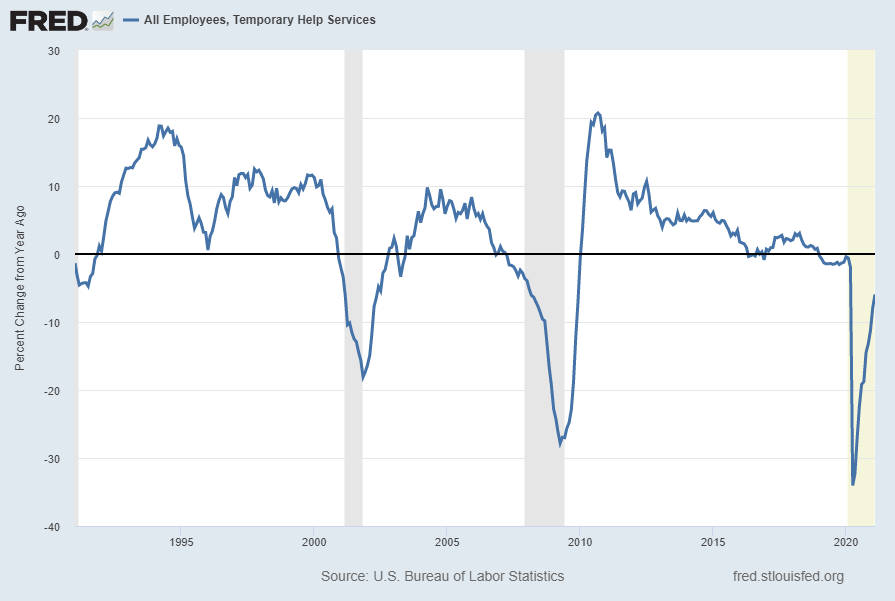
source: U.S. Bureau of Labor Statistics, All Employees, Temporary Help Services [TEMPHELPS], retrieved from FRED, Federal Reserve Bank of St. Louis; accessed March 11, 2021: https://fred.stlouisfed.org/series/TEMPHELPS
__
Other Indicators
As mentioned previously, many other indicators discussed on this site indicate slow economic growth or economic contraction, if not outright (gravely) problematical economic conditions.
_____
The Special Note summarizes my overall thoughts about our economic situation
SPX at 3939.34 as this post is written
No comments:
Post a Comment