U.S. Economic Indicators
Throughout this site there are many discussions of economic indicators. This post is the latest in a series of posts indicating facets of U.S. economic weakness or a notably low growth rate.
The level and trend of economic growth is especially notable at this time. As seen in various measures and near-term projections, the U.S. economy had undergone an outsized level of economic contraction in 2020. However, most people believe (and virtually all prominent economic forecasts indicate) that this historic level of contraction will prove ephemeral in nature; i.e. an economic expansion will continue.
As seen in the October 2021 Wall Street Journal Economic Forecast Survey the consensus (average estimate) among various economists is for 5.22% GDP growth in 2021, 3.59% GDP growth in 2022, 2.53% GDP growth in 2023, and 2.23% GDP growth in 2024.
Charts Indicating U.S. Economic Weakness
Below are a small sampling of charts that depict weak growth or contraction, and a brief comment for each:
The Chicago Fed National Activity Index (CFNAI)
A broad-based economic indicator, the Chicago Fed National Activity Index (CFNAI), shows a negative value in its most current reading.
The October 2020 Chicago Fed National Activity Index (CFNAI) updated as of October 25, 2021:
The CFNAI, with current reading of -.13:
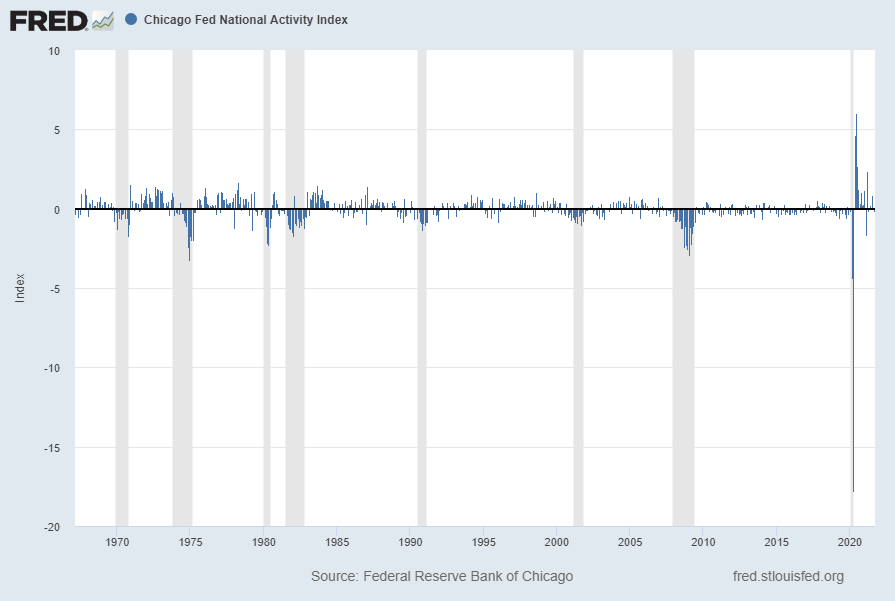
source: Federal Reserve Bank of Chicago, Chicago Fed National Activity Index [CFNAI], retrieved from FRED, Federal Reserve Bank of St. Louis; accessed October 25, 2021;
https://fred.stlouisfed.org/series/CFNAI
The CFNAI-MA3 (CFNAI 3-month moving average) while positive, is showing a declining trend with current reading of .25:
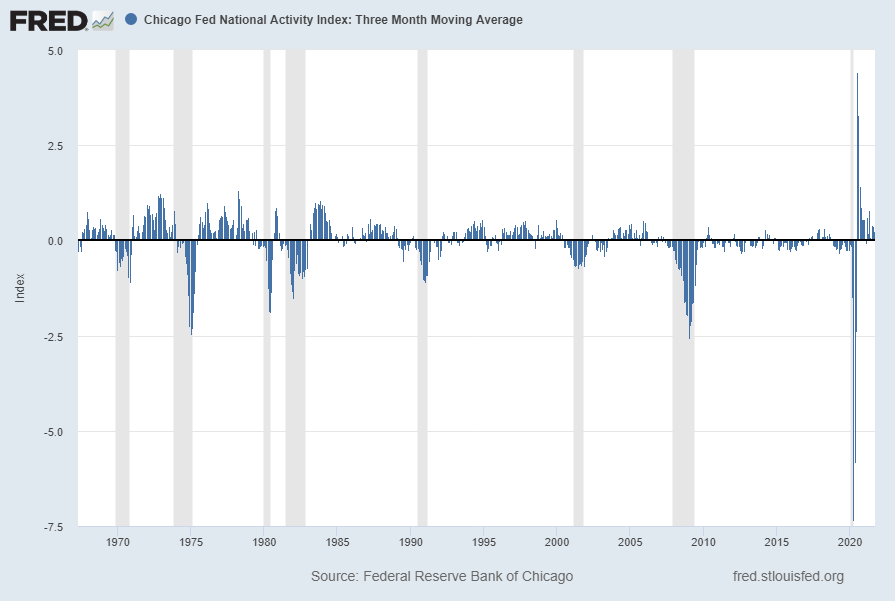
source: Federal Reserve Bank of Chicago, Chicago Fed National Activity Index: Three Month Moving Average [CFNAIMA3], retrieved from FRED, Federal Reserve Bank of St. Louis; : accessed October 25, 2021: https://fred.stlouisfed.org/series/CFNAIMA3
__
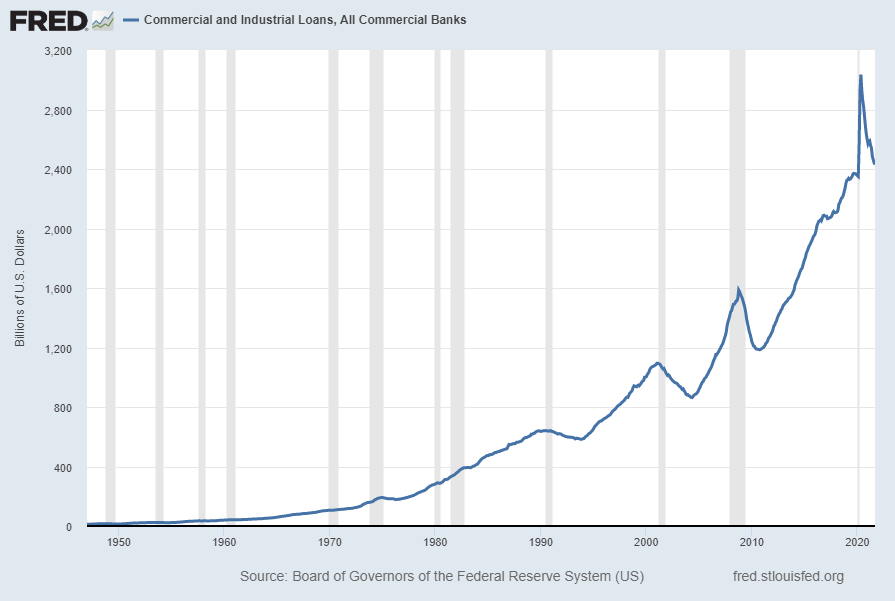
Commercial And Industrial Loans, All Commercial Banks (BUSLOANS)
“Commercial And Industrial Loans, All Commercial Banks” (BUSLOANS) has recently been declining. Shown below is this measure with last value of $2,430.2430 Billion through September 2021, last updated November 5, 2021:
Below is this measure displayed on a “Percent Change From Year Ago” basis with value -12.0%:
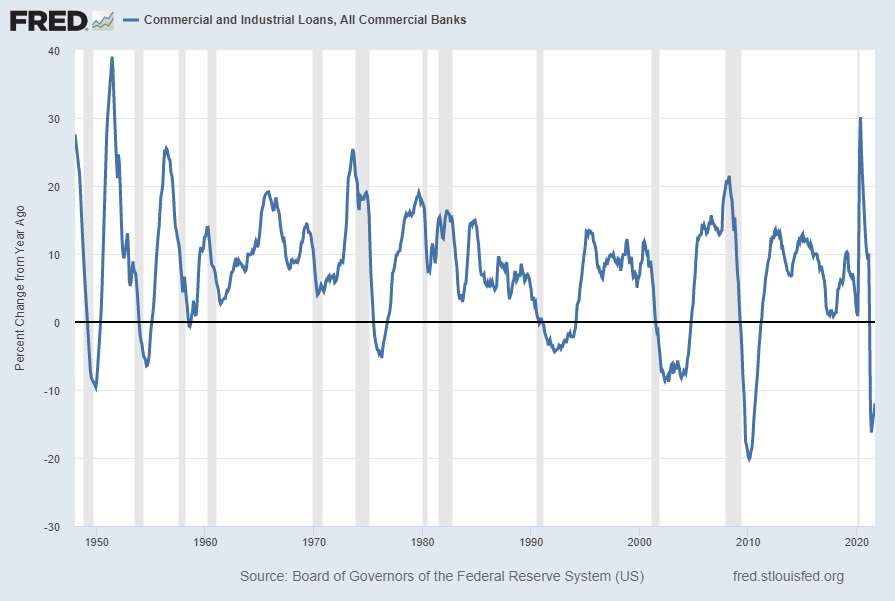
source: Board of Governors of the Federal Reserve System (US), Commercial and Industrial Loans, All Commercial Banks [BUSLOANS], retrieved from FRED, Federal Reserve Bank of St. Louis; accessed November 11, 2021: https://fred.stlouisfed.org/series/BUSLOANS
__
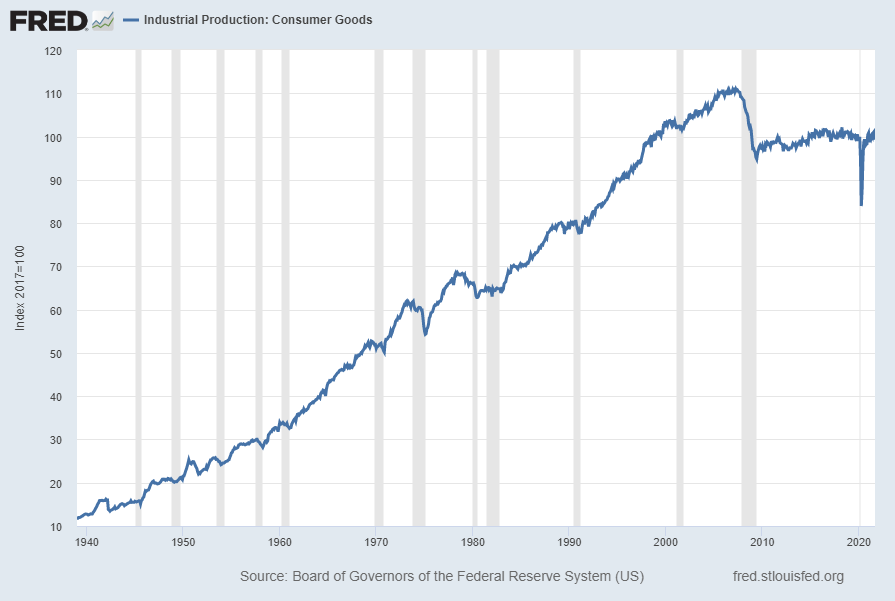
Industrial Production: Consumer Goods (IPCONGD)
The “Industrial Production: Consumer Goods” measure has been relatively subdued since the Financial Crisis. Shown below is a long-term chart of this measure (displayed from 1939), with last value of 99.2593 through September 2021, last updated October 18, 2021:
Displayed below is this same IPCONGD measure on a “Percent Change From Year Ago” basis, showing a continuing post-2020 rebound albeit with a declining growth trend. The current value is 1.4%:
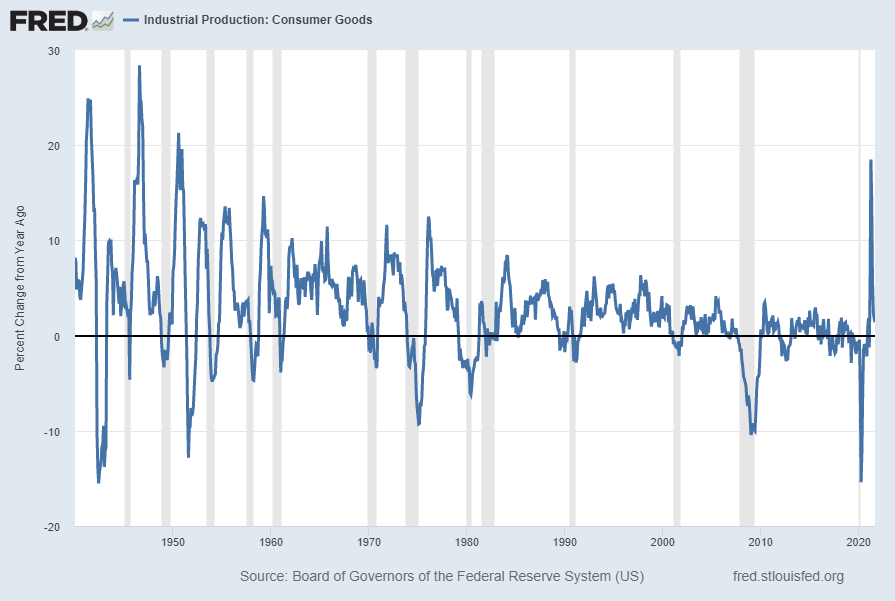
source: Board of Governors of the Federal Reserve System (US), Industrial Production: Consumer Goods [IPCONGD], retrieved from FRED, Federal Reserve Bank of St. Louis; accessed November 11, 2021: https://fred.stlouisfed.org/series/IPCONGD
__
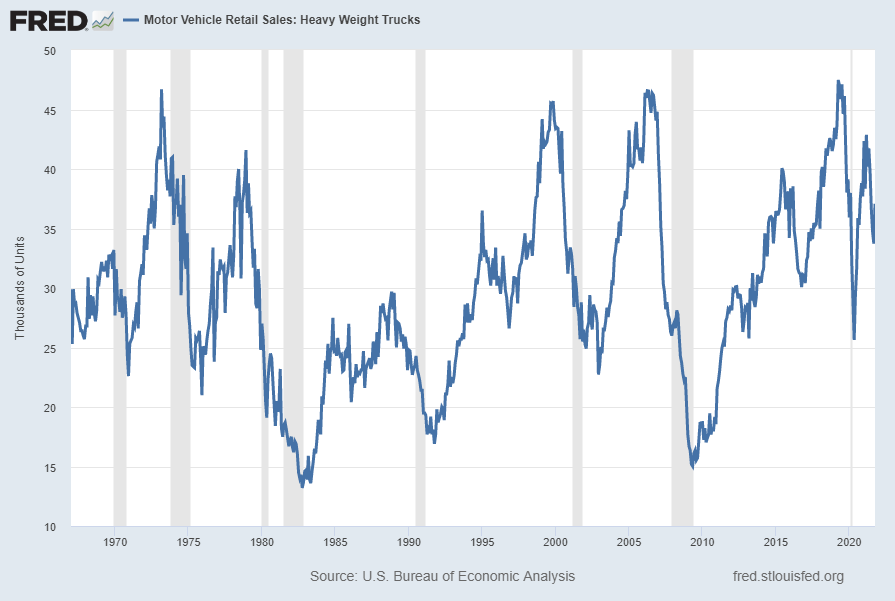
Motor Vehicle Retail Sales: Heavy Weight Trucks (HTRUCKSSA)
Sales of “Heavy Weight Trucks” (HTRUCKSSA) has recently been volatile. Shown below is this measure with last value of 37.078 Thousand through October 2021, last updated November 5, 2021:
Below is this measure displayed on a “Percent Change From Year Ago” basis with value -1.2%:
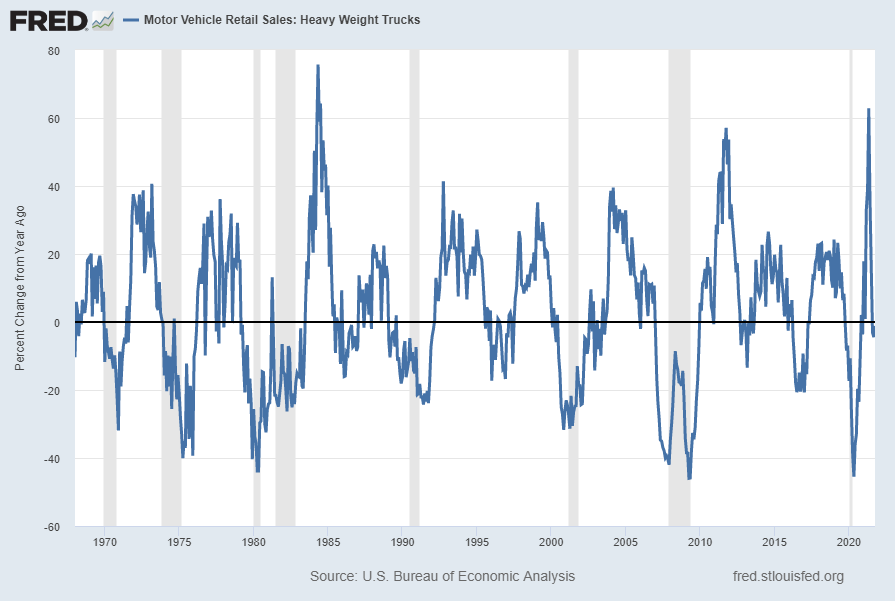
source: U.S. Bureau of Economic Analysis, Motor Vehicle Retail Sales: Heavy Weight Trucks [HTRUCKSSA], retrieved from FRED, Federal Reserve Bank of St. Louis; accessed November 11, 2021: https://fred.stlouisfed.org/series/HTRUCKSSA
__
Other Indicators
As mentioned previously, many other indicators discussed on this site indicate economic weakness or economic contraction, if not outright (gravely) problematical economic conditions.
_____
The Special Note summarizes my overall thoughts about our economic situation
SPX at 4655.25 as this post is written
No comments:
Post a Comment