Throughout this site there are many discussions of economic indicators. This post is the latest in a series of posts indicating facets of U.S. economic weakness or a notably low growth rate.
The level and trend of economic growth is especially notable at this time. As seen in various estimates, the probability of recession has grown significantly.
As seen in the January 2023 Wall Street Journal Economic Forecast Survey the consensus (average estimate) among various economists is for .17% GDP in 2023, 1.86% GDP in 2024, and 2.22% GDP in 2025.
Charts Indicating U.S. Economic Weakness
Below is a small sampling of charts that depict weak growth or contraction, and a brief comment for each:
The Yield Curve (T10Y2Y)
Many people believe that the Yield Curve is a leading economic indicator for the United States economy.
On March 1, 2010, I wrote a post on the issue, titled “The Yield Curve As A Leading Economic Indicator.”
While I continue to have the stated reservations regarding the “Yield Curve” as an indicator, I do believe that it should be monitored.
The U.S. Yield Curve (one proxy seen below) is negative and is (all things considered) notably very low when viewed from a long-term perspective. Below is the spread between the 10-Year Treasury Constant Maturity and the 2-Year Treasury Constant Maturity from June 1976 through the March 6, 2023 update, showing a value of -.91% [10-Year Treasury Yield (FRED DGS10) of 3.98% as of the March 6 update, 2-Year Treasury Yield (FRED DGS2) of 4.89% as of the March 6 update]:
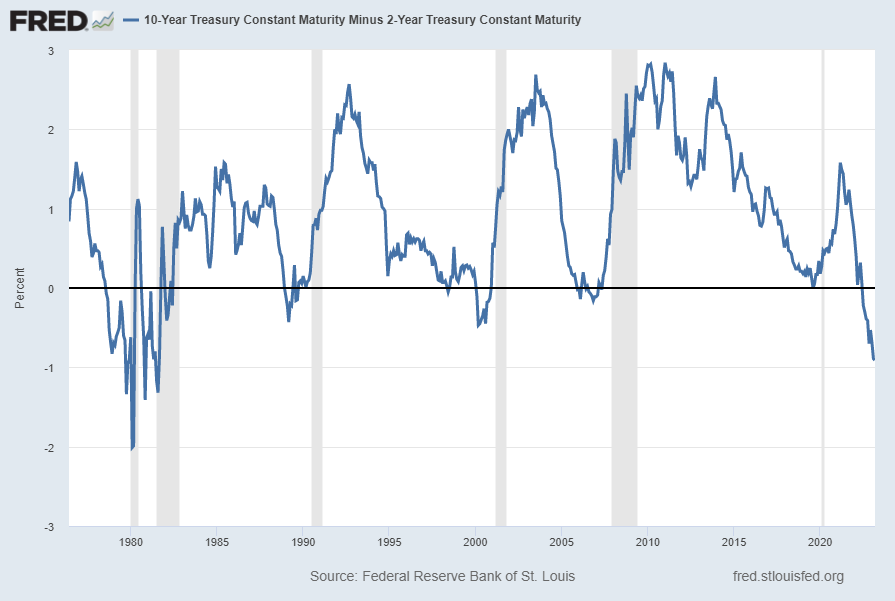
source: Federal Reserve Bank of St. Louis, 10-Year Treasury Constant Maturity Minus 2-Year Treasury Constant Maturity [T10Y2Y], retrieved from FRED, Federal Reserve Bank of St. Louis; accessed March 7, 2023: https://fred.stlouisfed.org/series/T10Y2Y
__
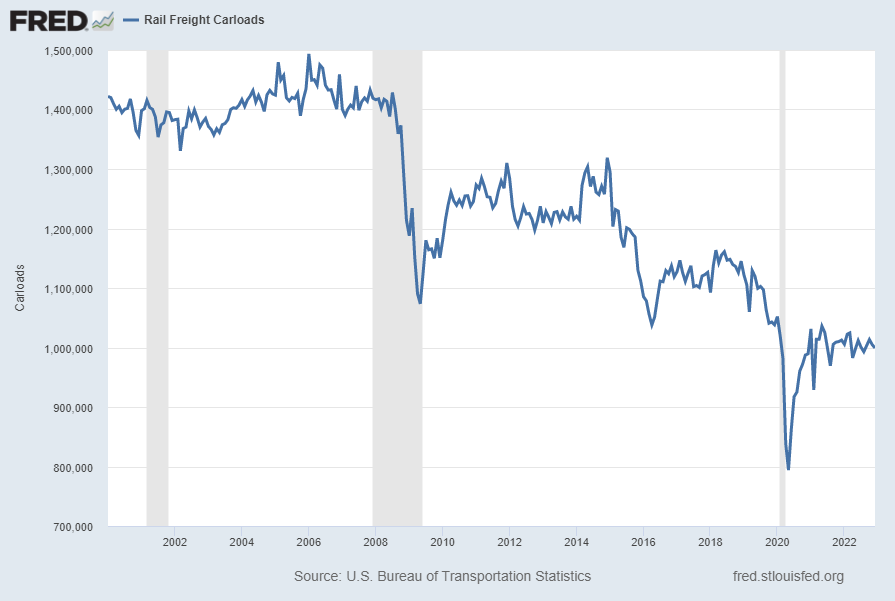
Rail Freight Carloads (RAILFRTCARLOADSD11)
“Rail Freight Carloads” continues to show a generally downward progression from a longer-term perspective. Shown below is a chart with data through December 2022 (last value of 999,239 Carloads), last updated February 8, 2023:
Here is the same measure on a “Percent Change From Year Ago” basis, with value -1.3%:
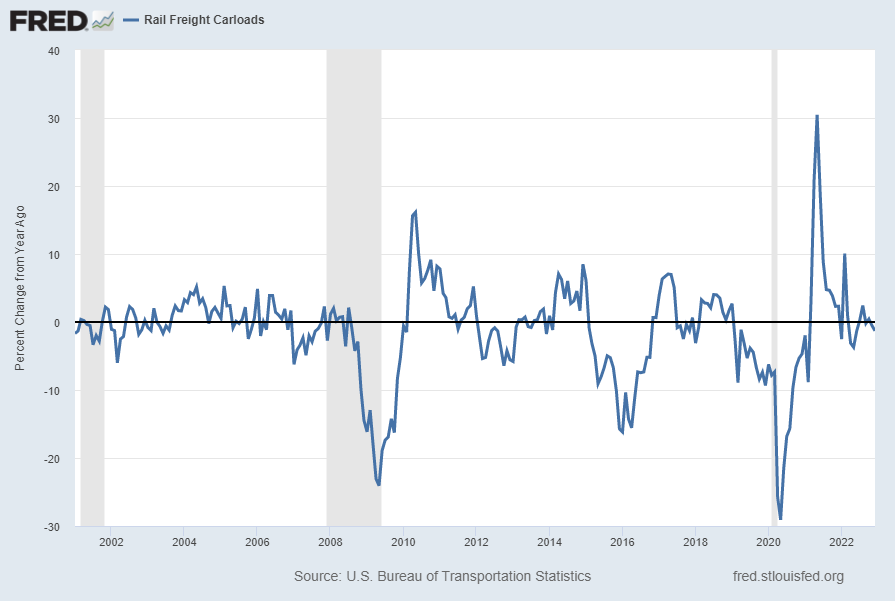
source: U.S. Bureau of Transportation Statistics, Rail Freight Carloads [RAILFRTCARLOADSD11], retrieved from FRED, Federal Reserve Bank of St. Louis; accessed March 7, 2023: https://fred.stlouisfed.org/series/RAILFRTCARLOADSD11
__
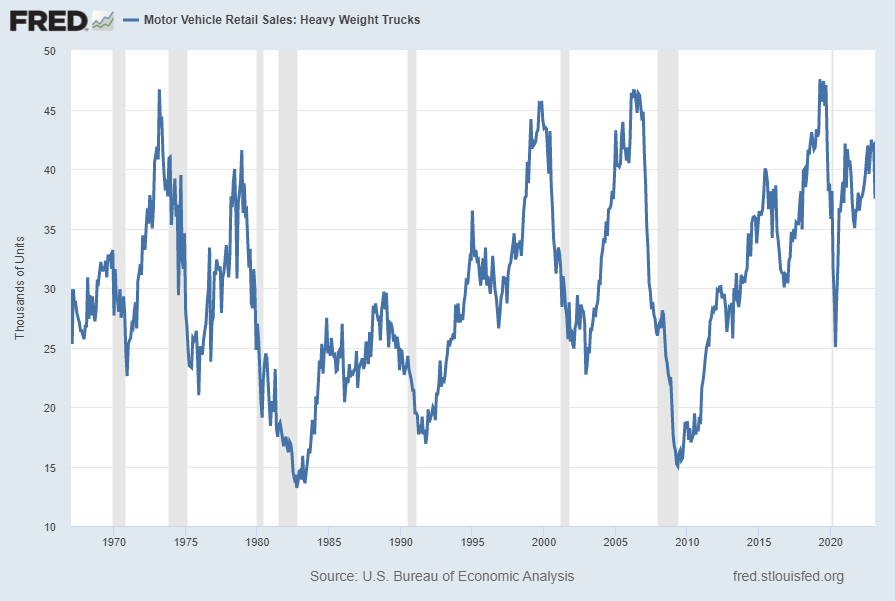
Motor Vehicle Retail Sales: Heavy Weight Trucks (HTRUCKSSA)
Sales of “Heavy Weight Trucks” (HTRUCKSSA) has recently been volatile. Shown below is this measure with last value of 37.498 Thousand through February 2023, last updated March 3, 2023:
Below is this measure displayed on a “Percent Change From Year Ago” basis with value -.3%:
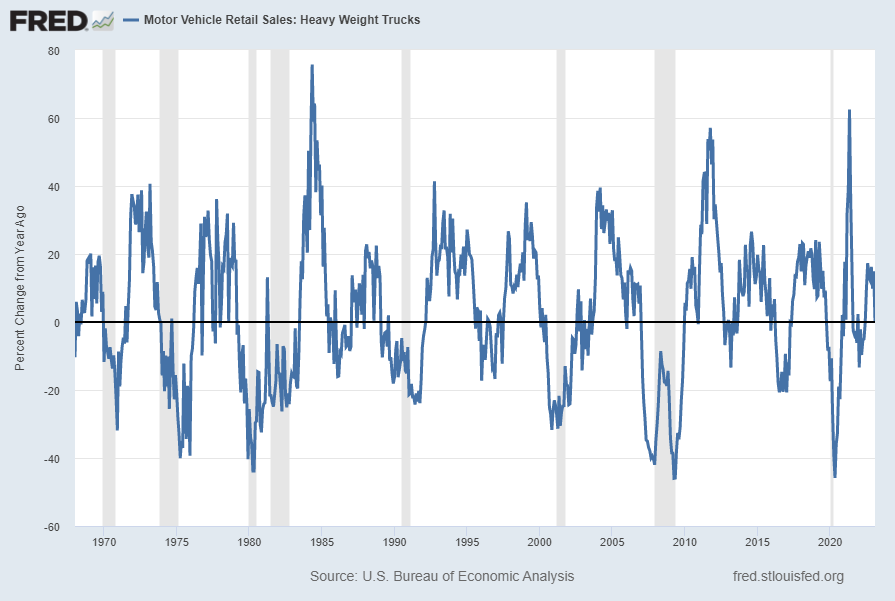
source: U.S. Bureau of Economic Analysis, Motor Vehicle Retail Sales: Heavy Weight Trucks [HTRUCKSSA], retrieved from FRED, Federal Reserve Bank of St. Louis; accessed March 7, 2023: https://fred.stlouisfed.org/series/HTRUCKSSA
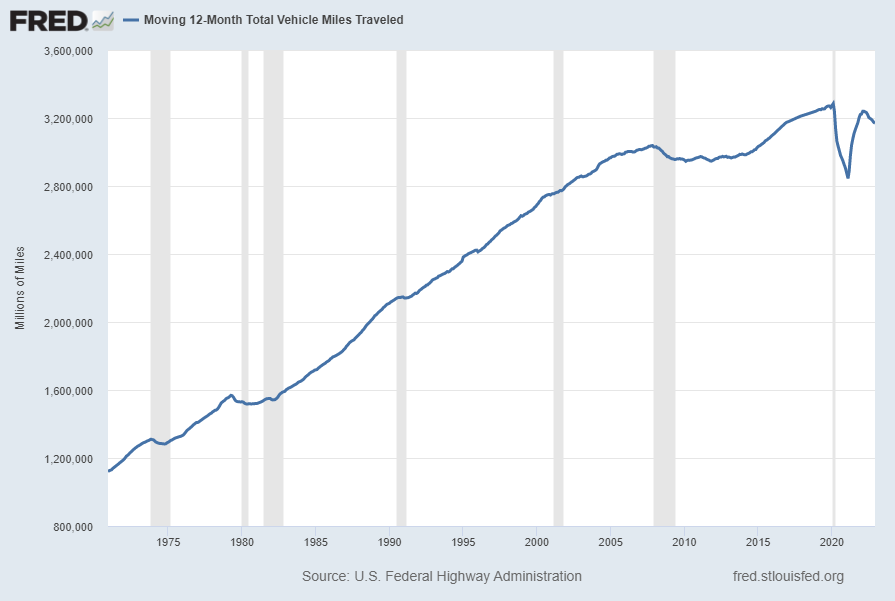
Moving 12-Month Total Vehicle Miles Traveled (M12MTVUSM227NFWA)
An indication of transportation and mobility is the Moving 12-Month Total Vehicle Miles Traveled indicator.
Shown below is this measure (not seasonally adjusted) with last value of 3,169,435 Millions of Miles through December 2022, last updated March 2, 2023:
Below is this measure displayed on a “Percent Change From Year Ago” basis with value -1.6%:
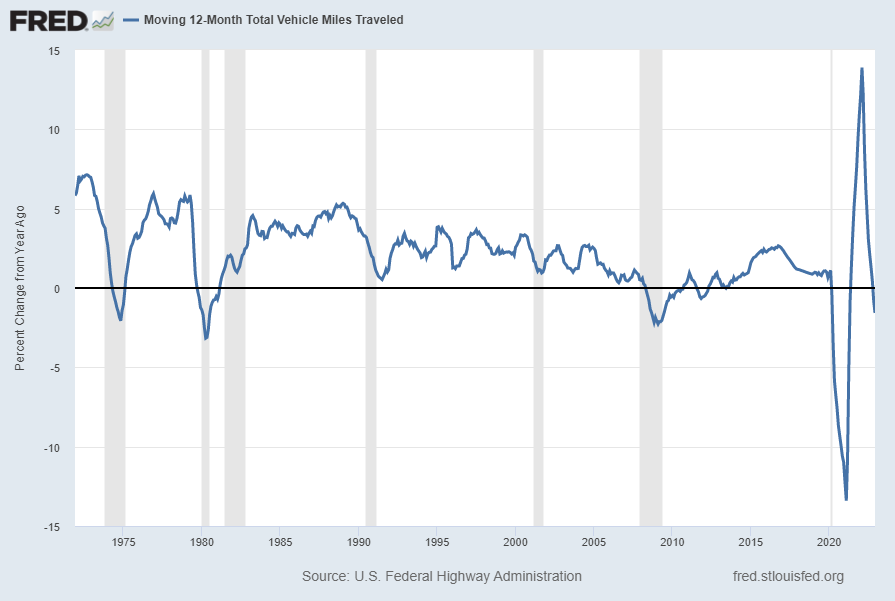
source: U.S. Federal Highway Administration, Moving 12-Month Total Vehicle Miles Traveled [M12MTVUSM227NFWA], retrieved from FRED, Federal Reserve Bank of St. Louis; accessed March 7, 2023: https://fred.stlouisfed.org/series/M12MTVUSM227NFWA
__
Other Indicators
As mentioned previously, many other indicators discussed on this site indicate weak economic growth or economic contraction, if not outright (gravely) problematical economic conditions.
_____
The Special Note summarizes my overall thoughts about our economic situation
SPX at 3986.37 as this post is written
No comments:
Post a Comment