On Wednesday, January 29, 2025 FOMC Chair Jerome Powell gave his scheduled January 2025 FOMC Press Conference. (link of video and related materials)
Below are Jerome Powell’s comments I found most notable – although I don’t necessarily agree with them – in the order they appear in the transcript. These comments are excerpted from the “Transcript of Chair Powell’s Press Conference“ (preliminary)(pdf) of January 29, 2025, with the accompanying “FOMC Statement.”
Excerpts from Chair Powell’s opening comments:
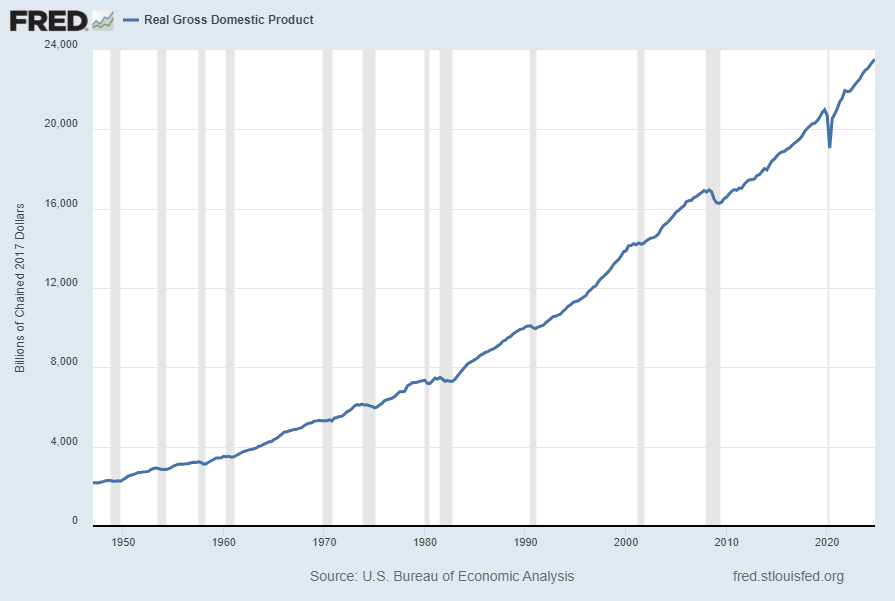
Over the course of our three previous meetings, we lowered our policy rate by a full percentage point from its peak. That recalibration of our policy stance was appropriate in light of the progress on inflation and the rebalancing in the labor market. With our policy stance significantly less restrictive than it had been, and the economy remaining strong, we do not need to be in a hurry to adjust our policy stance. At today’s meeting, the Committee decided to maintain the target range for the federal funds rate at 4-1/4 to 4-1/2 percent.
We know that reducing policy restraint too fast or too much could hinder progress on inflation. At the same time, reducing policy restraint too slowly or too little could unduly weaken economic activity and employment. In considering the extent and timing of additional adjustments to the target range for the federal funds rate, the Committee will assess incoming data, the evolving outlook, and the balance of risks. We are not on any preset course.
also:
As we previously announced, our five-year review of our monetary policy framework is taking place this year. At this meeting, the Committee began its discussions by reviewing the context and outcomes of our previous review that concluded in 2020, as well as the experiences of other central banks in conducting reviews. Our review will again include outreach and public events involving a wide range of parties, including Fed Listens events around the country and a research conference in May. Throughout this process, we will be open to new ideas and critical feedback, and we will take on board lessons of the last five years in determining our findings. We intend to wrap up the review by late summer. I would note that the Committee’s 2 percent longer-run inflation goal will be retained and will not be a focus of the review.
Excerpts of Jerome Powell’s responses as indicated to various questions:
NICK TIMIRAOS. Nick Timiraos, the Wall Street Journal. Chair Powell, you and several of your colleagues said around the time of the last meeting that your policy stance was meaningfully restrictive. Given economic and financial market developments since then, how has your confidence changed in an assessment that says interest rates are meaningfully restrictive?
CHAIR POWELL. I don’t think that my assessment really has changed. I mean a couple of things have happened, we’ve gotten more strong data, but we’ve also seen rates move up at the long end, which could represent a tightening in financial conditions. I think if we look back over goal variables, we’re seeing the economy move toward 2 percent inflation, and has moved largely to maximum employment. So, we literally look at the, at the — at movement toward the goal variables to make that assessment. Now, policy is meaningfully less restrictive than it was before we begin to cut. It’s 100 basis points less restrictive. And for that reason, we’re going to be focusing on seeing real progress on inflation or alternatively, some weakness in the labor market before we, before we consider making adjustments.
NICK TIMIRAOS. If I could follow-up. Does the economy here warrant meaningfully
restrictive interest rates, and would you judge interest rates to still be meaningfully restrictive if you were to lower them by another quarter point?
CHAIR POWELL. So, I think our policy stance is very well calibrated, as I mentioned,
to balance the achievement of our two, of our two goals. We want to, policy to be restrictive enough to continue to foster further, further progress for our 2 percent inflation goal. At the same time, we don’t need to see further weakening in the labor market to achieve that goal, and that’s kind of what we’ve been getting. The labor market has really been broadly stable, the
unemployment rate has been broadly stable now for six months. Conditions seem to be broadly in balance. And I would say look at the last couple of inflation readings and you see, we don’t, we don’t overreact to two good readings or two bad readings, but nonetheless, the last couple of readings have suggested more positive readings. So, I think we’re, I think policy is well positioned.
also:
MATT EGAN. Thank you Chair Powell, Matt Egan from CNN. Following up on Courtenay’s question from earlier about the stock market, how concerned are you, if at all, about potential asset bubble brewing in financial markets? How do relatively high market valuations factor into considerations about potentially lowering interest rates further? Is that something that’s in the back of your mind?
CHAIR POWELL. So we look, with look at from a financial stability perspective at asset prices generally, along with things like leverage in the household sector, leverage in the banking system, funding risk for banks, and things like that. But it’s just one of the four things, asset prices are. And yeah, I’d say they’re elevated by many metrics right now. A good part of that, of course, is this thing around tech and AI, but we look at that. But we also, we look at how resilient the households and businesses and the financial sector are to those things. So we look at that mainly from our financial stability perspective and we think that there’s a lot of resilience out there. Banks have high capital, and households are actually overall, not all households but in the aggregate, households are in pretty good shape financially these days. So, that’s how we think about that. We also, we look at overall financial conditions, and you’ve got, you can’t just take, you can’t just take equity prices, you’ve got to look at rates too, and that, that represents a tightening in conditions with higher rates. So, overall financial conditions are probably still somewhat accommodative, but it’s a mixed bag.
_____
_____
The Special Note summarizes my overall thoughts about our economic situation
SPX at 6069.88 as this post is written
