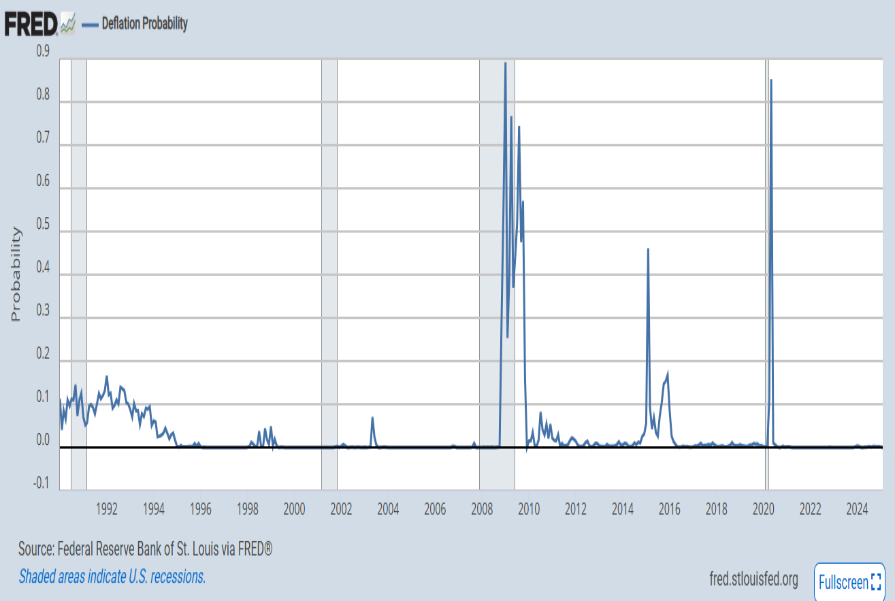
For reference, below is a chart of the St. Louis Fed Price Pressures Measures – Deflation Probability [FRED STLPPMDEF] through February 2025.
While I do not necessarily agree with the current readings of the measure, I view this as a proxy of U.S. deflation probability.
A description of this measure, as seen in FRED:
This series measures the probability that the personal consumption expenditures price index (PCEPI) inflation rate (12-month changes) over the next 12 months will fall below zero.
The chart, on a monthly basis from January 1990 – February 2025, with a last reading of .00000, last updated on February 28, 2025:
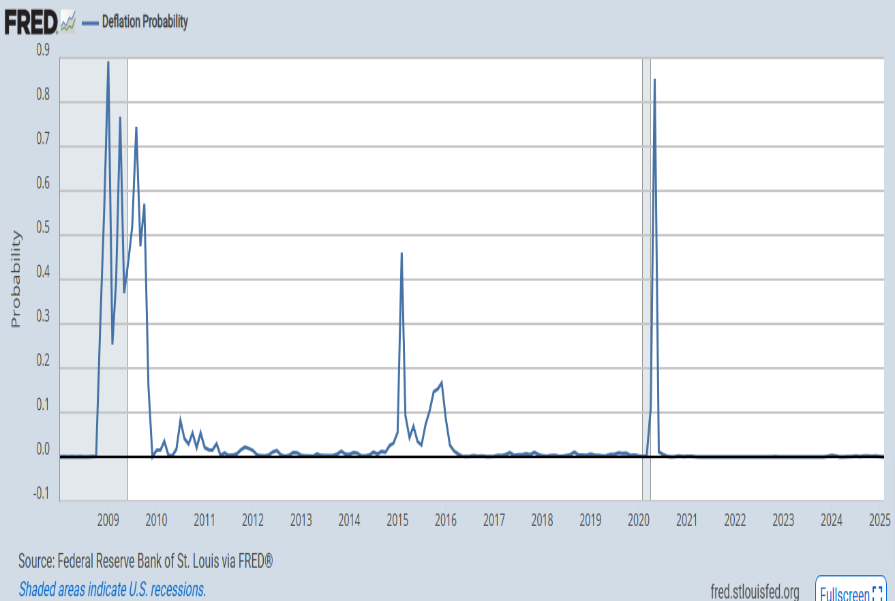
Here is this same U.S. deflation probability measure since 2008:
source: Federal Reserve Bank of St. Louis, Deflation Probability [STLPPMDEF], retrieved from FRED, Federal Reserve Bank of St. Louis; accessed February 28, 2025: https://fred.stlouisfed.org/series/STLPPMDEF
_________
I post various economic indicators and indices because I believe they should be carefully monitored. However, as those familiar with this site are aware, I do not necessarily agree with what they depict or imply.
_____
The Special Note summarizes my overall thoughts about our economic situation
For reference purposes, below are two sets of charts depicting growth in the money supply.
The first shows the M1, defined in FRED as the following:
Before May 2020, M1 consists of (1) currency outside the U.S. Treasury, Federal Reserve Banks, and the vaults of depository institutions; (2) demand deposits at commercial banks (excluding those amounts held by depository institutions, the U.S. government, and foreign banks and official institutions) less cash items in the process of collection and Federal Reserve float; and (3) other checkable deposits (OCDs), consisting of negotiable order of withdrawal, or NOW, and automatic transfer service, or ATS, accounts at depository institutions, share draft accounts at credit unions, and demand deposits at thrift institutions.
Beginning May 2020, M1 consists of (1) currency outside the U.S. Treasury, Federal Reserve Banks, and the vaults of depository institutions; (2) demand deposits at commercial banks (excluding those amounts held by depository institutions, the U.S. government, and foreign banks and official institutions) less cash items in the process of collection and Federal Reserve float; and (3) other liquid deposits, consisting of OCDs and savings deposits (including money market deposit accounts). Seasonally adjusted M1 is constructed by summing currency, demand deposits, and OCDs (before May 2020) or other liquid deposits (beginning May 2020), each seasonally adjusted separately.
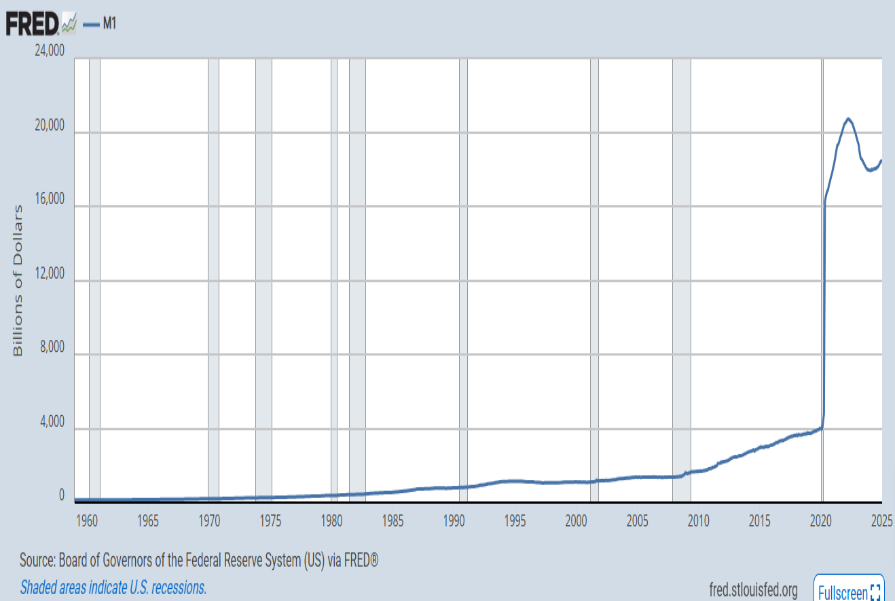
Here is the “M1 Money Stock” (seasonally adjusted) chart, updated on February 25, 2025 depicting data through January 2025, with a value of $18,455.9 Billion:
Here is the “M1 Money Stock” chart on a “Percent Change From Year Ago” basis, with a current value of 2.9%:
Data Source: Board of Governors of the Federal Reserve System (US), M1 Money Stock [M1SL], retrieved from FRED, Federal Reserve Bank of St. Louis; accessed February 25, 2025: https://fred.stlouisfed.org/series/M1SL
The second set shows M2, defined in FRED as the following:
Before May 2020, M2 consists of M1 plus (1) savings deposits (including money market deposit accounts); (2) small-denomination time deposits (time deposits in amounts of less than $100,000) less individual retirement account (IRA) and Keogh balances at depository institutions; and (3) balances in retail money market funds (MMFs) less IRA and Keogh balances at MMFs.
Beginning May 2020, M2 consists of M1 plus (1) small-denomination time deposits (time deposits in amounts of less than $100,000) less IRA and Keogh balances at depository institutions; and (2) balances in retail MMFs less IRA and Keogh balances at MMFs. Seasonally adjusted M2 is constructed by summing savings deposits (before May 2020), small-denomination time deposits, and retail MMFs, each seasonally adjusted separately, and adding this result to seasonally adjusted M1.
Here is the “M2 Money Stock” (seasonally adjusted) chart, updated on February 25, 2025, depicting data through January 2025, with a value of $21,561.4 Billion:
Here is the “M2 Money Stock” chart on a “Percent Change From Year Ago” basis, with a current value of 3.9%:
Data Source: Board of Governors of the Federal Reserve System (US), M2 Money Stock [M2SL], retrieved from FRED, Federal Reserve Bank of St. Louis; accessed February 25, 2025: https://fred.stlouisfed.org/series/M2SL
_____
The Special Note summarizes my overall thoughts about our economic situation
The following is an update of various indicators that are supposed to predict and/or depict economic activity. These indicators have been discussed in previous blog posts:
The February 2025 Chicago Fed National Activity Index (CFNAI) updated as of February 24, 2025:
The CFNAI, with a current reading of -.03:
source: Federal Reserve Bank of Chicago, Chicago Fed National Activity Index [CFNAI], retrieved from FRED, Federal Reserve Bank of St. Louis; accessed February 24, 2025: https://fred.stlouisfed.org/series/CFNAI
The CFNAI-MA3, with a current reading of .03:
source: Federal Reserve Bank of Chicago, Chicago Fed National Activity Index: Three Month Moving Average [CFNAIMA3], retrieved from FRED, Federal Reserve Bank of St. Louis; accessed February 24, 2025: https://fred.stlouisfed.org/series/CFNAIMA3
The ADS Index as of February 20, 2025, reflecting data from March 1, 1960 through February 15, 2025, with last value .157009:
–
The Conference Board Leading Economic Index (LEI), Coincident Economic Index (CEI), and Lagging Economic Index (LAG):
As per the February 20, 2025 Conference Board press release the LEI was 101.5 in January, the CEI was 114.3 in January, and the LAG was 119.3 in January.
An excerpt from the release:
“The US LEI declined in January, reversing most of the gains from the previous two months,” said Justyna Zabinska-La Monica, Senior Manager, Business Cycle Indicators, at The Conference Board. “Consumers’ assessments of future business conditions turned more pessimistic in January, which—alongside fewer weekly hours worked in manufacturing—drove the monthly decline. However, manufacturing orders have almost stabilized after weighing heavily on the Index since 2022, and the yield spread contributed positively for the first time since November 2022. Overall, just four of the LEI’s 10 components were negative in January. In addition, the LEI’s six-month and annual growth rates continued to trend upward, signaling milder obstacles to US economic activity ahead. We currently forecast that real GDP for the US will expand by 2.3% in 2025, with stronger growth in the first half of the year.”
_________
I post various indicators and indices because I believe they should be carefully monitored. However, as those familiar with this site are aware, I do not necessarily agree with what they depict or imply.
_____
The Special Note summarizes my overall thoughts about our economic situation
Perhaps the main reason that I write of our economic situation is that I continue to believe, based upon various analyses, that our economic situation is in many ways misunderstood. While no one likes to contemplate a future rife with economic adversity, current and future economic problems must be properly recognized and rectified if high-quality, sustainable long-term economic vitality is to be realized.
There are an array of indications and other “warning signs” – many readily apparent – that current economic activity and financial market performance is accompanied by exceedingly perilous dynamics.
I have written extensively about this peril, including in the following:
My analyses continues to indicate that the growing level of financial danger will lead to the next stock market crash that will also involve (as seen in 2008) various other markets as well. Key attributes of this next crash is its outsized magnitude (when viewed from an ultra-long term historical perspective) and the resulting economic impact. This next financial crash is of tremendous concern, as my analyses indicate it will lead to a Super Depression – i.e. an economy characterized by deeply embedded, highly complex, and difficult-to-solve problems.
For long-term reference purposes, here is a chart of the Dow Jones Industrial Average since 1900, depicted on a monthly basis using a LOG scale (updated through February 21, 2025 with a last value of 43,428.02):
(click on chart to enlarge image)(chart courtesy of StockCharts.com)
_____
The Special Note summarizes my overall thoughts about our economic situation
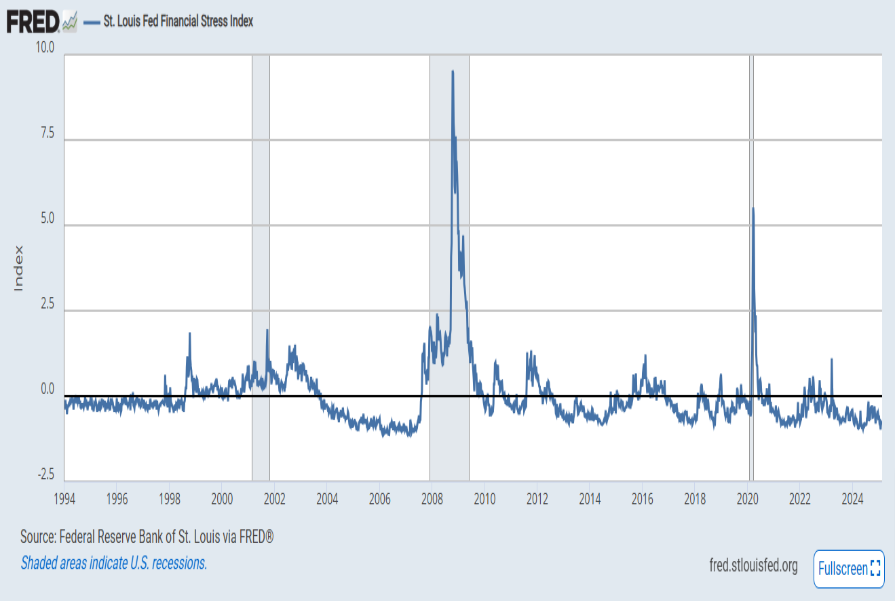
The St. Louis Fed’s Financial Stress Index (STLFSI4) is one index that is supposed to measure stress in the financial system. Its reading as of the February 20, 2025 update (reflecting data through February 14, 2025) is -.8378:
source: Federal Reserve Bank of St. Louis, St. Louis Fed Financial Stress Index [STLFSI4], retrieved from FRED, Federal Reserve Bank of St. Louis; accessed February 20, 2025: https://fred.stlouisfed.org/series/STLFSI4
Of course, there are a variety of other measures and indices that are supposed to measure financial stress and other related issues, both from the Federal Reserve as well as from private sources.
Two other indices that I regularly monitor include the Chicago Fed National Financial Conditions Index (NFCI) as well as the Chicago Fed Adjusted National Financial Conditions Index (ANFCI).
Here are summary descriptions of each, as seen in FRED:
The National Financial Conditions Index (NFCI) measures risk, liquidity and leverage in money markets and debt and equity markets as well as in the traditional and “shadow” banking systems. Positive values of the NFCI indicate financial conditions that are tighter than average, while negative values indicate financial conditions that are looser than average.
The adjusted NFCI (ANFCI). This index isolates a component of financial conditions uncorrelated with economic conditions to provide an update on how financial conditions compare with current economic conditions.
For further information, please visit the Federal Reserve Bank of Chicago’s web site:
Below are the most recently updated charts of the NFCI and ANFCI, respectively.
The NFCI chart below was last updated on February 20, 2025 incorporating data from January 8, 1971 through February 14, 2025 on a weekly basis. The February 14 value is -.64763:
Data Source: FRED, Federal Reserve Economic Data, Federal Reserve Bank of St. Louis; accessed February 20, 2025: http://research.stlouisfed.org/fred2/series/NFCI
–
The ANFCI chart below was last updated on February 20, 2025 incorporating data from January 8, 1971 through February 14, 2025, on a weekly basis. The February 14 value is -.66260:
Data Source: FRED, Federal Reserve Economic Data, Federal Reserve Bank of St. Louis; accessed February 20, 2025: http://research.stlouisfed.org/fred2/series/ANFCI
_________
I post various indicators and indices because I believe they should be carefully monitored. However, as those familiar with this site are aware, I do not necessarily agree with what they depict or imply.
_____
The Special Note summarizes my overall thoughts about our economic situation
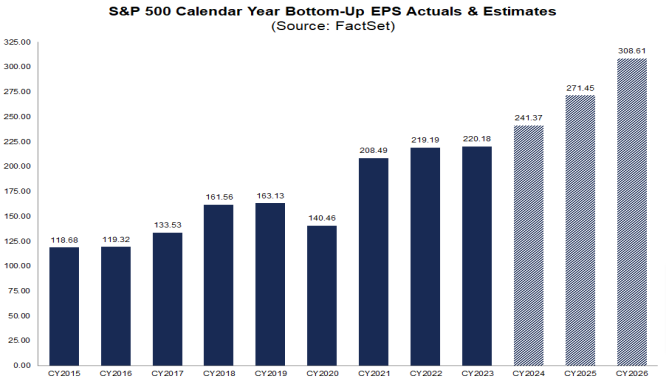
FactSet publishes a report titled “Earnings Insight” that contains a variety of information including the trends and expectations of S&P500 earnings.
For reference purposes, here are two charts as seen in the “Earnings Insight” report of February 14, 2025:
from page 31:
(click on charts to enlarge images)
from page 32:
_____
I post various economic forecasts because I believe they should be carefully monitored. However, as those familiar with this site are aware, I do not agree with many of the consensus estimates and much of the commentary in these forecast surveys.
_____
The Special Note summarizes my overall thoughts about our economic situation
As many are aware, Refinitiv publishes earnings estimates for the S&P500. (My other posts concerning S&P earnings estimates can be found under the S&P500 Earnings label)
The following estimates are from Exhibit 24 of the “S&P500 Earnings Scorecard” (pdf) of February 14, 2025, and represent an aggregation of individual S&P500 component “bottom up” analyst forecasts. For reference, the Year 2014 value is $118.78/share; the Year 2015 value is $117.46/share; the Year 2016 value is $118.10/share; the Year 2017 value is $132.00/share; the Year 2018 value is $161.93/share; the Year 2019 value is $162.93/share; the Year 2020 value is $139.72/share; the year 2021 value is $208.12/share; the year 2022 value is $218.09/share; and the year 2023 value is $221.36/share:
Year 2024 estimate:
$245.56/share
Year 2025 estimate:
$270.95/share
Year 2026 estimate:
$308.72/share
_____
I post various economic forecasts because I believe they should be carefully monitored. However, as those familiar with this site are aware, I do not agree with many of the consensus estimates and much of the commentary in these forecast surveys.
_____
The Special Note summarizes my overall thoughts about our economic situation
For reference purposes, the most current estimates are reflected below, and are as of February 11, 2025:
Year 2024 estimates add to the following:
-From a “bottom up” perspective, operating earnings of $234.10/share
-From a “bottom up” perspective, “as reported” earnings of $210.81/share
Year 2025 estimates add to the following:
-From a “bottom up” perspective, operating earnings of $268.45/share
-From a “bottom up” perspective, “as reported” earnings of $249.13/share
Year 2026 estimates add to the following:
-From a “bottom up” perspective, operating earnings of $308.52/share
-From a “bottom up” perspective, “as reported” earnings of $289.64/share
_____
I post various economic forecasts because I believe they should be carefully monitored. However, as those familiar with this site are aware, I do not agree with many of the consensus estimates and much of the commentary in these forecast surveys.
_____
The Special Note summarizes my overall thoughts about our economic situation
The survey shows, among many measures, the following median expectations:
Real GDP: (annual average level)
full-year 2025: 2.4%
full-year 2026: 2.2%
full-year 2027: 1.8%
full-year 2028: 2.0%
Unemployment Rate: (annual average level)
for 2025: 4.2%
for 2026: 4.2%
for 2027: 4.3%
for 2028: 4.3%
–
Regarding the risk of a negative quarter in real GDP in any of the next few quarters, mean estimates are 9.7%, 15.4%, 19.8%, 23.3% and 23.7% for each of the quarters from Q1 2025 through Q1 2026, respectively.
As well, there are also a variety of time frames shown (present quarter through the year 2034) with the median expected inflation (annualized) of each. Inflation is measured in Headline and Core CPI and Headline and Core PCE. Over all time frames expectations are shown to be in the 2.1% to 3.0% range.
_____
I post various economic forecasts because I believe they should be carefully monitored. However, as those familiar with this site are aware, I do not agree with many of the consensus estimates and much of the commentary in these forecast surveys.
_____
The Special Note summarizes my overall thoughts about our economic situation
My overall analysis indicates a continuing elevated and growing level of financial danger which contains many worldwide and U.S.-specific “stresses” of a very complex nature. I have written numerous posts on this site concerning both ongoing and recent “negative developments.” These developments, as well as other exceedingly problematical conditions, have presented a highly perilous economic environment that endangers the overall financial system.
Also of ongoing immense importance is the existence of various immensely large asset bubbles, a subject of which I have extensively written. While all of these asset bubbles are wildly pernicious and will have profound adverse future implications, hazards presented by the bond market bubble are especially notable.
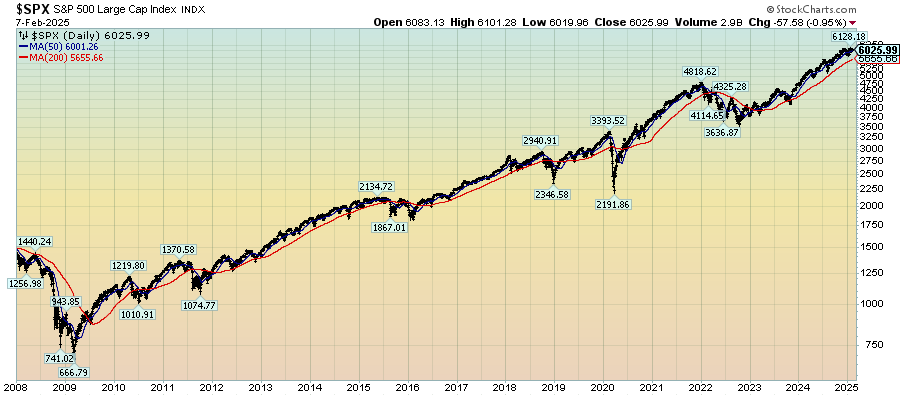
Predicting the specific timing and extent of a stock market crash is always difficult, and the immense complexity of today’s economic situation makes such a prediction even more challenging. With that being said, my analyses continue to indicate that a near-term exceedingly large (from an ultra long-term perspective) stock market crash – that would also involve (as seen in 2008) various other markets – will occur. [note: the “next crash” and its aftermath has paramount significance and implications, as discussed in the post of January 6, 2012 titled “The Next Crash And Its Significance“ and various subsequent posts in the “Economic Depression” label]
As reference, below is a daily chart since 2008 of the S&P500 (through February 7, 2025 with a last price of 6025.99), depicted on a LOG scale, indicating both the 50dma and 200dma as well as price labels:
(click on chart to enlarge image)(chart courtesy of StockCharts.com; chart creation and annotation by the author)
_____
The Special Note summarizes my overall thoughts about our economic situation