This post is an update to various past posts concerning the stock market bubble, most recently that of November 21, 2013 titled "Is The Stock Market Experiencing A Bubble?"
Many people don't believe that we are currently experiencing a stock market bubble because their primary reference regarding stock market bubbles is that of the mid- to late-1990s, in which there was a stock market bubble with immense speculative activity, wildly resplendent "price action" in the technology and internet sectors, and many exceedingly high (in some cases stratospheric) company valuations. It was an amazingly notable period for many reasons.
Today's overall stock market bubble is not as "overt" and "flamboyant" in nature and many "bubble" aspects aren't necessarily (widely) recognized or necessarily understood. However, just because the obvious signs aren't glaringly obvious doesn't mean that the bubble's magnitude is smaller.
One of the problems in identifying an asset bubble is that there is no standard definition of one, and many - if not most - bubbles are identified "after the fact." As there is no standard definition of an asset bubble, there is no definitive measures to "prove" or "disprove" of one's existence.
However, there are many underlying financial conditions that historically have led to asset bubbles. While the list is extensive, among the more notable conditions are (ultra) easy monetary policy and the accompanying ultra-low interest rate environment, both of which have been extant for a number of years now.
My posts concerning the existence of the stock market as being in an asset bubble date back to 2011. While I base this view both on technical analysis and fundamental analysis factors, in this post I will primarily focus on fundamental measures. While a full discussion of these factors would be exceedingly lengthy and, at times, very complex, below is discussion of some of the more notable factors, including earnings and valuations.
Earnings
Perhaps the most common equity valuation metric in use today is the P/E ratio. By this measure, stocks don't necessarily appear exceedingly expensive. One way to look at it is the from the FactSet Earnings Insight of February 13, 2015 (pdf), which says:
The current 12-month forward P/E ratio is 17.1. This P/E ratio is well above the 5-year (13.6) average and the 10-year (14.1) average.
However, my analyses indicate that earnings are being impacted by a variety of special factors that likely will prove transitory in nature. Among these factors - which are further discussed in the November 21, 2013 post mentioned above - are ultra-low interest rates and share buybacks. As well, the decline in corporate taxes has played a role, as discussed in the June 3, 2014 ProfitabilityIssues.com post titled "Long-Term Trends And Sources Of Corporate Profitability Growth."
Other factors that have increased profitability is cost-cutting, subdued hiring, and continually-low increases in (nominal) labor costs.
As a result of myriad factors, the S&P500 net profit margin is notably high from a historical perspective. According to the Wall Street Journal article of February 1, S&P500 net profit margins "averaged 8.4% between 1999 and 2013," and are now 10.1% (Historical and projected S&P500 net profit margins are seen in the February 5, 2015 ProfitabilityIssues.com post titled "S&P500 Net Profit Margins - 2 Charts.")
Of note, this occurred during a recent period of low revenue growth. Additionally, as one can see from both the net profit margins chart mentioned above as well as in the Wall Street Journal article, consensus analyst expectations are for a further rise of net profit margins to over 11% by 2016.
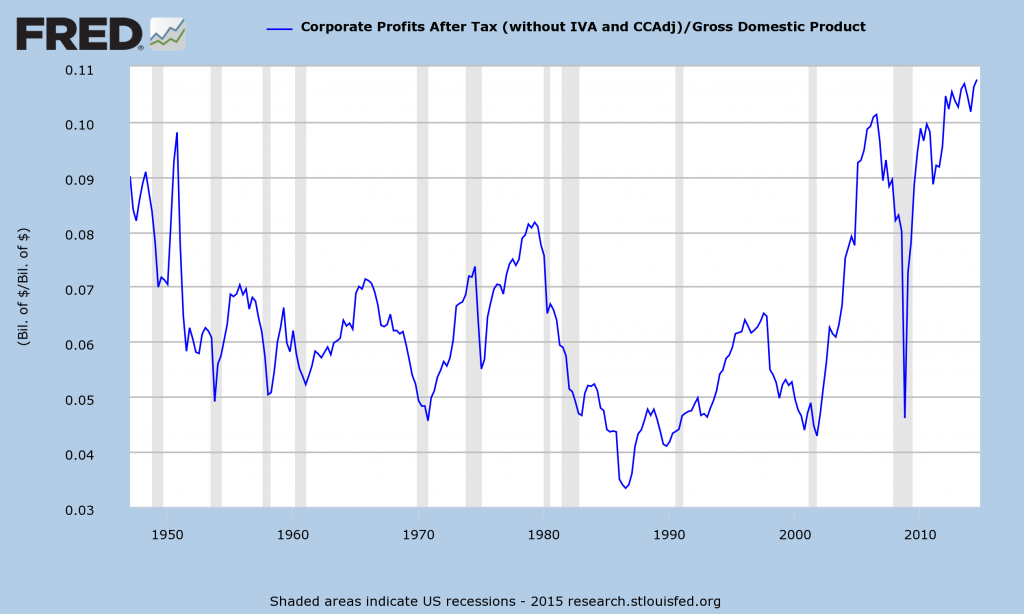
Other metrics illustrate how distended the aggregate level of profitability is from a long-term historical perspective. One measure that can be used is (After-Tax) Corporate Profits as a Percent of GDP. This chart is seen below. From 1947 through the 3rd quarter of 2014, the average is 6.5% and the median is 6.2%. The Q3 2014 value is 10.8%:
US. Bureau of Economic Analysis, Corporate Profits After Tax (without IVA and CCAdj) [CP], retrieved from FRED, Federal Reserve Bank of St. Louis https://research.stlouisfed.org/fred2/series/CP/, February 13, 2015.US. Bureau of Economic Analysis, Gross Domestic Product [GDP], retrieved from FRED, Federal Reserve Bank of St. Louis:https://research.stlouisfed.org/fred2/series/GDP/, February 13, 2015.
Stock Market "Price Action" And Valuations
Stock market "price action" and valuations are other notable aspects of today's stock market bubble. For reference, here is a long-term chart of the S&P500 since 1925 (depicted on a LOG scale through February 13, 2015):
(click on charts to enlarge image)(chart courtesy of StockCharts.com)
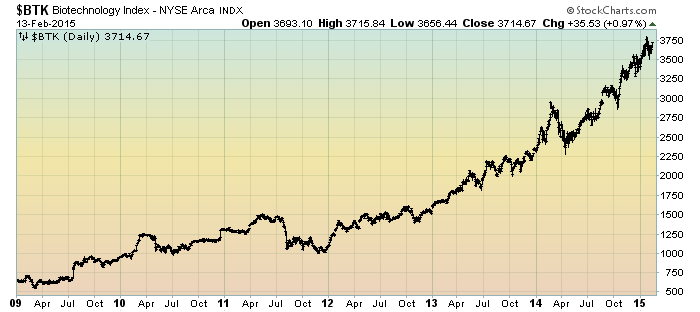
While, admittedly, the recent overall stock "price action" isn't as "frenzied" as it was in the late 1990s, there are many pockets of extreme stock valuations and/or continuously sharply rising stock prices. With regard to the former, there are many large-cap stocks that appear highly overvalued based upon measures including (continual) lack of profitability. With regard to the latter, there are many stocks - including those in the biotech sector - that exhibit "frothy" stock "price action." This can be seen in the parabolic advance seen in various biotech indices, including the BTK Biotechnology Index seen below:
(click on charts to enlarge image)(chart courtesy of StockCharts.com)
As well, there are many valuation measures that would indicate that stocks are expensive, if not very much so. When one uses stock market valuation measures other than the P/E ratio, one often sees the stock market as either being (very) expensive or in “bubble” territory. These other valuation measures include the Q-Ratio and CAPE (“Shiller PE”), etc. (note: these factors are discussed in Doug Short’s “Market Valuation Overview.”)
As well, there is the stock market capitalization to GDP measure, which is seen in Doug Short's post of January 7, 2015 ("Market Cap to GDP: The Buffett Valuation Indicator"):
In addition to these many instances of notably rich public stock valuations, there is also the tangential issue of notably high private company valuations. This issue has been recently discussed in the January 22, 2015 Fortune article titled "The Age of Unicorns," subtitled "The billion-dollar tech startup was supposed to be the stuff of myth. Now they seem to be … everywhere," as well as the Barron's article of December 8, 2014 titled "This Time It's Different."
Size Of The Stock Market Bubble
While the above discussion indicates a stock market that is overvalued, if not very much so, there are many reasons why the stock market bubble is far larger than any before it. One of the reasons is the current distension - and forthcoming mean reversion - of many of the measures discussed above.
While a detailed mean reversion discussion would be very lengthy and complicated - and as such isn't suitably discussed in a brief manner - it is highly relevant with regard to the potential downside and associated financial and economic dynamics that will come into play. As well, the consequences of mean reversion will determine the magnitude of the ultimate stock market price decline, which will be the main measure as to this bubble's magnitude.
While projections are difficult to make due to a number of factors and the uncertainty that would accompany such a rapidly changing environment, changes in overall stock market valuations will certainly be far greater than most would assume. It appears that this issue of mean-reversion and the resulting revaluation greatly lacks recognition.
_____
The Special Note summarizes my overall thoughts about our economic situation
SPX at 2096.99 as this post is written


No comments:
Post a Comment